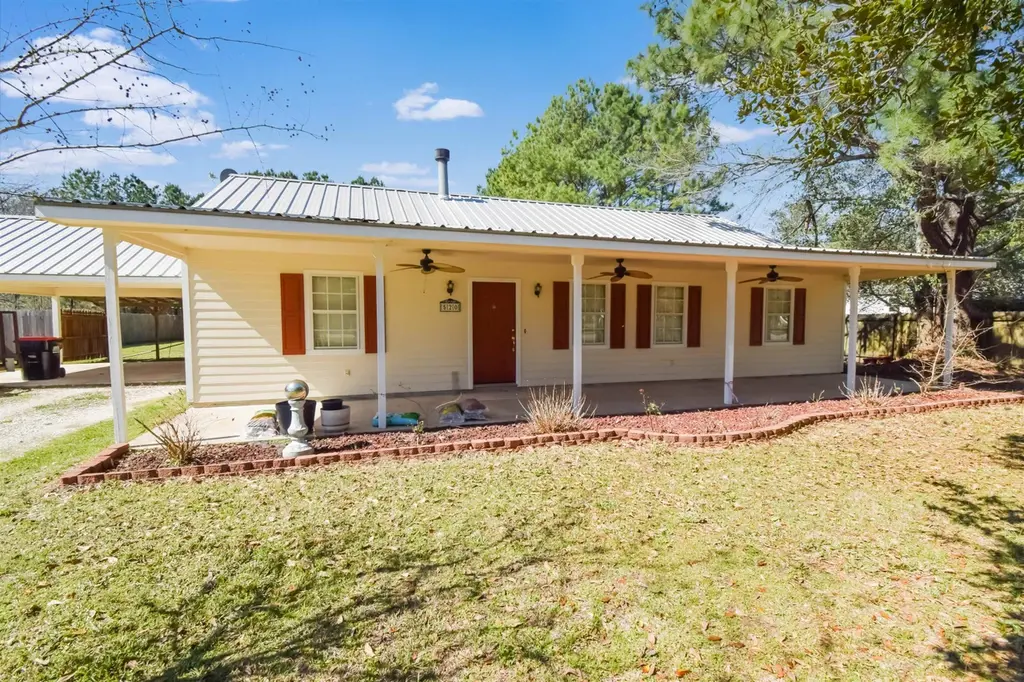
520 Ryan Rd · Sour Lake, TX
Flood risk 7/10 · Major
- FEMA flood zone
- X (unshaded)
- Chance of flooding over 30 yrs
- 0.99%
- Est. flood insurance / yr
- $507 – $1,088
Fire risk 5/10 · Moderate
- Est. fire insurance / yr
- $1,222 – $2,270
Heat risk 9/10 · Severe
- Hot days now (above 110°F)
- 7 days/yr
- Hot days in 30 yrs
- 25 days/yr
Wind risk 9/10 · Severe
- Chance of severe wind over 30 yrs
- 99.0%
Air-quality risk 2/10 · Minimal
- Unhealthy air days now
- 0 days/yr
- Unhealthy air days in 30 yrs
- 1 days/yr
Risk factors via First Street. Map © Google.
Why this score? — see what drove the C- grade
The composite is a weighted blend of 9 inputs, each scored 0–100. Each bar is that input's sub-score; the figure is the points it added to the 100-point composite (weight × sub-score).
- Cash flow +16.0/30.0
- ARV discount +14.0/15.0
- DSCR +4.9/10.0
- Schools +4.5/10.0
- 1% rule +4.4/10.0
- Livability +3.5/5.0
- Rent growth +2.5/5.0
- Condition / age +2.5/5.0
- Appreciation +0.0/10.0
$240,000
🖨 Deal sheet (PDF) 📄 Offer letter ✓ Due diligence
Listing remarks MLS
This charming home in Sour Lake offers 3 bedrooms, 2 bathrooms and spans 1,632 sqft. Located in the desirable Hardin Jefferson School District, this property is perfect for families looking for a spacious and comfortable living space. The home features a cozy layout with ample natural light, a well- appointed kitchen and a lovely outdoor area for relaxation and entertainment. Don't miss out on the opportunity to make this house your new home!
Key facts
- 2 parking spots
- Listed 285 days
Neighborhood map
What this means for you Summary
Snapshot
- This is a 3-bed/2.0-bath single-family listed at $240k.
Deal economics
- At list price, monthly cash flow is $50 ($605/yr) — positive.
- The deal already cash-flows at list — no discount required.
- To meet the 1% rule (rent ≥ 1% of price), the offer needs to be $225k (6.2% below list).
- Recommended offer: $211k (12.0% below list) — sets the bar for market timing.
- Cap rate 6.9% vs local median 4.8% in Sour Lake — top-decile yield for the area; either an underpriced asset or a hidden risk that comps aren't pricing in. Stress-test before assuming the spread holds.
Location & tenants
- Location reads 70/100 on livability (#352 in TX) — a middle-class / working-renter tenant base. Strengths: cost of living A+, housing A+, crime A; Watch: amenities F, commute F.
- Hardin-Jefferson ISD (rural): math 54% / reading 49% proficiency, ranked #135 of 826 in TX (top 16%) — acceptable for families but not a draw, mixed tenant base, ~2y average lease.
- Zoned schools: Sour Lake El (math 43% / reading 43%, grade F, #1,283 of 4,322 statewide, top 30%, 767 students, 42% FRL); Henderson Middle (math 59% / reading 47%, grade C+, #281 of 1,662 statewide, top 18%, 617 students, 41% FRL); Hardin-Jefferson H S (math 68% / reading 67%, grade B, #158 of 1,632 statewide, top 10%, 749 students, 38% FRL).
- Market conditions: 94 active listings in the ZIP; 1 comparable units currently listed for rent nearby; 358 units permitted in Hardin County in 2024 (0 in 5+ unit buildings).
Forward outlook
- Local home prices are declining (-3.0%/yr); year-one equity from $2k of loan paydown is wiped out by about $7k of value loss. Plan a longer hold.
Negotiation context
- It's been on market 285 days — a 12% lower offer ($211k) is reasonable based on typical stale-listing flexibility.
Risks & watch-outs
- Watch-outs: flood insurance adds $66/mo.
- Climate carrying-cost: major flood risk; severe wind risk, 99% chance of damaging wind over 30y; moderate wildfire risk; extreme-heat days projected 7→25/yr by 2055 (HVAC capex compounding) — expect insurance premiums to compound above CPI over the hold.
Questions for the listing agent
- It's been on market 285 days. Have you received any prior offers? Is the seller open to a 12% concession, seller financing, or rate buy-down credit?
- What's the actual annual flood-insurance premium (NFIP or private), and is the property in a SFHA with mandatory coverage?
- Why hasn't it sold? Are there any deal-killer items the seller is aware of (foundation, flood, title, zoning, code violations)?
- Is there a deadline driving the sale (1031 exchange, divorce, estate, relocation)? That informs how much negotiation room exists.
- What's the average days-on-market for RENTAL listings here right now (not sales)? A rising rental-DOM trend means longer vacancies and softer asking-rent achievability than the comps imply.
- What's the recent tenant-quality profile in this submarket — average credit score on applications, eviction rate, late-payment / NSF rate, and stable-employment percentage? A property-management company in the area should have these aggregated.
- How much new for-sale + rental construction is in the pipeline within 1–3 miles? Heavy new supply typically softens prices + rents 12–24 months out; constrained supply supports both.
Investment metrics
- 1% rule
- 0.94% ✗
- Cap rate
- 6.88%
- Cash-on-cash
- 2.09%
- DSCR
- 1.09
- GRM
- 8.9
CMA / ARV
- ARV (median comp)
- $280,416
- List price
- $240,000
- Delta
- -14.41%
- Verdict
- UNDERPRICED
- Comps
- 20 within 1.0 mi
Show comp detail 1 sale within ~0.75 mi
| Address | Dist | Beds/Ba | Sqft | Sold | Price | $/sf | Match |
|---|---|---|---|---|---|---|---|
| 1115 Old Beaumont Rd | 0.31mi | 3/2.0 | 1,512 (-7%) | 21mo | $279,500 | $185 | 56 |
Match score weights: distance 35% · size 25% · config 20% · recency 20%. Top-matched comps best support the ARV.
Projected returns pro-forma
-3.0% appreciation · 3.0% rent growth · sell at horizon
- IRR
- -14.8%
- Equity multiple
- 0.47×
- Total profit
- $-35,605
- Equity at exit
- $35,785
- IRR
- -6.1%
- Equity multiple
- 0.60×
- Total profit
- $-26,563
- Equity at exit
- $20,751
Cash invested: $67,200 (down + closing). Projections, not guarantees.
Landlord ↔ Tenant lean methodology
- Overall (STATE)
- 87 Strongly Landlord-Friendly
- State Texas
- 87 Strongly Landlord-Friendly · R+5
- County
- — inherits STATE
- City
- — inherits STATE
ZIP-level market 77659
- Active inventory
- 94
- Price-to-rent
- 8.9×
Monthly cashflow live
- Estimated rent
- $2,250 medium interval (Pro) →
- Mortgage (P&I)
- −$1,259
- Tax from tax record
- −$302 /mo · $3,625/yr
- Insurance
- −$100
- Flood insurance flood zone
- −$66 /mo · $798/yr
- HOA
- −$0
- Vacancy / Maint / Mgmt
- −$472
- Net cashflow
- $50
Break-even live
Sensitivity live
| Price | -10% $186 | -5% $118 | +0% $50 | +5% $-18 | +10% $-85 |
|---|---|---|---|---|---|
| Rent | -10% $-127 | -5% $-38 | +0% $50 | +5% $139 | +10% $228 |
| Rate | -1.0pp $171 | -0.5pp $111 | base $50 | +0.5pp $-12 | +1.0pp $-75 |
UW: 25.0% down · 7.5% · 30yr · 1.5% tax · 5.0% vac · 8.0% maint · 8.0% mgmt
Financing live
Cash to close
- Down payment
- $60,000
- Closing costs
- $7,200
- Reserves months
- —
- Total cash needed
- —
Loan-product check · same deal, 3 products live
Conventional
25% down · 7.5% · 30yr
- Down + closing
- —
- Monthly P&I
- —
- Monthly cashflow
- —
- DSCR
- —
- Eligible?
- —
Personal DTI + credit; lowest rate.
DSCR
20% down · 8.5% · 30yr
- Down + closing
- —
- Monthly P&I
- —
- Monthly cashflow
- —
- DSCR
- —
- Eligible?
- —
No personal income docs; deal must DSCR.
Hard money
10% down · 12.0% · 12mo
- Down + closing
- —
- Monthly P&I
- —
- Monthly cashflow
- —
- DSCR
- —
- Eligible?
- —
Short-term bridge; refi at stabilization.
Rent comps 1 comps
| Address | Beds | Baths | Sqft | Rent | $/sqft | DOM | Units | Dist |
|---|---|---|---|---|---|---|---|---|
| 1500 Holly Trl Sour Lake, TX | 3.0 | 2.0 | 1810 | $2,250 | $1.24 | 23d | 1 | 0.85mi |
Listing history 21 events
-
2026-06-21days on market $240,000 Active 285 DOM
-
2026-06-18days on market $240,000 Active 282 DOM
-
2026-06-17days on market $240,000 Active 281 DOM
-
2026-06-16days on market $240,000 Active 280 DOM
-
2026-06-15days on market $240,000 Active 279 DOM
-
2026-06-14days on market $240,000 Active 277 DOM
-
2026-06-10days on market $240,000 Active 274 DOM
-
2026-06-09days on market $240,000 Active 273 DOM
-
2026-06-08days on market $240,000 Active 272 DOM
-
2026-06-07days on market $240,000 Active 271 DOM
-
2026-06-03days on market $240,000 Active 267 DOM
-
2026-06-02days on market $240,000 Active 266 DOM
-
2026-06-01days on market $240,000 Active 265 DOM
-
2026-05-31days on market $240,000 Active 264 DOM
-
2026-05-30days on market $240,000 Active 263 DOM
-
2026-03-10price $240,000 446-char remark
Show marketing remark (446 chars)
This charming home in Sour Lake offers 3 bedrooms, 2 bathrooms and spans 1,632 sqft. Located in the desirable Hardin Jefferson School District, this property is perfect for families looking for a spacious and comfortable living space. The home features a cozy layout with ample natural light, a well- appointed kitchen and a lovely outdoor area for relaxation and entertainment. Don't miss out on the opportunity to make this house your new home!
-
2025-09-09$260,000 Active 446-char remark
Show marketing remark (446 chars)
This charming home in Sour Lake offers 3 bedrooms, 2 bathrooms and spans 1,632 sqft. Located in the desirable Hardin Jefferson School District, this property is perfect for families looking for a spacious and comfortable living space. The home features a cozy layout with ample natural light, a well- appointed kitchen and a lovely outdoor area for relaxation and entertainment. Don't miss out on the opportunity to make this house your new home!
-
2025-08-14price $270,000
-
2025-04-01price $280,000
-
2024-07-12price $289,000
-
2024-04-18price $299,000
ⓘ Source: listings_history table (triggers on properties + properties_extension) + one-shot
backfill from property_details.listing_events for pre-trigger history.
Tax reassessment forecast TX · Resets to sale price
- Current annual tax
- $3,625 · $302/mo
- Projected year-2 tax
- $4,392 · $366/mo
- Expected delta
- +$767/yr (+$64/mo · 21.2%)
ⓘ Screening estimate from a state-policy table — verify with the county assessor before closing.
Climate risk First Street
- Flood 7/10 Severe FEMA zone X (unshaded) · 99% chance over 30 yrs
- Wildfire 5/10 Major
- Heat 9/10 Extreme 7 d/yr ≥110°F today · 25 d/yr by 30 yrs out
- Wind 9/10 Extreme 99% chance of damaging wind over 30 yrs
- Air quality 2/10 Low 0 unhealthy d/yr today · 1 by 30 yrs out
Nearby sold comps map
Loading sold comps map…
Walkable amenities ~0.75 mi
Loading nearby amenities…
Taxation est. · year 1
- Rental income
- $27,000
- − Mortgage interest
- −$13,444
- − Property taxes
- −$3,625
- − Insurance
- −$1,997
- − Repairs & maintenance
- −$2,160
- − Management
- −$2,160
- − Depreciation
- −$6,982
- Taxable loss
- −$3,368
- Est. tax savings @ 24.0%
- +$808
- After-tax cash flow
- $1,413/yr
For passive investors: Depreciation is non-cash, so a rental often shows a tax loss while cash-flowing — sheltering income. Rental losses are passive: they offset passive income freely, and up to $25,000/yr can offset ordinary (W-2) income if you actively participate and your MAGI is under $100k (phasing out to $0 by $150k); unused losses carry forward. On sale, claimed depreciation is recaptured at up to 25%, and gains may owe capital-gains tax (a 1031 exchange can defer both). Figures are a year-1 estimate at your 24.0% rate — not tax advice; consult a CPA.
Schools (NCES district)
- District
- Hardin-Jefferson ISD
- NCES district ID
- 4822410
- Math proficiency
- 54% ▼ -5.00%
- Reading proficiency
- 49% ▼ -4.00%
- Median HH income
- $61,336
- Composite
- 45.14/100
- National rank
- #2682
- State rank
- #135 of 826 in TX
Livability — Sour Lake
- Score
- 70/100
- State rank
- #352
- US rank
- #7687
Category grades
Schools grade is shown separately in the Schools card above.
Census & demographics
- Census place
- Sour Lake, TX
- Population (ZIP)
- 5,847
Population outlook (Hardin County) Hauer SSP2
- Today (2025)
- 57,780 people
- By 2030
- 58,296 · +0.9%
- By 2040
- 58,421 · +1.1%
- By 2050
- 57,391 · -0.7%
- By 2075
- 53,132 · -8.0%
- By 2100
- 44,905 · -22.3%
Race, ethnicity, and origin ACS 2023
- Neighborhood character
- Predominantly White (87%)
- Race & ethnicity
- White 87% Hispanic / Latino 9% Two or more races 4% Black 2%
- Hispanic origin (detail)
- Mexican 9%
- Common ancestry
- Lithuanian 9% Romanian 2% Slovak 1%
- Foreign-born
- 3% · Canada, Vietnam
- Languages at home
- 93% English-only · Spanish 6%
Political lean MEDSL · Hardin
- 2024 margin
- Solid R (+75.8) · D 11.9% · R 87.7%
- 2008→2024 swing
- -14.6pp toward R · 2008: -61.2pp · 2024: -75.8pp
- All cycles
- 2024: R+75.8 2020: R+73.8 2016: R+73.9 2012: R+67.6 2008: R+61.2
Not yet ingested
- Civics
- —
Market trends
- HPI YoY
- ▼ -103.72%
- Current HPI
- 184.5266
- Rent YoY
- —
- Metro
- —
- State GDP YoY
- ▲ 3.95%
- F500 in state
- 110
Industry mix (Fortune 500 HQ in TX)
| Industry | F500 HQs | Revenue |
|---|---|---|
| Energy | 16 | $1,198B |
|
||
| Technology | 5 | $198B |
|
||
| Engineering / Construction | 4 | $72B |
|
||
| Energy Services | 3 | $60B |
|
||
| Utilities | 3 | $41B |
|
||
| Healthcare | 2 | $330B |
|
||
Price history
-19.7% since first listed6 events — show timeline
- 2026-03-10 Price Changed $240,000 BBOR
- 2025-09-09 Listed $260,000 BBOR
- 2025-08-14 Price Changed $270,000 BBOR
- 2025-04-01 Price Changed $280,000 BBOR
- 2024-07-12 Price Changed $289,000 BBOR
- 2024-04-18 Price Changed $299,000 BBOR
Property tax history
+4.1%/yrLatest (2025): $3,625 · +11.1% YoY. Source: county tax records.
Cash-flow waterfall
monthlySold comps — $/sqft
last 12 mo · ≤1 miLoading sold comps…