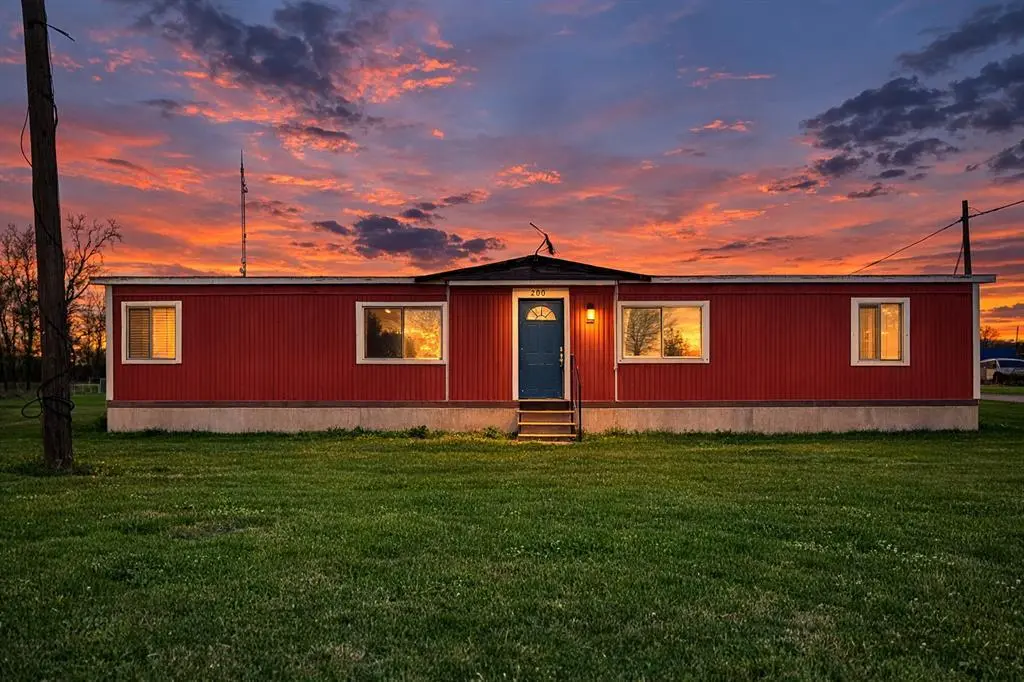
200 Olive St · Emhouse, TX
Flood risk 1/10 · Minimal
- FEMA flood zone
- X (unshaded)
- Chance of flooding over 30 yrs
- 0.0%
- Est. flood insurance / yr
- $507 – $1,088
Fire risk 7/10 · Major
- Est. fire insurance / yr
- $1,222 – $2,270
Heat risk 7/10 · Major
- Hot days now (above 110°F)
- 7 days/yr
- Hot days in 30 yrs
- 25 days/yr
Wind risk 6/10 · Moderate
- Chance of severe wind over 30 yrs
- 60.0%
Air-quality risk 2/10 · Minimal
- Unhealthy air days now
- 0 days/yr
- Unhealthy air days in 30 yrs
- 1 days/yr
Risk factors via First Street. Map © Google.
Why this score? — see what drove the F grade
The composite is a weighted blend of 9 inputs, each scored 0–100. Each bar is that input's sub-score; the figure is the points it added to the 100-point composite (weight × sub-score).
- Cash flow +7.9/30.0
- ARV discount +7.5/15.0
- Schools +3.5/10.0
- Livability +2.6/5.0
- Condition / age +2.5/5.0
- 1% rule +2.4/10.0
- Rent growth +2.1/5.0
- DSCR +2.0/10.0
- Appreciation +0.0/10.0
$185,000
🖨 Deal sheet (PDF) 📄 Offer letter ✓ Due diligence
Listing remarks MLS
Tucked on a corner lot in the quiet community of Emhouse, this inviting 3 bedroom, 2 bathroom fully furnished double wide home offers comfort, convenience, and a place that instantly feels like home. With easy access to FM 1839, you’re just a short drive to Corsicana while still enjoying the slower pace of small-town living. Step inside to a welcoming layout where the living room flows effortlessly into the dining area and kitchen, creating the perfect space for gathering, relaxing, and making everyday memories. The home is being sold fully furnished, making the transition simple and allowing you to step right in and start enjoying the space from day one. A brand new AC unit provides added comfort and peace of mind. Whether you’re looking for a cozy place to settle into, a weekend getaway, or a property with immediate livability, this charming home offers warmth, convenience, and the kind of opportunity that’s worth seeing in person.
Key facts
- Welcoming layout
- Brand new ac unit
- Corner lot
Tags
Neighborhood map
What this means for you Summary
Snapshot
- This is a 3-bed/2.0-bath manufactured listed at $185k.
Deal economics
- At list price, monthly cash flow is $-193 ($-2k/yr) — negative.
- To cash-flow at today's rent, offer at most $157k (15.1% below list).
- To meet the 1% rule (rent ≥ 1% of price), the offer needs to be $137k (25.8% below list).
- Recommended offer: $137k (25.8% below list) — sets the bar for 1% rule.
Location & tenants
- Location reads 51/100 on livability (#1,481 in TX) — a working-class tenant base; expect higher turnover. Strengths: cost of living A+, crime A; Watch: employment D+, amenities F, commute F.
- Blooming Grove ISD (rural): math 39% / reading 43% proficiency, ranked #366 of 826 in TX (top 44%) — families likely to look elsewhere, expect single-tenant / working-renter base with shorter leases.
- Zoned schools: Blooming Grove El (math 27% / reading 37%, grade F, #2,268 of 4,322 statewide, top 55%, 428 students, 64% FRL); Blooming Grove Jh (math 44% / reading 45%, grade D, #491 of 1,662 statewide, top 31%, 225 students, 59% FRL); Blooming Grove H S (math 57% / reading 52%, grade C-, #379 of 1,632 statewide, top 26%, 267 students, 52% FRL).
- Market conditions: Rents soft (-1.5%/yr); 273 active listings in the ZIP; 522 units permitted in Navarro County in 2024 (0 in 5+ unit buildings).
Forward outlook
- Local home prices are declining (-3.0%/yr); year-one equity from $1k of loan paydown is wiped out by about $6k of value loss. Plan a longer hold.
- Navarro County population projected to shrink 4% by 2050 — rents likely to lag national; underwrite the cash flow, not the appreciation.
Negotiation context
- It's been on market 106 days — a 9% lower offer ($168k) is reasonable based on typical stale-listing flexibility.
Risks & watch-outs
- Climate carrying-cost: major wind risk, 60% chance of damaging wind over 30y; major wildfire risk; extreme-heat days projected 7→25/yr by 2055 (HVAC capex compounding) — expect insurance premiums to compound above CPI over the hold.
Questions for the listing agent
- What do current leases actually rent for vs. the listed asking? Can we see a recent rent roll and the last 12 months of T-12 income?
- It's been on market 106 days. Have you received any prior offers? Is the seller open to a 26% concession, seller financing, or rate buy-down credit?
- Why hasn't it sold? Are there any deal-killer items the seller is aware of (foundation, flood, title, zoning, code violations)?
- Is there a deadline driving the sale (1031 exchange, divorce, estate, relocation)? That informs how much negotiation room exists.
- Schools are F-rated, which usually means shorter tenancies and higher turnover. Who's the typical renter profile here, and what's been the actual vacancy rate?
- The area grade is low — what's the realistic commute time and amenity access for the typical tenant pool here? Any planned neighborhood developments (good or bad) we should know about?
- What's the average days-on-market for RENTAL listings here right now (not sales)? A rising rental-DOM trend means longer vacancies and softer asking-rent achievability than the comps imply.
- What's the recent tenant-quality profile in this submarket — average credit score on applications, eviction rate, late-payment / NSF rate, and stable-employment percentage? A property-management company in the area should have these aggregated.
- How much new for-sale + rental construction is in the pipeline within 1–3 miles? Heavy new supply typically softens prices + rents 12–24 months out; constrained supply supports both.
Investment metrics
- 1% rule
- 0.74% ✗
- Cap rate
- 5.04%
- Cash-on-cash
- -4.48%
- DSCR
- 0.80
- GRM
- 11.2
CMA / ARV
No comps found within radius.
Projected returns pro-forma
-3.0% appreciation · 0.0% rent growth · sell at horizon
- IRR
- -27.3%
- Equity multiple
- 0.11×
- Total profit
- $-46,297
- Equity at exit
- $27,584
- IRR
- -40.8%
- Equity multiple
- -0.38×
- Total profit
- $-71,644
- Equity at exit
- $15,995
Cash invested: $51,800 (down + closing). Projections, not guarantees.
Landlord ↔ Tenant lean methodology
- Overall (STATE)
- 87 Strongly Landlord-Friendly
- State Texas
- 87 Strongly Landlord-Friendly · R+5
- County
- — inherits STATE
- City
- — inherits STATE
ZIP-level market 75110
- Rents YoY
- -1.5%
- Active inventory
- 273
- Price-to-rent
- 11.2×
Monthly cashflow live
- Estimated rent
- $1,374 medium interval (Pro) →
- Mortgage (P&I)
- −$970
- Tax est. 1.5%
- −$231 /mo · $2,775/yr
- Insurance
- −$77
- HOA
- −$0
- Vacancy / Maint / Mgmt
- −$288
- Net cashflow
- $-193
Break-even live
Sensitivity live
| Price | -10% $-66 | -5% $-129 | +0% $-193 | +5% $-257 | +10% $-321 |
|---|---|---|---|---|---|
| Rent | -10% $-302 | -5% $-248 | +0% $-193 | +5% $-139 | +10% $-85 |
| Rate | -1.0pp $-100 | -0.5pp $-146 | base $-193 | +0.5pp $-241 | +1.0pp $-290 |
UW: 25.0% down · 7.5% · 30yr · 1.5% tax · 5.0% vac · 8.0% maint · 8.0% mgmt
Financing live
Cash to close
- Down payment
- $46,250
- Closing costs
- $5,550
- Reserves months
- —
- Total cash needed
- —
Loan-product check · same deal, 3 products live
Conventional
25% down · 7.5% · 30yr
- Down + closing
- —
- Monthly P&I
- —
- Monthly cashflow
- —
- DSCR
- —
- Eligible?
- —
Personal DTI + credit; lowest rate.
DSCR
20% down · 8.5% · 30yr
- Down + closing
- —
- Monthly P&I
- —
- Monthly cashflow
- —
- DSCR
- —
- Eligible?
- —
No personal income docs; deal must DSCR.
Hard money
10% down · 12.0% · 12mo
- Down + closing
- —
- Monthly P&I
- —
- Monthly cashflow
- —
- DSCR
- —
- Eligible?
- —
Short-term bridge; refi at stabilization.
Listing history 17 events
-
2026-06-21days on market $185,000 Active 106 DOM
-
2026-06-18days on market $185,000 Active 103 DOM
-
2026-06-17days on market $185,000 Active 102 DOM
-
2026-06-16days on market $185,000 Active 101 DOM
-
2026-06-15days on market $185,000 Active 100 DOM
-
2026-06-13days on market $185,000 Active 98 DOM
-
2026-06-13days on market $185,000 Active 97 DOM
-
2026-06-10price $185,000 Active 94 DOM
-
2026-06-09days on market $190,000 Active 94 DOM
-
2026-06-08days on market $190,000 Active 93 DOM
-
2026-06-07days on market $190,000 Active 92 DOM
-
2026-06-04days on market $190,000 Active 89 DOM
-
2026-06-03days on market $190,000 Active 88 DOM
-
2026-06-02days on market $190,000 Active 87 DOM
-
2026-06-01days on market $190,000 Active 86 DOM
-
2026-05-31days on market $190,000 Active 85 DOM
-
2026-03-03$190,000 Active 965-char remark
Show marketing remark (965 chars)
Tucked on a corner lot in the quiet community of Emhouse, this inviting 3 bedroom, 2 bathroom fully furnished double wide home offers comfort, convenience, and a place that instantly feels like home. With easy access to FM 1839, you’re just a short drive to Corsicana while still enjoying the slower pace of small-town living. Step inside to a welcoming layout where the living room flows effortlessly into the dining area and kitchen, creating the perfect space for gathering, relaxing, and making everyday memories. The home is being sold fully furnished, making the transition simple and allowing you to step right in and start enjoying the space from day one. A brand new AC unit provides added comfort and peace of mind. Whether you’re looking for a cozy place to settle into, a weekend getaway, or a property with immediate livability, this charming home offers warmth, convenience, and the kind of opportunity that’s worth seeing in person.
ⓘ Source: listings_history table (triggers on properties + properties_extension) + one-shot
backfill from property_details.listing_events for pre-trigger history.
Climate risk First Street
- Flood 1/10 Low FEMA zone X (unshaded) · 0% chance over 30 yrs
- Wildfire 7/10 Severe
- Heat 7/10 Severe 7 d/yr ≥110°F today · 25 d/yr by 30 yrs out
- Wind 6/10 Major 60% chance of damaging wind over 30 yrs
- Air quality 2/10 Low 0 unhealthy d/yr today · 1 by 30 yrs out
Nearby sold comps map
Loading sold comps map…
Walkable amenities ~0.75 mi
Loading nearby amenities…
Taxation est. · year 1
- Rental income
- $16,483
- − Mortgage interest
- −$10,363
- − Property taxes
- −$2,775
- − Insurance
- −$925
- − Repairs & maintenance
- −$1,319
- − Management
- −$1,319
- − Depreciation
- −$5,382
- Taxable loss
- −$5,599
- Est. tax savings @ 24.0%
- +$1,344
- After-tax cash flow
- $-976/yr
For passive investors: Depreciation is non-cash, so a rental often shows a tax loss while cash-flowing — sheltering income. Rental losses are passive: they offset passive income freely, and up to $25,000/yr can offset ordinary (W-2) income if you actively participate and your MAGI is under $100k (phasing out to $0 by $150k); unused losses carry forward. On sale, claimed depreciation is recaptured at up to 25%, and gains may owe capital-gains tax (a 1031 exchange can defer both). Figures are a year-1 estimate at your 24.0% rate — not tax advice; consult a CPA.
Schools (NCES district)
- District
- Blooming Grove ISD
- NCES district ID
- 4810470
- Math proficiency
- 39% ▬ 0.00%
- Reading proficiency
- 43% ▲ 6.00%
- Median HH income
- $48,446
- Composite
- 35.16/100
- National rank
- #5004
- State rank
- #366 of 826 in TX
Livability — Emhouse
- Score
- 51/100
- State rank
- #1481
- US rank
- #25398
Category grades
Schools grade is shown separately in the Schools card above.
Census & demographics
- Census place
- Emhouse, TX
- County
- Navarro County · 31,552 people
- Metro
- Corsicana, TX
- Population (ZIP)
- 31,552
- Household income
- $57,370
- Rent vs Own
- Severe rent burden
- 663.0
Population outlook (Navarro County) Hauer SSP2
- Today (2025)
- 48,397 people
- By 2030
- 48,096 · -0.6%
- By 2040
- 47,394 · -2.1%
- By 2050
- 46,541 · -3.8%
- By 2075
- 44,940 · -7.1%
- By 2100
- 42,288 · -12.6%
Race, ethnicity, and origin ACS 2023
- Neighborhood character
- Diverse neighborhood (Simpson 0.68)
- Race & ethnicity
- White 41% Hispanic / Latino 37% Two or more races 16% Black 13% Pacific Islander 2% Asian 1%
- Hispanic origin (detail)
- Mexican 34%
- Common ancestry
- Lithuanian 2% Slovak 1% Romanian 1%
- Foreign-born
- 17% · Canada
- Languages at home
- 68% English-only · Spanish 29% Other Asian/Pacific 2%
Political lean MEDSL · Navarro
- 2024 margin
- Solid R (+51.8) · D 23.7% · R 75.6%
- 2008→2024 swing
- -18.7pp toward R · 2008: -33.1pp · 2024: -51.8pp
- All cycles
- 2024: R+51.8 2020: R+45.5 2016: R+48.8 2012: R+42.4 2008: R+33.1
Not yet ingested
- Civics
- —
Market trends
- HPI YoY
- ▼ -248.01%
- Current HPI
- 224.5566
- Rent YoY
- ▼ -1.47%
- Metro
- Corsicana, TX
- State GDP YoY
- ▲ 3.95%
- F500 in state
- 110
Industry mix (Fortune 500 HQ in TX)
| Industry | F500 HQs | Revenue |
|---|---|---|
| Energy | 16 | $1,198B |
|
||
| Technology | 5 | $198B |
|
||
| Engineering / Construction | 4 | $72B |
|
||
| Energy Services | 3 | $60B |
|
||
| Utilities | 3 | $41B |
|
||
| Healthcare | 2 | $330B |
|
||
Price history
1 event — show timeline
- 2026-03-03 Listed $190,000 NTREIS
Property tax history
+20.6%/yrLatest (2018): $40 · +0.0% YoY. Source: county tax records.
Cash-flow waterfall
monthlySold comps — $/sqft
last 12 mo · ≤1 miLoading sold comps…