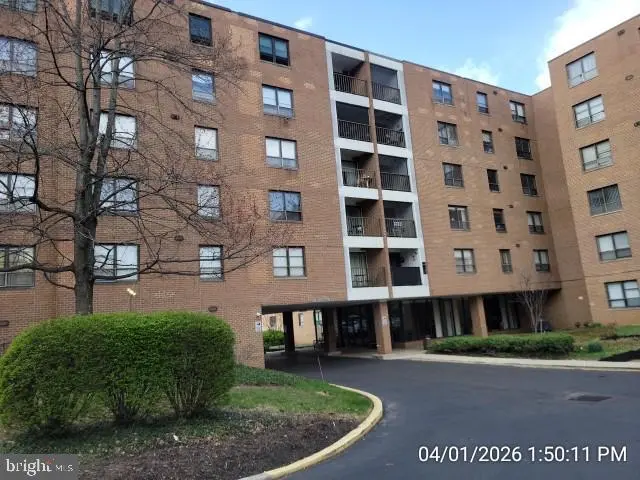
6317 Park Heights Ave #103 · Baltimore, MD
Flood risk 7/10 · Major
- FEMA flood zone
- X (unshaded)
- Chance of flooding over 30 yrs
- 0.96%
- Est. flood insurance / yr
- $473 – $860
Fire risk 1/10 · Minimal
- Est. fire insurance / yr
- $755 – $1,403
Heat risk 6/10 · Moderate
- Hot days now (above 103°F)
- 7 days/yr
- Hot days in 30 yrs
- 15 days/yr
Wind risk 5/10 · Moderate
- Chance of severe wind over 30 yrs
- 23.0%
Air-quality risk 3/10 · Minor
- Unhealthy air days now
- 2 days/yr
- Unhealthy air days in 30 yrs
- 4 days/yr
Risk factors via First Street. Map © Google.
Why this score? — see what drove the B- grade
The composite is a weighted blend of 9 inputs, each scored 0–100. Each bar is that input's sub-score; the figure is the points it added to the 100-point composite (weight × sub-score).
- Cash flow +30.0/30.0
- 1% rule +10.0/10.0
- DSCR +10.0/10.0
- ARV discount +7.5/15.0
- Livability +3.8/5.0
- Rent growth +3.1/5.0
- Condition / age +2.5/5.0
- Schools +1.0/10.0
- Appreciation +0.0/10.0
$75,000
🖨 Deal sheet 📄 Offer letter ✓ Due diligence
Listing remarks
HUD Case 241-827308. Equal Housing Opportunity. FHA financing is available with IE (Insured Escrow) with a repair escrow; HUD may contribute up to 3% of buyer’s closing cost. HUD property sold fully as-is. Please visit wwwHudhomestorecom for offer instructions, availability, property condition report. Information provided must be verified by all perspective purchasers. Buyer is responsible for utility activation and de-winterization at their expense. All transfer taxes to be paid by buyer. Discover a prime investment opportunity in the charming UPPER PARK HEIGHTS community rental or owner occupant! This spacious penthouse unit offers a blank canvas for your vision, perfect for those l
Key facts
- Essential amenities
- Brick construction
- $727 HOA
Tags
Neighborhood map
What this means for you Summary
Snapshot
- This is a 3-bed/2.0-bath condo listed at $75k.
Deal economics
- At list price, monthly cash flow is $479 ($6k/yr) — positive.
- The deal already cash-flows at list — no discount required.
- Meets the 1% rule at list price ($2k rent vs $75k).
- Recommended offer: $74k (1.5% below list) — sets the bar for market timing.
- Cap rate 14.9% vs local median 6.0% in Baltimore — top-decile yield for the area; either an underpriced asset or a hidden risk that comps aren't pricing in. Stress-test before assuming the spread holds.
Location & tenants
- Location reads 76/100 on livability (#90 in MD, #3,396 nationally) — a middle-class / working-renter tenant base. Strengths: amenities A+, commute A+, housing A+; Watch: schools D, crime F.
- Baltimore City Public Schools (urban): math 7% / reading 16% proficiency, ranked #24 of 24 in MD (top 100%) — low school quality limits family demand, transient renter base, plan for 1-2y turnover; 79% free/reduced lunch — lower-income household profile, screen leases tightly.
- Market conditions: Rents rising (+2.4%/yr); 351 active listings in the ZIP; 11 comparable units currently listed for rent nearby; rentals at typical pace (median 20d on market — plan ~3-4 weeks tenant-placement turnaround); 1,273 units permitted in Baltimore city in 2024 (1,104 in 5+ unit buildings).
- At $2,382/mo this rent would consume 55% of the median local household income ($52k/yr) (locally 3644% of renters already pay >50% of income on rent) — very limited rent-growth headroom before tenants either downsize or default.
Forward outlook
- Local home prices are declining (-3.0%/yr); year-one equity from $519 of loan paydown is wiped out by about $2k of value loss. Plan a longer hold.
- Baltimore County population projected to shrink 4% by 2050 — rents likely to lag national; underwrite the cash flow, not the appreciation.
- At projected returns (-3.0% appreciation + 2.4% rent growth), your $21k cash investment doubles in ~5 years — after that, you're playing with house money.
Negotiation context
- It's been on market 19 days — a 2% lower offer ($74k) is reasonable based on typical stale-listing flexibility.
- 3 sale attempts since 27y ago with the ask held roughly flat each time — persistent listings suggest the price (not the market) is what's stuck; bring a comps-based counter.
- Current owner paid $62k; 21% above their basis — modest negotiation headroom, anchor on the comps not their cost.
Risks & watch-outs
- Watch-outs: property tax is 3.1% of price; flood insurance adds $56/mo; HOA is 31% of rent.
- Climate carrying-cost: major flood risk; moderate wind risk, 23% chance of damaging wind over 30y; extreme-heat days projected 7→15/yr by 2055 (HVAC capex compounding) — expect insurance premiums to compound above CPI over the hold.
Questions for the listing agent
- Built in 1975 — when were the roof, HVAC, electrical panel, plumbing, and water heater last replaced?
- Property tax is high relative to price — has the assessment been appealed recently, and will the sale trigger a re-assessment?
- What's the actual annual flood-insurance premium (NFIP or private), and is the property in a SFHA with mandatory coverage?
- What does the HOA fee cover, when was the last increase, and are there any pending special assessments or reserve-fund shortfalls?
- Any open or pending special assessments — roof, HVAC, plumbing, elevator, façade? What's the per-unit balance and payoff schedule, and is the seller paying it off at close or rolling it to the buyer?
- Is there a deadline driving the sale (1031 exchange, divorce, estate, relocation)? That informs how much negotiation room exists.
- Schools are D-rated, which usually means shorter tenancies and higher turnover. Who's the typical renter profile here, and what's been the actual vacancy rate?
- Crime grade is F in this area — have there been break-ins, vandalism, or insurance claims at this property in the last 3 years? What carrier currently insures it and at what premium?
- What's the average days-on-market for RENTAL listings here right now (not sales)? A rising rental-DOM trend means longer vacancies and softer asking-rent achievability than the comps imply.
- What's the recent tenant-quality profile in this submarket — average credit score on applications, eviction rate, late-payment / NSF rate, and stable-employment percentage? A property-management company in the area should have these aggregated.
- How much new apartment / multifamily construction is in the pipeline within 1–3 miles? Heavy new supply (>2% of stock underway) typically softens rents 12–24 months out; light construction supports rent growth.
Investment metrics
- 1% rule
- 3.18% ✓
- Cap rate
- 14.85%
- Cash-on-cash
- 30.57%
- DSCR
- 2.36
- GRM
- 2.6
CMA / ARV
No comps found within radius.
Projected returns pro-forma
-3.0% appreciation · 2.41% rent growth · sell at horizon
- IRR
- 20.7%
- Equity multiple
- 1.84×
- Total profit
- $17,555
- Equity at exit
- $11,183
- IRR
- 28.4%
- Equity multiple
- 3.44×
- Total profit
- $51,258
- Equity at exit
- $6,485
Cash invested: $21,000 (down + closing). Projections, not guarantees.
Landlord ↔ Tenant lean methodology
- Overall (CITY)
- 12 Strongly Tenant-Friendly
- State Maryland
- 27 Tenant-Leaning · D+14
- County
- — inherits STATE
- City Baltimore
- 12 Strongly Tenant-Friendly · D+58
ZIP-level market 21215
- Rents YoY
- 2.4%
- Active inventory
- 351
- Price-to-rent
- 2.6×
Monthly cashflow live
- Estimated rent
- $2,382 high interval (Pro) →
- Mortgage (P&I)
- −$393
- Tax from tax record
- −$195 /mo · $2,342/yr
- Insurance
- −$31
- Flood insurance flood zone
- −$56 /mo · $666/yr
- HOA
- −$727
- Vacancy / Maint / Mgmt
- −$500
- Net cashflow
- $479
Break-even live
UW: 25.0% down · 7.5% · 30yr · 1.5% tax · 5.0% vac · 8.0% maint · 8.0% mgmt
Financing live
Cash to close
- Down payment
- $18,750
- Closing costs
- $2,250
- Reserves months
- —
- Total cash needed
- —
Loan-product check · same deal, 3 products live
Conventional
25% down · 7.5% · 30yr
- Down + closing
- —
- Monthly P&I
- —
- Monthly cashflow
- —
- DSCR
- —
- Eligible?
- —
Personal DTI + credit; lowest rate.
DSCR
20% down · 8.5% · 30yr
- Down + closing
- —
- Monthly P&I
- —
- Monthly cashflow
- —
- DSCR
- —
- Eligible?
- —
No personal income docs; deal must DSCR.
Hard money
10% down · 12.0% · 12mo
- Down + closing
- —
- Monthly P&I
- —
- Monthly cashflow
- —
- DSCR
- —
- Eligible?
- —
Short-term bridge; refi at stabilization.
Rent comps 11 comps
| Address | Beds | Baths | Sqft | Rent | $/sqft | DOM | Units | Dist |
|---|---|---|---|---|---|---|---|---|
| 3505 Clarks Ln Unit D2 Baltimore, MD | 3.0 | 2.0 | 1750 | $2,500 | $1.43 | 43d | 1 | 0.18mi |
| 3709 Fords Ln Baltimore, MD | 4.0 | 3.5 | 2248 | $3,200 | $1.42 | 20d | 1 | 0.24mi |
| 5807 Gist Ave Baltimore, MD | 2.0 | 1.5 | 2100 | $1,395 | $0.66 | 24d | 1 | 0.66mi |
| 3109 Northbrook Rd Pikesville, MD | 4.0 | 2.5 | 1957 | $3,200 | $1.64 | 10d | 1 | 0.85mi |
| 3700 Seven Mile Ln Pikesville, MD | 1.0–2.0 | 1.0–2.0 | 1063 | $1,723 | $1.62 | 1d | 13 | 0.87mi |
| 6609 Eberle Dr Baltimore, MD | 1.0–3.0 | 1.0–2.0 | 1011 | $1,787 | $1.77 | 1d | 25 | 0.89mi |
| 7307 Park Heights Ave Pikesville, MD | 2.0 | 2.0–2.5 | 1251 | $2,506 | $2.00 | 1d | 5 | 0.96mi |
| 6936 Blanche Rd Baltimore, MD | 3.0 | 1.5 | 1410 | $1,800 | $1.28 | 43d | 1 | 0.99mi |
| 7008 Deerfield Rd Pikesville, MD | 3.0 | 1.5 | 1664 | $2,300 | $1.38 | 43d | 1 | 1.15mi |
| 19 Warren Park Dr Pikesville, MD | 3.0 | 1.0–2.0 | 903 | $1,700 | $1.88 | 3d | 10 | 1.33mi |
| 6624 Chippewa Dr Baltimore, MD | 3.0 | 1.5 | 1514 | $2,400 | $1.59 | 24d | 1 | 1.37mi |
HOA detail condo
- Monthly dues
- $727 · $8,724/yr
- Assessments
- None detected in remarks — confirm with the listing agent.
Listing history 14 events
-
2026-04-30status Pending
-
2026-04-20historical
-
2026-04-01price $75,000
-
2026-04-01$75,000 Active
-
2026-04-01historical
-
2026-02-04price $91,530
-
2026-01-01price $101,700
-
2025-10-31$113,000 Active
-
1999-12-14soldstatus $62,000
-
1999-12-09soldstatus $62,000
-
1999-10-18historical
-
1999-06-02$67,500
-
1995-07-31soldstatus $52,000
-
1984-08-15soldstatus $93,700
ⓘ Source: listings_history table (triggers on properties + properties_extension) + one-shot
backfill from property_details.listing_events for pre-trigger history.
Tax reassessment forecast MD · Partial reset (capped growth)
- Current annual tax
- $2,342 · $195/mo
- Projected year-2 tax
- $2,342 · $195/mo
- Expected delta
- $0/yr ($0/mo · 0.0%)
ⓘ Screening estimate from a state-policy table — verify with the county assessor before closing.
Climate risk First Street
- Flood 7/10 Severe FEMA zone X (unshaded) · 96% chance over 30 yrs
- Wildfire 1/10 Low
- Heat 6/10 Major 7 d/yr ≥103°F today · 15 d/yr by 30 yrs out
- Wind 5/10 Major 23% chance of damaging wind over 30 yrs
- Air quality 3/10 Moderate 2 unhealthy d/yr today · 4 by 30 yrs out
Nearby sold comps map
Loading sold comps map…
Walkable amenities ~0.75 mi
Loading nearby amenities…
Taxation est. · year 1
- Rental income
- $28,583
- − Mortgage interest
- −$4,201
- − Property taxes
- −$2,342
- − Insurance
- −$1,042
- − Repairs & maintenance
- −$2,287
- − Management
- −$2,287
- − HOA
- −$8,724
- − Depreciation
- −$2,182
- Taxable income
- $5,519
- Est. tax owed @ 24.0%
- −$1,325
- After-tax cash flow
- $4,429/yr
For passive investors: Depreciation is non-cash, so a rental often shows a tax loss while cash-flowing — sheltering income. Rental losses are passive: they offset passive income freely, and up to $25,000/yr can offset ordinary (W-2) income if you actively participate and your MAGI is under $100k (phasing out to $0 by $150k); unused losses carry forward. On sale, claimed depreciation is recaptured at up to 25%, and gains may owe capital-gains tax (a 1031 exchange can defer both). Figures are a year-1 estimate at your 24.0% rate — not tax advice; consult a CPA.
Schools (NCES district)
- District
- Baltimore City Public Schools
- NCES district ID
- 2400090
- Math proficiency
- 7% ▼ -9.00%
- Reading proficiency
- 16% ▼ -5.00%
- Median HH income
- $42,108
- Composite
- 10.08/100
- National rank
- #9805
- State rank
- #24 of 24 in MD
Livability — Baltimore
- Score
- 76/100
- State rank
- #90
- US rank
- #3396
Category grades
Schools grade is shown separately in the Schools card above.
Census & demographics
- Census place
- Baltimore, MD
- County
- Baltimore City · 558,601 people
- City population
- 588,727
- Metro
- Baltimore-Columbia-Towson, MD
- Population (ZIP)
- 52,229
- Household income
- $51,587
- Rent vs Own
- Severe rent burden
- 3644.0
Population outlook (Baltimore County) Hauer SSP2
- Today (2025)
- 624,249 people
- By 2030
- 621,541 · -0.4%
- By 2040
- 609,756 · -2.3%
- By 2050
- 597,249 · -4.3%
- By 2075
- 552,236 · -11.5%
- By 2100
- 513,934 · -17.7%
Race, ethnicity, and origin ACS 2023
- Neighborhood character
- Predominantly Black (73%)
- Race & ethnicity
- Black 73% White 17% Hispanic / Latino 5% Two or more races 4% Asian 1%
- Common ancestry
- Scotch-Irish 2% Romanian 2% Italian 1%
- Foreign-born
- 9% · Canada, South Korea
- Languages at home
- 91% English-only · Spanish 4% French/Haitian/Cajun 1% Other Indo-European 1%
Political lean MEDSL · Baltimore
- 2024 margin
- Solid D (+73.0) · D 85.2% · R 12.2% · Other 2.6%
- 2008→2024 swing
- -2.5pp toward R · 2008: 75.5pp · 2024: 73.0pp
- All cycles
- 2024: D+73.0 2020: D+76.6 2016: D+74.6 2012: D+76.4 2008: D+75.5
Not yet ingested
- Civics
- —
Market trends
- HPI YoY
- ▼ -318.58%
- Current HPI
- 291.4926
- Rent YoY
- ▲ 2.41%
- Metro
- Baltimore-Columbia-Towson, MD
- State GDP YoY
- ▲ 2.97%
- F500 in state
- 12
Industry mix (Fortune 500 HQ in MD)
| Industry | F500 HQs | Revenue |
|---|---|---|
| Aerospace / Defense | 1 | $71B |
|
||
| Utilities | 1 | $25B |
|
||
| Hotels | 1 | $24B |
|
||
| Consumer Goods | 1 | $7B |
|
||
| Real Estate | 1 | $6B |
|
||
| Chemicals | 1 | $2B |
|
||
Price history
-20.0% since first listed14 events — show timeline
- 2026-04-30 Pending — BRIGHT MLS
- 2026-04-20 Listing Removed — BRIGHT MLS
- 2026-04-01 Price Changed $75,000 BRIGHT MLS
- 2026-04-01 Listing Removed — BRIGHT MLS
- 2026-04-01 Listed $75,000 BRIGHT MLS
- 2026-02-04 Price Changed $91,530 BRIGHT MLS
- 2026-01-01 Price Changed $101,700 BRIGHT MLS
- 2025-10-31 Listed $113,000 BRIGHT MLS
- 1999-12-14 Sold (Public Records) $62,000 Public Records
- 1999-12-09 Sold (MLS) $62,000 MRIS
- 1999-10-18 Delisted — MRIS
- 1999-06-02 Listed $67,500 MRIS
- 1995-07-31 Sold (Public Records) $52,000 Public Records
- 1984-08-15 Sold (Public Records) $93,700 Public Records
Property tax history
-1.3%/yrLatest (2025): $2,342 · +51.1% YoY. Source: county tax records.
Cash-flow waterfall
monthlySold comps — $/sqft
last 12 mo · ≤1 miLoading sold comps…