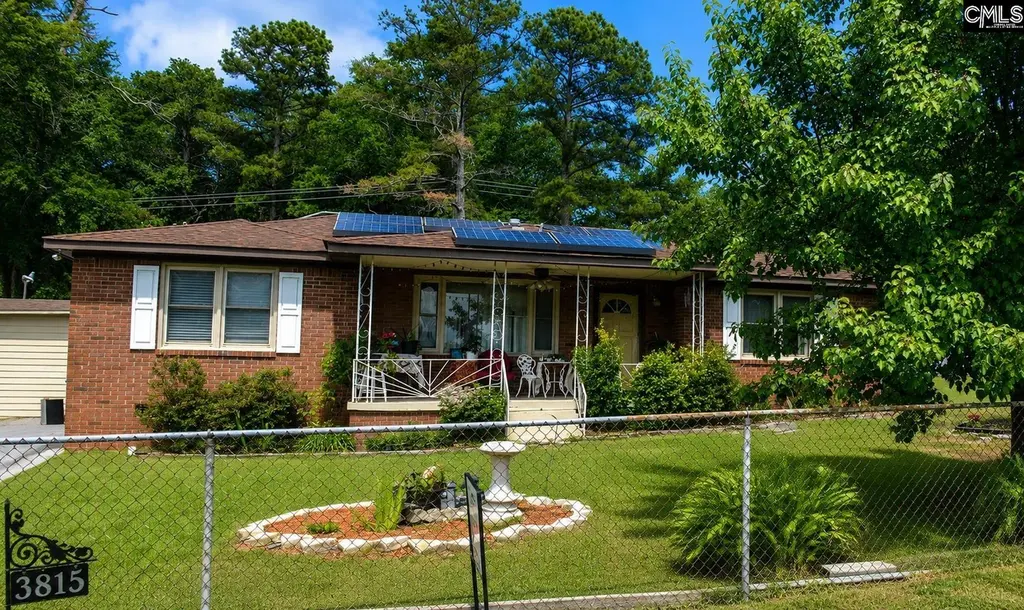
3815 Webb Ct · Columbia, SC
Flood risk 1/10 · Minimal
- FEMA flood zone
- X
- Chance of flooding over 30 yrs
- 0.0%
- Est. flood insurance / yr
- $435 – $905
Fire risk 1/10 · Minimal
- Est. fire insurance / yr
- $783 – $1,453
Heat risk 6/10 · Moderate
- Hot days now (above threshold)
- 7 days/yr
- Hot days in 30 yrs
- 16 days/yr
Wind risk No data
- Chance of severe wind over 30 yrs
- —
Air-quality risk No data
- Unhealthy air days now
- —
- Unhealthy air days in 30 yrs
- —
Risk factors via First Street. Map © Google.
Why this score? — see what drove the D+ grade
The composite is a weighted blend of 9 inputs, each scored 0–100. Each bar is that input's sub-score; the figure is the points it added to the 100-point composite (weight × sub-score).
- Cash flow +15.8/30.0
- ARV discount +7.5/15.0
- Appreciation +5.0/10.0
- DSCR +4.9/10.0
- Livability +3.9/5.0
- 1% rule +3.2/10.0
- Schools +2.6/10.0
- Rent growth +2.5/5.0
- Condition / age +2.5/5.0
$179,000
🖨 Deal sheet 📄 Offer letter ✓ Due diligence
Listing remarks
Welcome home to this well-maintained, all-brick 3-bedroom, 1-bath home located in an established community. This property offers ample parking and a fully chain-link fenced yard with two main entrances from Webb Ct and Cushman Dr, providing added convenience and accessibility. Enjoy the beautiful outdoor setting featuring fruit trees, walnut trees, mature shade trees, and attractive landscaping. The home is equipped with energy-efficient solar panels, which the seller is willing to absolve and transfer ownership with negotiations. Recent updates include a new roof, new HVAC system, new plumbing, energy-efficient thermopane windows, and new laminate flooring, offering comfort and peace of mi
Key facts
- New plumbing
- New roof
- New hvac system
Tags
Property features AI
Exterior
- Parking: Total of 8 parking spaces; 2 garage spaces; Attached carport at main level
- Utilities: Public water; Public sewer
- Home design: Single-story home
- Construction: Crawlspace foundation
- Exterior features: Brick exterior above foundation; Paved road access
Interior
- Kitchen: Kitchen on main level
- Bedrooms: Master bedroom on main level; Second bedroom on main level; Third bedroom on main level
- Bathrooms: One full bathroom
- Heating & cooling: Central heating; Central cooling
- Interior features: Great room on main level; Family room on main level; Dining room on main level; Other living spaces on main level
- Laundry & utility: Washer/Dryer on main level
Neighborhood map
What this means for you Summary
Snapshot
- This is a 3-bed/1.0-bath single-family listed at $179k.
Deal economics
- At list price, monthly cash flow is $81 ($975/yr) — positive.
- The deal already cash-flows at list — no discount required.
- To meet the 1% rule (rent ≥ 1% of price), the offer needs to be $146k (18.3% below list).
- Recommended offer: $146k (18.3% below list) — sets the bar for 1% rule.
Location & tenants
- Location reads 78/100 on livability (#18 in SC, #2,436 nationally) — a middle-class / working-renter tenant base. Strengths: amenities A+, commute A+, cost of living A+; Watch: employment D, crime F.
- Richland 01 (urban): math 26% / reading 36% proficiency, ranked #54 of 80 in SC (top 68%) — families likely to look elsewhere, expect single-tenant / working-renter base with shorter leases; 64% free/reduced lunch — lower-income household profile, screen leases tightly.
- Zoned schools: Burton Pack Elementary (math 17% / reading 17%, grade F, #515 of 597 statewide, top 89%, 388 students, 100% FRL); W.J. Keenan High (math 54% / reading 77%, grade B, #83 of 196 statewide, top 43%, 725 students, 100% FRL) — zoned schools average 100% FRL vs 64% district-wide (36 pts higher); higher-poverty schools than district average — tighter screening recommended.
- Market conditions: 1 active listings in the ZIP; 17 comparable units currently listed for rent nearby; rentals at typical pace (median 23d on market — plan ~3-4 weeks tenant-placement turnaround); 3,472 units permitted in Richland County in 2024 (1,096 in 5+ unit buildings).
Forward outlook
- In year one you build about $7k of equity ($1k loan paydown + $5k appreciation (3.0% local appreciation)).
- Richland County population projected at +30% by 2050 — long-run rental-demand tailwind backs the buy-and-hold thesis.
- At projected returns (3.0% appreciation + 3.0% rent growth), your $50k cash investment doubles in ~6 years — after that, you're playing with house money.
- By year 6, paydown + projected appreciation supports a ~$35k cash-out refi (75% LTV) — recoverable capital for the next deal without selling this one.
Negotiation context
- It's been on market 32 days — a 3% lower offer ($174k) is reasonable based on typical stale-listing flexibility.
- 3 sale attempts since 7y ago; this cycle's ask has dropped $21k (10%) from the opening price — seller is motivated, your offer sets the floor, not the list.
- Current owner paid $89k; list at $179k implies a 101% gain — meaningful room to come down on a strong offer.
Risks & watch-outs
- Watch-outs: built in 1956 — expect roof / HVAC / electrical / plumbing capex.
- Climate carrying-cost: extreme-heat days projected 7→16/yr by 2055 (HVAC capex compounding) — expect insurance premiums to compound above CPI over the hold.
Questions for the listing agent
- It's been on market 32 days. Have you received any prior offers? Is the seller open to a 18% concession, seller financing, or rate buy-down credit?
- Built in 1956 — when were the roof, HVAC, electrical panel, plumbing, and water heater last replaced?
- Is there a deadline driving the sale (1031 exchange, divorce, estate, relocation)? That informs how much negotiation room exists.
- Schools are D-rated, which usually means shorter tenancies and higher turnover. Who's the typical renter profile here, and what's been the actual vacancy rate?
- Crime grade is F in this area — have there been break-ins, vandalism, or insurance claims at this property in the last 3 years? What carrier currently insures it and at what premium?
- The area grade is low — what's the realistic commute time and amenity access for the typical tenant pool here? Any planned neighborhood developments (good or bad) we should know about?
- What's the average days-on-market for RENTAL listings here right now (not sales)? A rising rental-DOM trend means longer vacancies and softer asking-rent achievability than the comps imply.
- What's the recent tenant-quality profile in this submarket — average credit score on applications, eviction rate, late-payment / NSF rate, and stable-employment percentage? A property-management company in the area should have these aggregated.
- How much new for-sale + rental construction is in the pipeline within 1–3 miles? Heavy new supply typically softens prices + rents 12–24 months out; constrained supply supports both.
Investment metrics
- 1% rule
- 0.82% ✗
- Cap rate
- 6.84%
- Cash-on-cash
- 1.95%
- DSCR
- 1.09
- GRM
- 10.2
CMA / ARV
No comps found within radius.
Projected returns pro-forma
3.0% appreciation · 3.0% rent growth · sell at horizon
- IRR
- 9.3%
- Equity multiple
- 1.53×
- Total profit
- $26,660
- Equity at exit
- $80,486
- IRR
- 11.7%
- Equity multiple
- 2.75×
- Total profit
- $87,576
- Equity at exit
- $124,039
Cash invested: $50,120 (down + closing). Projections, not guarantees.
Landlord ↔ Tenant lean methodology
- Overall (STATE)
- 90 Strongly Landlord-Friendly
- State South Carolina
- 90 Strongly Landlord-Friendly · R+6
- County
- — inherits STATE
- City
- — inherits STATE
ZIP-level market 29204-0000
- Active inventory
- 1
- Price-to-rent
- 10.2×
Monthly cashflow live
- Estimated rent
- $1,463 high interval (Pro) →
- Mortgage (P&I)
- −$939
- Tax from tax record
- −$61 /mo · $733/yr
- Insurance
- −$75
- HOA
- −$0
- Vacancy / Maint / Mgmt
- −$307
- Net cashflow
- $81
Break-even live
UW: 25.0% down · 7.5% · 30yr · 1.5% tax · 5.0% vac · 8.0% maint · 8.0% mgmt
Financing live
Cash to close
- Down payment
- $44,750
- Closing costs
- $5,370
- Reserves months
- —
- Total cash needed
- —
Loan-product check · same deal, 3 products live
Conventional
25% down · 7.5% · 30yr
- Down + closing
- —
- Monthly P&I
- —
- Monthly cashflow
- —
- DSCR
- —
- Eligible?
- —
Personal DTI + credit; lowest rate.
DSCR
20% down · 8.5% · 30yr
- Down + closing
- —
- Monthly P&I
- —
- Monthly cashflow
- —
- DSCR
- —
- Eligible?
- —
No personal income docs; deal must DSCR.
Hard money
10% down · 12.0% · 12mo
- Down + closing
- —
- Monthly P&I
- —
- Monthly cashflow
- —
- DSCR
- —
- Eligible?
- —
Short-term bridge; refi at stabilization.
Rent comps 17 comps
| Address | Beds | Baths | Sqft | Rent | $/sqft | DOM | Units | Dist |
|---|---|---|---|---|---|---|---|---|
| 1931 Chaney St Columbia, SC | 2.0 | 1.0 | 1034 | $1,600 | $1.55 | 23d | 1 | 0.21mi |
| 3145 Bronx Rd Columbia, SC | 3.0 | 1.5 | 1207 | $1,511 | $1.25 | 23d | 1 | 0.56mi |
| 1115 Carter St Columbia, SC | 1.0–2.0 | 1.0 | 854 | $1,405 | $1.65 | 23d | 1 | 0.57mi |
| 5779 Ames Rd Columbia, SC | 2.0 | 1.0 | 895 | $1,000 | $1.12 | 14d | 1 | 0.67mi |
| 5779 Ames Rd Unit 13B Columbia, SC | 2.0 | 1.0 | 895 | $1,000 | $1.12 | 11d | 1 | 0.67mi |
| 3015 English Ave Columbia, SC | 2.0 | 1.0 | 981 | $1,250 | $1.27 | 11d | 1 | 0.77mi |
| 2928 English Ave Unit NA Columbia, SC | 3.0 | 1.0 | 1320 | $1,590 | $1.20 | 11d | 1 | 0.89mi |
| 209 Christian St Columbia, SC | 3.0 | 3.0 | 1585 | $800 | $0.50 | 23d | 1 | 1.05mi |
| 5437 Ransom Dr Columbia, SC | 3.0 | 1.0 | 1056 | $1,531 | $1.45 | 23d | 1 | 1.06mi |
| 1063 Prescott Rd Columbia, SC | 2.0 | 1.5 | 1210 | $1,200 | $0.99 | 14d | 1 | 1.10mi |
| 3117 Quitman St Columbia, SC | 3.0 | 2.0 | 1500 | $1,750 | $1.17 | 23d | 1 | 1.18mi |
| 320 Charwood Dr Columbia, SC | 3.0 | 2.0 | 1325 | $1,750 | $1.32 | 23d | 1 | 1.25mi |
| 6604 Cartwright Dr Columbia, SC | 3.0 | 2.0 | 1648 | $1,650 | $1.00 | 2d | 1 | 1.29mi |
| 27 Bethune Ct Columbia, SC | 3.0 | 2.0 | 1523 | $1,625 | $1.07 | 23d | 1 | 1.37mi |
| 4443 Bethel Church Rd #27 Columbia, SC | 3.0 | 2.5 | 1660 | $1,645 | $0.99 | 23d | 1 | 1.38mi |
| 3431 Covenant Rd Columbia, SC | 1.0–3.0 | 1.0–1.5 | 950 | $1,100 | $1.16 | 23d | 1 | 1.42mi |
| 201 Redwood Ct Columbia, SC | 3.0 | 1.5 | 1050 | $1,300 | $1.24 | 14d | 1 | 1.44mi |
Listing history 19 events
-
2026-06-18days on market $179,000 Active 32 DOM
-
2026-06-17days on market $179,000 Active 31 DOM
-
2026-06-16days on market $179,000 Active 30 DOM
-
2026-06-15pricedays on market $179,000 Active 29 DOM
-
2026-06-14days on market $190,000 Active 27 DOM
-
2026-06-10days on market $190,000 Active 24 DOM
-
2026-06-09days on market $190,000 Active 23 DOM
-
2026-06-08days on market $190,000 Active 22 DOM
-
2026-06-07days on market $190,000 Active 21 DOM
-
2026-06-03days on market $190,000 Active 17 DOM
-
2026-06-03days on market $190,000 Active 16 DOM
-
2026-06-01days on market $190,000 Active 15 DOM
-
2026-05-31days on market $190,000 Active 14 DOM
-
2026-05-17$200,000 Active
-
2019-08-30soldstatus $89,000
-
2019-08-06historical
-
2019-06-14status Active
-
2019-06-13historical
-
2019-06-13$107,000 Active
ⓘ Source: listings_history table (triggers on properties + properties_extension) + one-shot
backfill from property_details.listing_events for pre-trigger history.
Tax reassessment forecast SC · Resets to sale price
- Current annual tax
- $733 · $61/mo
- Projected year-2 tax
- $1,020 · $85/mo
- Expected delta
- +$287/yr (+$24/mo · 39.2%)
ⓘ Screening estimate from a state-policy table — verify with the county assessor before closing.
Climate risk First Street
- Flood 1/10 Low FEMA zone X · 0% chance over 30 yrs
- Wildfire 1/10 Low
- Heat 6/10 Major
Nearby sold comps map
Loading sold comps map…
Walkable amenities ~0.75 mi
Loading nearby amenities…
Taxation est. · year 1
- Rental income
- $17,554
- − Mortgage interest
- −$10,027
- − Property taxes
- −$733
- − Insurance
- −$895
- − Repairs & maintenance
- −$1,404
- − Management
- −$1,404
- − Depreciation
- −$5,207
- Taxable loss
- −$2,117
- Est. tax savings @ 24.0%
- +$508
- After-tax cash flow
- $1,483/yr
For passive investors: Depreciation is non-cash, so a rental often shows a tax loss while cash-flowing — sheltering income. Rental losses are passive: they offset passive income freely, and up to $25,000/yr can offset ordinary (W-2) income if you actively participate and your MAGI is under $100k (phasing out to $0 by $150k); unused losses carry forward. On sale, claimed depreciation is recaptured at up to 25%, and gains may owe capital-gains tax (a 1031 exchange can defer both). Figures are a year-1 estimate at your 24.0% rate — not tax advice; consult a CPA.
Schools (NCES district)
- District
- Richland 01
- NCES district ID
- 4503360
- Math proficiency
- 26% ▼ -7.00%
- Reading proficiency
- 36% ▼ -5.00%
- Median HH income
- $38,931
- Composite
- 25.94/100
- National rank
- #7335
- State rank
- #54 of 80 in SC
Livability — Columbia
- Score
- 78/100
- State rank
- #18
- US rank
- #2436
Category grades
Schools grade is shown separately in the Schools card above.
Census & demographics
- Census place
- Columbia, SC
Population outlook (Richland County) Hauer SSP2
- Today (2025)
- 459,667 people
- By 2030
- 487,524 · +6.1%
- By 2040
- 542,035 · +17.9%
- By 2050
- 595,371 · +29.5%
- By 2075
- 732,998 · +59.5%
- By 2100
- 820,415 · +78.5%
Not yet ingested
- Political lean
- —
- Race & ethnicity
- —
- Common origin
- —
- Civics
- —
Market trends
- HPI YoY
- —
- Current HPI
- —
- Rent YoY
- —
- Metro
- —
- State GDP YoY
- ▲ 4.51%
- F500 in state
- 2
Industry mix (Fortune 500 HQ in SC)
| Industry | F500 HQs | Revenue |
|---|---|---|
| Packaging | 1 | $7B |
|
||
Price history
+86.9% since first listed6 events — show timeline
- 2026-05-17 Listed $200,000 Consolidated MLS
- 2019-08-30 Sold (Public Records) $89,000 Public Records
- 2019-08-06 Delisted — Consolidated MLS
- 2019-06-14 Relisted — Consolidated MLS
- 2019-06-13 Delisted — Consolidated MLS
- 2019-06-13 Listed $107,000 Consolidated MLS
Property tax history
+7.8%/yrLatest (2025): $733 · +3.7% YoY. Source: county tax records.
Cash-flow waterfall
monthlySold comps — $/sqft
last 12 mo · ≤1 miLoading sold comps…