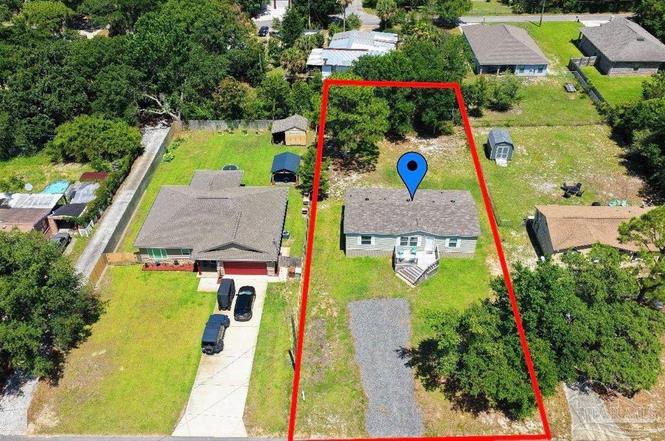
1860 Abercrombie Rd · Midway, FL
Flood risk 1/10 · Minimal
- FEMA flood zone
- X (unshaded)
- Chance of flooding over 30 yrs
- 0.0%
- Est. flood insurance / yr
- $507 – $1,088
Fire risk 3/10 · Minor
- Est. fire insurance / yr
- $947 – $1,759
Heat risk 10/10 · Severe
- Hot days now (above 105°F)
- 7 days/yr
- Hot days in 30 yrs
- 23 days/yr
Wind risk 9/10 · Severe
- Chance of severe wind over 30 yrs
- 99.0%
Air-quality risk 2/10 · Minimal
- Unhealthy air days now
- 1 days/yr
- Unhealthy air days in 30 yrs
- 1 days/yr
Risk factors via First Street. Map © Google.
Why this score? — see what drove the F grade
The composite is a weighted blend of 9 inputs, each scored 0–100. Each bar is that input's sub-score; the figure is the points it added to the 100-point composite (weight × sub-score).
- Cash flow +12.1/30.0
- Schools +5.3/10.0
- Rent growth +3.7/5.0
- DSCR +3.6/10.0
- 1% rule +2.7/10.0
- Livability +2.5/5.0
- Condition / age +2.5/5.0
- ARV discount +0.0/15.0
- Appreciation +0.0/10.0
$285,000
🖨 Deal sheet (PDF) 📄 Offer letter ✓ Due diligence
Listing remarks MLS
Key Features: Bedrooms/Bathrooms: 3 spacious bedrooms and 2 full bathrooms. MOVE-IN READY! Furniture negotiable! Layout: Functional single-story split floor plan. Condition: Modern 2024 construction, meticulously maintained, and an open floor plan. Outdoor Space: Generous quarter-acre lot with plenty of room for outdoor activities or future personalization. Location Highlights: Situated in the desirable Gulf Breeze area with convenient access to US-98, local schools, shopping, and nearby coastal amenities. Near beaches!! No HOA! Surrounded by beautiful homes! This would make an excellent short-term investment property.
Key facts
- 0.26 acre lot
- Built 2024
- Listed 9 days
Neighborhood map
What this means for you Summary
Snapshot
- This is a 3-bed/2.0-bath manufactured listed at $285k.
Deal economics
- At list price, monthly cash flow is $-62 ($-740/yr) — negative.
- To cash-flow at today's rent, offer at most $274k (3.8% below list).
- To meet the 1% rule (rent ≥ 1% of price), the offer needs to be $219k (23.2% below list).
- Recommended offer: $219k (23.2% below list) — sets the bar for 1% rule.
- Cap rate 6.0% vs local median 4.1% in Midway — top-decile yield for the area; either an underpriced asset or a hidden risk that comps aren't pricing in. Stress-test before assuming the spread holds.
Location & tenants
- Location reads: area grade F — affects rentability + tenant quality, not the cash-flow math above.
- Santa Rosa (suburban): math 63% / reading 60% proficiency, ranked #8 of 73 in FL (top 11%) — acceptable for families but not a draw, mixed tenant base, ~2y average lease.
- Zoned schools: West Navarre Intermediate School (math 70% / reading 70%, grade A-, #345 of 2,144 statewide, top 17%, 813 students, 37% FRL); Woodlawn Beach Middle School (math 68% / reading 60%, grade B+, #105 of 571 statewide, top 19%, 948 students, 34% FRL); Gulf Breeze High School (math 67% / reading 69%, grade B, #66 of 667 statewide, top 10%, 1,978 students, 21% FRL).
- Market conditions: Rents rising fast (+4.6%/yr); 455 active listings in the ZIP; 12 comparable units currently listed for rent nearby; rentals at typical pace (median 23d on market — plan ~3-4 weeks tenant-placement turnaround); solid renter incomes; 1,983 units permitted in Santa Rosa County in 2024 (128 in 5+ unit buildings).
Forward outlook
- Local home prices are declining (-3.0%/yr); year-one equity from $2k of loan paydown is wiped out by about $9k of value loss. Plan a longer hold.
- Santa Rosa County population projected at +31% by 2050 — long-run rental-demand tailwind backs the buy-and-hold thesis.
Negotiation context
- Only 9 days on market — expect competitive offers; lowballing is unlikely to land.
- 3 sale attempts with the ask held roughly flat each time — persistent listings suggest the price (not the market) is what's stuck; bring a comps-based counter.
- Current owner paid $45k; list at $285k implies a 533% gain — meaningful room to come down on a strong offer.
Risks & watch-outs
- Climate carrying-cost: severe wind risk, 99% chance of damaging wind over 30y; extreme-heat days projected 7→23/yr by 2055 (HVAC capex compounding) — expect insurance premiums to compound above CPI over the hold.
Questions for the listing agent
- What do current leases actually rent for vs. the listed asking? Can we see a recent rent roll and the last 12 months of T-12 income?
- Is there a deadline driving the sale (1031 exchange, divorce, estate, relocation)? That informs how much negotiation room exists.
- The area grade is low — what's the realistic commute time and amenity access for the typical tenant pool here? Any planned neighborhood developments (good or bad) we should know about?
- What's the average days-on-market for RENTAL listings here right now (not sales)? A rising rental-DOM trend means longer vacancies and softer asking-rent achievability than the comps imply.
- What's the recent tenant-quality profile in this submarket — average credit score on applications, eviction rate, late-payment / NSF rate, and stable-employment percentage? A property-management company in the area should have these aggregated.
- How much new for-sale + rental construction is in the pipeline within 1–3 miles? Heavy new supply typically softens prices + rents 12–24 months out; constrained supply supports both.
Investment metrics
- 1% rule
- 0.77% ✗
- Cap rate
- 6.03%
- Cash-on-cash
- -0.93%
- DSCR
- 0.96
- GRM
- 10.9
CMA / ARV
- ARV (on-the-fly)
- $190,848
- Comps found
- 4
Show comp detail 4 sales within ~0.75 mi
| Address | Dist | Beds/Ba | Sqft | Sold | Price | $/sf | Match |
|---|---|---|---|---|---|---|---|
| 1761 Kell Rd | 0.42mi | 3/2.0 | 1,248 (-7%) | 7mo | $175,000 | $140 | 62 |
| 1803 El Paso Trl | 0.42mi | 3/2.0 | 1,470 (+9%) | 13mo | $220,000 | $150 | 54 |
| 5437 Maverick Ln | 0.41mi | 3/2.0 | 1,196 (-11%) | 16mo | $98,010 | $82 | 49 |
| 5503 Stage Coach Trl | 0.44mi | 2/2.0 (-1) | 1,232 (-8%) | 17mo | $175,000 | $142 | 46 |
Match score weights: distance 35% · size 25% · config 20% · recency 20%. Top-matched comps best support the ARV.
Projected returns pro-forma
-3.0% appreciation · 4.6% rent growth · sell at horizon
- IRR
- -16.2%
- Equity multiple
- 0.42×
- Total profit
- $-46,608
- Equity at exit
- $42,494
- IRR
- -5.6%
- Equity multiple
- 0.61×
- Total profit
- $-30,782
- Equity at exit
- $24,642
Cash invested: $79,800 (down + closing). Projections, not guarantees.
Landlord ↔ Tenant lean methodology
- Overall (STATE)
- 87 Strongly Landlord-Friendly
- State Florida
- 87 Strongly Landlord-Friendly · R+3
- County
- — inherits STATE
- City
- — inherits STATE
ZIP-level market 32563
- Rents YoY
- 4.6%
- Active inventory
- 455
- Price-to-rent
- 10.9×
Monthly cashflow live
- Estimated rent
- $2,188 high interval (Pro) →
- Mortgage (P&I)
- −$1,495
- Tax from tax record
- −$177 /mo · $2,126/yr
- Insurance
- −$119
- HOA
- −$0
- Vacancy / Maint / Mgmt
- −$460
- Net cashflow
- $-62
Break-even live
Sensitivity live
| Price | -10% $100 | -5% $19 | +0% $-62 | +5% $-142 | +10% $-223 |
|---|---|---|---|---|---|
| Rent | -10% $-235 | -5% $-148 | +0% $-62 | +5% $25 | +10% $111 |
| Rate | -1.0pp $82 | -0.5pp $11 | base $-62 | +0.5pp $-136 | +1.0pp $-211 |
UW: 25.0% down · 7.5% · 30yr · 1.5% tax · 5.0% vac · 8.0% maint · 8.0% mgmt
Financing live
Cash to close
- Down payment
- $71,250
- Closing costs
- $8,550
- Reserves months
- —
- Total cash needed
- —
Loan-product check · same deal, 3 products live
Conventional
25% down · 7.5% · 30yr
- Down + closing
- —
- Monthly P&I
- —
- Monthly cashflow
- —
- DSCR
- —
- Eligible?
- —
Personal DTI + credit; lowest rate.
DSCR
20% down · 8.5% · 30yr
- Down + closing
- —
- Monthly P&I
- —
- Monthly cashflow
- —
- DSCR
- —
- Eligible?
- —
No personal income docs; deal must DSCR.
Hard money
10% down · 12.0% · 12mo
- Down + closing
- —
- Monthly P&I
- —
- Monthly cashflow
- —
- DSCR
- —
- Eligible?
- —
Short-term bridge; refi at stabilization.
Rent comps 12 comps
| Address | Beds | Baths | Sqft | Rent | $/sqft | DOM | Units | Dist |
|---|---|---|---|---|---|---|---|---|
| 5359 Maverick Ln Gulf Breeze, FL | 3.0 | 2.0 | 1350 | $2,200 | $1.63 | 15d | 1 | 0.22mi |
| 1786 Kell Rd Gulf Breeze, FL | 3.0 | 2.0 | 1342 | $1,750 | $1.30 | 15d | 1 | 0.37mi |
| 1712 Bay Pine Cir Gulf Breeze, FL | 4.0 | 2.0 | 1783 | $2,150 | $1.21 | 25d | 1 | 0.44mi |
| 1643 Amarillo Trl Gulf Breeze, FL | 3.0 | 2.0 | 1462 | $1,995 | $1.36 | 25d | 1 | 0.58mi |
| 1651 Ponderosa Dr Gulf Breeze, FL | 3.0 | 2.0 | 1605 | $2,450 | $1.53 | 23d | 1 | 0.75mi |
| 1651 Ponderosa Dr Gulf Breeze, FL | 3.0 | 2.0 | 1605 | $2,450 | $1.53 | 15d | 1 | 0.75mi |
| 1889 Natures Way Gulf Breeze, FL | 3.0 | 2.0 | 1699 | $2,850 | $1.68 | 25d | 1 | 0.80mi |
| 5673 Stellarjay St Gulf Breeze, FL | 3.0 | 2.5 | 1537 | $1,950 | $1.27 | 23d | 1 | 0.84mi |
| 5723 Sandy Walk St Gulf Breeze, FL | 3.0 | 2.5 | 1537 | $1,890 | $1.23 | 25d | 1 | 0.87mi |
| 5723 Sandy Walk St Gulf Breeze, FL | 3.0 | 2.5 | 1537 | $1,890 | $1.23 | 15d | 1 | 0.87mi |
| 5410 Spruce St Gulf Breeze, FL | 3.0 | 2.0 | 1653 | $2,000 | $1.21 | 25d | 1 | 1.02mi |
| 5410 Spruce St Gulf Breeze, FL | 3.0 | 2.0 | 1653 | $2,000 | $1.21 | 15d | 1 | 1.02mi |
Listing history 7 events
-
2026-06-22days on market $285,000 Active 9 DOM
-
2026-06-18days on market $285,000 Active 6 DOM
-
2026-06-17days on market $285,000 Active 5 DOM
-
2026-06-16days on market $285,000 Active 4 DOM
-
2026-06-15days on market $285,000 Active 3 DOM
-
2026-06-13remarks 627-char remark
-
2026-06-13$285,000 Active 1 DOM
ⓘ Source: listings_history table (triggers on properties + properties_extension) + one-shot
backfill from property_details.listing_events for pre-trigger history.
Tax reassessment forecast FL · Resets to sale price
- Current annual tax
- $2,126 · $177/mo
- Projected year-2 tax
- $2,366 · $197/mo
- Expected delta
- +$239/yr (+$20/mo · 11.3%)
ⓘ Screening estimate from a state-policy table — verify with the county assessor before closing.
Climate risk First Street
- Flood 1/10 Low FEMA zone X (unshaded) · 0% chance over 30 yrs
- Wildfire 3/10 Moderate
- Heat 10/10 Extreme 7 d/yr ≥105°F today · 23 d/yr by 30 yrs out
- Wind 9/10 Extreme 99% chance of damaging wind over 30 yrs
- Air quality 2/10 Low 1 unhealthy d/yr today · 1 by 30 yrs out
Nearby sold comps map
Loading sold comps map…
Walkable amenities ~0.75 mi
Loading nearby amenities…
Taxation est. · year 1
- Rental income
- $26,261
- − Mortgage interest
- −$15,964
- − Property taxes
- −$2,126
- − Insurance
- −$1,425
- − Repairs & maintenance
- −$2,101
- − Management
- −$2,101
- − Depreciation
- −$8,291
- Taxable loss
- −$5,748
- Est. tax savings @ 24.0%
- +$1,379
- After-tax cash flow
- $639/yr
For passive investors: Depreciation is non-cash, so a rental often shows a tax loss while cash-flowing — sheltering income. Rental losses are passive: they offset passive income freely, and up to $25,000/yr can offset ordinary (W-2) income if you actively participate and your MAGI is under $100k (phasing out to $0 by $150k); unused losses carry forward. On sale, claimed depreciation is recaptured at up to 25%, and gains may owe capital-gains tax (a 1031 exchange can defer both). Figures are a year-1 estimate at your 24.0% rate — not tax advice; consult a CPA.
Schools (NCES district)
- District
- Santa Rosa
- NCES district ID
- 1201650
- Math proficiency
- 63% ▼ -6.00%
- Reading proficiency
- 60% ▼ -5.00%
- Median HH income
- $58,161
- Composite
- 53.12/100
- National rank
- #1511
- State rank
- #8 of 73 in FL
Livability — Midway
No livability data for this city. (Only ~50 U.S. cities are tracked.)
Census & demographics
- Census place
- Midway, FL
- County
- Santa Rosa County · 194,764 people
- Metro
- Pensacola-Ferry Pass-Brent, FL
- Population (ZIP)
- 30,364
- Household income
- $100,396
- Rent vs Own
- Severe rent burden
- 397.0
Population outlook (Santa Rosa County) Hauer SSP2
- Today (2025)
- 195,978 people
- By 2030
- 209,782 · +7.0%
- By 2040
- 235,293 · +20.1%
- By 2050
- 256,408 · +30.8%
- By 2075
- 298,074 · +52.1%
- By 2100
- 303,216 · +54.7%
Race, ethnicity, and origin ACS 2023
- Neighborhood character
- Predominantly White (87%)
- Race & ethnicity
- White 87% Two or more races 6% Hispanic / Latino 6% Black 2% Asian 1%
- Hispanic origin (detail)
- Mexican 2%
- Common ancestry
- Italian 5% Slovak 3% Romanian 3%
- Foreign-born
- 4% · Canada
- Languages at home
- 94% English-only · Spanish 3% German/W. Germanic 1% Chinese 1%
Political lean MEDSL · Santa Rosa
- 2024 margin
- Solid R (+51.0) · D 24.1% · R 75.0%
- 2008→2024 swing
- -3.0pp toward R · 2008: -47.9pp · 2024: -51.0pp
- All cycles
- 2024: R+51.0 2020: R+46.5 2016: R+53.5 2012: R+52.6 2008: R+47.9
Not yet ingested
- Civics
- —
Market trends
- HPI YoY
- ▼ -229.78%
- Current HPI
- 278.9852
- Rent YoY
- ▲ 4.60%
- Metro
- Pensacola-Ferry Pass-Brent, FL
- State GDP YoY
- ▲ 3.28%
- F500 in state
- 36
Industry mix (Fortune 500 HQ in FL)
| Industry | F500 HQs | Revenue |
|---|---|---|
| Industrial Technology | 2 | $29B |
|
||
| Insurance | 2 | $17B |
|
||
| Retail | 1 | $60B |
|
||
| Technology Distribution | 1 | $58B |
|
||
| Homebuilding | 1 | $35B |
|
||
| Technology Manufacturing | 1 | $35B |
|
||
Price history
+533.3% since first listed7 events — show timeline
- 2026-06-12 Listed $285,000 PARMLS
- 2026-06-12 Listed $285,000 ECAR
- 2026-06-11 Coming Soon $285,000 PARMLS
- 2026-05-12 Listing Removed — PARMLS
- 2026-01-30 Price Changed $285,000 PARMLS
- 2025-11-17 Listed $299,500 PARMLS
- 2022-04-21 Sold (Public Records) $45,000 Public Records
Property tax history
+20.6%/yrLatest (2025): $2,126 · +245.6% YoY. Source: county tax records.
Cash-flow waterfall
monthlySold comps — $/sqft
last 12 mo · ≤1 miLoading sold comps…