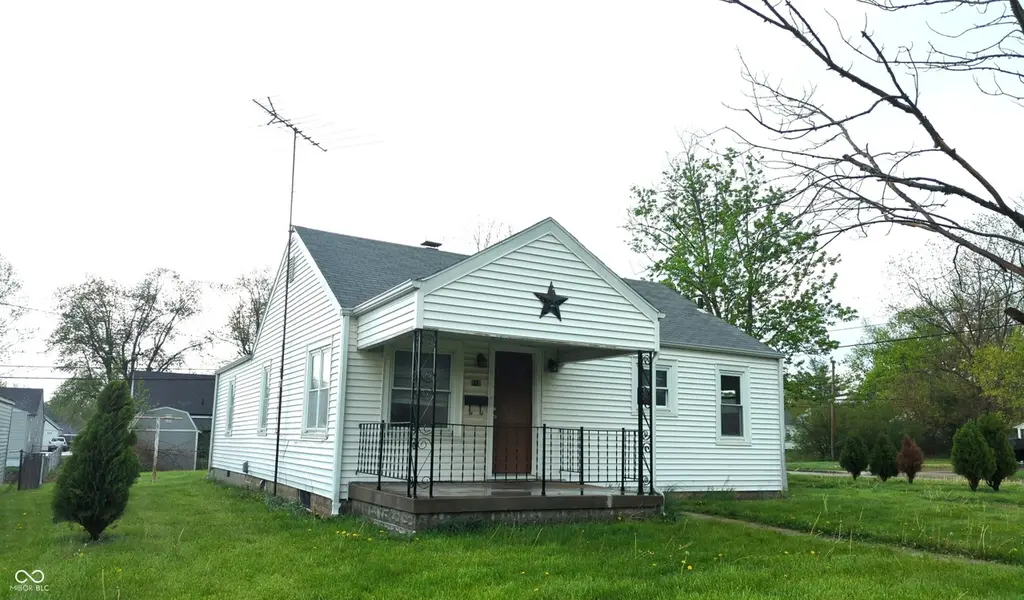
616 W 38th St · Anderson, IN
Flood risk 1/10 · Minimal
- FEMA flood zone
- X (unshaded)
- Chance of flooding over 30 yrs
- 0.0%
- Est. flood insurance / yr
- $473 – $860
Fire risk 1/10 · Minimal
- Est. fire insurance / yr
- $717 – $1,331
Heat risk 3/10 · Minor
- Hot days now (above 100°F)
- 7 days/yr
- Hot days in 30 yrs
- 18 days/yr
Wind risk 2/10 · Minimal
- Chance of severe wind over 30 yrs
- 0.0%
Air-quality risk 3/10 · Minor
- Unhealthy air days now
- 2 days/yr
- Unhealthy air days in 30 yrs
- 3 days/yr
Risk factors via First Street. Map © Google.
Why this score? — see what drove the C grade
The composite is a weighted blend of 9 inputs, each scored 0–100. Each bar is that input's sub-score; the figure is the points it added to the 100-point composite (weight × sub-score).
- Cash flow +19.7/30.0
- ARV discount +15.0/15.0
- DSCR +6.2/10.0
- 1% rule +5.4/10.0
- Livability +3.0/5.0
- Rent growth +2.5/5.0
- Condition / age +2.5/5.0
- Schools +1.6/10.0
- Appreciation +0.0/10.0
$104,900
🖨 Deal sheet 📄 Offer letter ✓ Due diligence
Listing remarks MLS
At 616 W 38th ST in ANDERSON, IN, USA, a single family residence awaits. This home features 3 bedrooms and 1 bathroom and full basement providing storage or more living area. The corner lot and large yard are great features as well as covered porch for sitting outside on quiet evenings. There is also a one car detached garage. Come and see this home as it will not last long! This is a great starter home or future rental for your portfolio.
Key facts
- Covered porch
- Large yard
- Full basement
Tags
Neighborhood map
What this means for you Summary
Snapshot
- This is a 3-bed/1.5-bath single-family listed at $105k.
Deal economics
- At list price, monthly cash flow is $123 ($1k/yr) — positive.
- The deal already cash-flows at list — no discount required.
- Meets the 1% rule at list price ($1k rent vs $105k).
- Recommended offer: $99k (6.0% below list) — sets the bar for market timing.
Location & tenants
- Location reads 60/100 on livability (#521 in IN) — a middle-class / working-renter tenant base. Strengths: cost of living A+, housing A+; Watch: schools F, crime D-, amenities F.
- Anderson Community School Corporation (urban): math 15% / reading 23% proficiency, ranked #280 of 301 in IN (top 93%) — low school quality limits family demand, transient renter base, plan for 1-2y turnover; 70% free/reduced lunch — lower-income household profile, screen leases tightly.
- Market conditions: 150 active listings in the ZIP; 23 comparable units currently listed for rent nearby; rentals at typical pace (median 24d on market — plan ~3-4 weeks tenant-placement turnaround); 43% of comp listings sitting > 30 days — soft ceiling on asking rent; 184 units permitted in Madison County in 2024 (0 in 5+ unit buildings).
Forward outlook
- Local home prices are declining (-3.0%/yr); year-one equity from $725 of loan paydown is wiped out by about $3k of value loss. Plan a longer hold.
- Madison County population projected at -14% by 2050 — secular population decline; favor cash flow + early exit over multi-decade hold.
Negotiation context
- It's been on market 61 days — a 6% lower offer ($99k) is reasonable based on typical stale-listing flexibility.
- 6 sale attempts since 8y ago; this cycle's ask has dropped $10k (9%) from the opening price — seller is motivated, your offer sets the floor, not the list.
- Current owner paid $73k; 44% above their basis — modest negotiation headroom, anchor on the comps not their cost.
Risks & watch-outs
- Watch-outs: built in 1946 — expect roof / HVAC / electrical / plumbing capex.
Questions for the listing agent
- It's been on market 61 days. Have you received any prior offers? Is the seller open to a 6% concession, seller financing, or rate buy-down credit?
- Built in 1946 — when were the roof, HVAC, electrical panel, plumbing, and water heater last replaced?
- Why hasn't it sold? Are there any deal-killer items the seller is aware of (foundation, flood, title, zoning, code violations)?
- Is there a deadline driving the sale (1031 exchange, divorce, estate, relocation)? That informs how much negotiation room exists.
- Schools are F-rated, which usually means shorter tenancies and higher turnover. Who's the typical renter profile here, and what's been the actual vacancy rate?
- Crime grade is D in this area — have there been break-ins, vandalism, or insurance claims at this property in the last 3 years? What carrier currently insures it and at what premium?
- What's the average days-on-market for RENTAL listings here right now (not sales)? A rising rental-DOM trend means longer vacancies and softer asking-rent achievability than the comps imply.
- What's the recent tenant-quality profile in this submarket — average credit score on applications, eviction rate, late-payment / NSF rate, and stable-employment percentage? A property-management company in the area should have these aggregated.
- How much new for-sale + rental construction is in the pipeline within 1–3 miles? Heavy new supply typically softens prices + rents 12–24 months out; constrained supply supports both.
Investment metrics
- 1% rule
- 1.04% ✓
- Cap rate
- 7.70%
- Cash-on-cash
- 5.01%
- DSCR
- 1.22
- GRM
- 8.0
CMA / ARV
- ARV (median comp)
- $155,445
- List price
- $104,900
- Delta
- -32.52%
- Verdict
- UNDERPRICED
- Comps
- 20 within 1.0 mi
Show comp detail 12 sales within ~0.75 mi
| Address | Dist | Beds/Ba | Sqft | Sold | Price | $/sf | Match |
|---|---|---|---|---|---|---|---|
| 4406 Delmar Ct | 0.40mi | 3/1.5 | 912 (-3%) | 2mo | $160,000 | $175 | 74 |
| 14 Crescent Ct | 0.13mi | 3/1.0 | 1,056 (+12%) | 2mo | $150,000 | $142 | 70 |
| 815 Delmar Rd | 0.45mi | 3/1.5 | 1,008 (+7%) | 1mo | $95,000 | $94 | 67 |
| 910 Lonsvale Dr | 0.27mi | 3/1.0 | 844 (-11%) | 2mo | $125,000 | $148 | 66 |
| 3808 Brown St | 0.28mi | 2/1.0 (-1) | 868 (-8%) | 1mo | $75,000 | $86 | 66 |
| 10 W 41st St | 0.60mi | 3/2.0 | 960 (+2%) | 5mo | $141,000 | $147 | 63 |
| 912 Crescent Dr | 0.09mi | 2/1.0 (-1) | 816 (-14%) | 5mo | $125,000 | $153 | 62 |
| 706 Lonsvale Dr | 0.26mi | 2/1.0 (-1) | 853 (-10%) | 6mo | $112,000 | $131 | 60 |
| 616 Lonsvale Dr | 0.27mi | 3/1.0 | 825 (-13%) | 8mo | $150,000 | $182 | 58 |
| 115 South Dr | 0.54mi | 2/1.0 (-1) | 886 (-6%) | 6mo | $90,000 | $102 | 52 |
| 603 W 33rd St | 0.34mi | 2/1.0 (-1) | 840 (-11%) | 8mo | $65,000 | $77 | 52 |
| 123 E 35th St | 0.70mi | 2/1.0 (-1) | 885 (-6%) | 4mo | $29,000 | $33 | 47 |
Match score weights: distance 35% · size 25% · config 20% · recency 20%. Top-matched comps best support the ARV.
Projected returns pro-forma
-3.0% appreciation · 3.0% rent growth · sell at horizon
- IRR
- -8.5%
- Equity multiple
- 0.69×
- Total profit
- $-9,158
- Equity at exit
- $15,641
- IRR
- 1.1%
- Equity multiple
- 1.07×
- Total profit
- $2,192
- Equity at exit
- $9,070
Cash invested: $29,372 (down + closing). Projections, not guarantees.
Landlord ↔ Tenant lean methodology
- Overall (STATE)
- 90 Strongly Landlord-Friendly
- State Indiana
- 90 Strongly Landlord-Friendly · R+11
- County
- — inherits STATE
- City
- — inherits STATE
ZIP-level market 46013
- Home prices YoY
- -26.9%
- Active inventory
- 150
- Price-to-rent
- 8.0×
Monthly cashflow live
- Estimated rent
- $1,092 high interval (Pro) →
- Mortgage (P&I)
- −$550
- Tax from tax record
- −$146 /mo · $1,758/yr
- Insurance
- −$44
- HOA
- −$0
- Vacancy / Maint / Mgmt
- −$229
- Net cashflow
- $123
Break-even live
UW: 25.0% down · 7.5% · 30yr · 1.5% tax · 5.0% vac · 8.0% maint · 8.0% mgmt
Financing live
Cash to close
- Down payment
- $26,225
- Closing costs
- $3,147
- Reserves months
- —
- Total cash needed
- —
Loan-product check · same deal, 3 products live
Conventional
25% down · 7.5% · 30yr
- Down + closing
- —
- Monthly P&I
- —
- Monthly cashflow
- —
- DSCR
- —
- Eligible?
- —
Personal DTI + credit; lowest rate.
DSCR
20% down · 8.5% · 30yr
- Down + closing
- —
- Monthly P&I
- —
- Monthly cashflow
- —
- DSCR
- —
- Eligible?
- —
No personal income docs; deal must DSCR.
Hard money
10% down · 12.0% · 12mo
- Down + closing
- —
- Monthly P&I
- —
- Monthly cashflow
- —
- DSCR
- —
- Eligible?
- —
Short-term bridge; refi at stabilization.
Rent comps 23 comps
| Address | Beds | Baths | Sqft | Rent | $/sqft | DOM | Units | Dist |
|---|---|---|---|---|---|---|---|---|
| 4015 Haverhill Dr Anderson, IN | 3.0 | 2.0 | 884 | $1,100 | $1.24 | 44d | 1 | 0.42mi |
| 4325 S Madison Ave Anderson, IN | 1.0–3.0 | 1.0–1.5 | 995 | $1,330 | $1.34 | 2d | 6 | 0.51mi |
| 2904 Lincoln St Anderson, IN | 2.0 | 1.0 | 864 | $900 | $1.04 | 44d | 1 | 0.74mi |
| 2820 Fairview St Unit A Anderson, IN | 2.0 | 1.0 | 850 | $895 | $1.05 | 44d | 1 | 0.75mi |
| 2627 Chase St Anderson, IN | 3.0 | 1.0 | 1050 | $850 | $0.81 | 18d | 1 | 0.90mi |
| 3000 Fletcher St Unit 3000 Anderson, IN | 2.0 | 1.0 | 800 | $650 | $0.81 | 44d | 1 | 0.97mi |
| 2442 Morton St Anderson, IN | 2.0 | 1.0 | 862 | $1,125 | $1.31 | 24d | 1 | 1.00mi |
| 2411 Hendricks St Anderson, IN | 3.0 | 1.0 | 860 | $1,000 | $1.16 | 24d | 1 | 1.04mi |
| 2625 Main St Anderson, IN | 2.0 | 1.0 | 988 | $895 | $0.91 | 24d | 1 | 1.04mi |
| 4426 Mellen Ct Anderson, IN | 2.0 | 1.0 | 899 | $900 | $1.00 | 2d | 1 | 1.05mi |
| 2301 Sheridan St Anderson, IN | 2.0 | 1.0 | 900 | $950 | $1.06 | 44d | 1 | 1.13mi |
| 3006 Noble St Anderson, IN | 2.0 | 1.0 | 1064 | $995 | $0.94 | 7d | 1 | 1.13mi |
| 2324 Chase St Anderson, IN | 2.0 | 1.0 | 783 | $950 | $1.21 | 44d | 1 | 1.13mi |
| 812 Mellen Dr Unit 814 Anderson, IN | 2.0 | 1.0 | 924 | $950 | $1.03 | 2d | 1 | 1.15mi |
| 2613 Louise St Anderson, IN | 2.0 | 1.0 | 1096 | $950 | $0.87 | 22d | 1 | 1.16mi |
| 2719 Dewey St Anderson, IN | 2.0 | 1.0 | 877 | $1,150 | $1.31 | 44d | 1 | 1.20mi |
| 618 W 22nd St Anderson, IN | 3.0 | 1.0 | 900 | $1,250 | $1.39 | 44d | 1 | 1.21mi |
| 4415 Columbus Ave Apt 15 Anderson, IN | 2.0 | 1.0 | 800 | $800 | $1.00 | 2d | 1 | 1.23mi |
| 2203 W 28th St Anderson, IN | 3.0 | 1.0 | 1068 | $1,000 | $0.94 | 44d | 1 | 1.24mi |
| 3009 E Lynn St Unit 1 Anderson, IN | 3.0 | 1.0 | 1000 | $875 | $0.88 | 20d | 1 | 1.36mi |
| 2111 Central Ave Anderson, IN | 3.0 | 1.0 | 1026 | $1,250 | $1.22 | 44d | 1 | 1.40mi |
| 2004 Arrow Ave Anderson, IN | 2.0 | 1.0 | 816 | $1,125 | $1.38 | 24d | 1 | 1.46mi |
| 417 E 55th St Anderson, IN | 2.0 | 1.0 | 724 | $1,100 | $1.52 | 22d | 1 | 1.46mi |
Listing history 29 events
-
2026-06-18days on market $104,900 Active 61 DOM
-
2026-06-17days on market $104,900 Active 60 DOM
-
2026-06-16days on market $104,900 Active 59 DOM
-
2026-06-15days on market $104,900 Active 58 DOM
-
2026-06-13days on market $104,900 Active 56 DOM
-
2026-06-09days on market $104,900 Active 52 DOM
-
2026-06-08days on market $104,900 Active 51 DOM
-
2026-06-07days on market $104,900 Active 50 DOM
-
2026-06-05days on market $104,900 Active 47 DOM
-
2026-06-03days on market $104,900 Active 46 DOM
-
2026-06-02days on market $104,900 Active 45 DOM
-
2026-06-01days on market $104,900 Active 44 DOM
-
2026-05-31days on market $104,900 Active 43 DOM
-
2026-05-18price $104,900 447-char remark
Show marketing remark (447 chars)
At 616 W 38th ST in ANDERSON, IN, USA, a single family residence awaits. This home features 3 bedrooms and 1 bathroom and full basement providing storage or more living area. The corner lot and large yard are great features as well as covered porch for sitting outside on quiet evenings. There is also a one car detached garage. Come and see this home as it will not last long! This is a great starter home or future rental for your portfolio.
-
2026-04-16$114,900 Active 447-char remark
Show marketing remark (447 chars)
At 616 W 38th ST in ANDERSON, IN, USA, a single family residence awaits. This home features 3 bedrooms and 1 bathroom and full basement providing storage or more living area. The corner lot and large yard are great features as well as covered porch for sitting outside on quiet evenings. There is also a one car detached garage. Come and see this home as it will not last long! This is a great starter home or future rental for your portfolio.
-
2025-08-23historical
-
2025-04-04status Active
-
2025-04-04price $144,900
-
2024-12-11historical
-
2024-10-22price $119,900
-
2024-09-21$132,000 Active
-
2019-04-03soldstatus $73,000 Sold
-
2019-04-03soldstatus $73,000
-
2019-03-01status Pending
-
2019-02-26$69,900 Active
-
2019-02-26$69,900
-
2019-01-02soldstatus $54,900 Sold
-
2018-11-22$54,900
-
2018-11-21historical
ⓘ Source: listings_history table (triggers on properties + properties_extension) + one-shot
backfill from property_details.listing_events for pre-trigger history.
Tax reassessment forecast IN · Partial reset (capped growth)
- Current annual tax
- $1,758 · $146/mo
- Projected year-2 tax
- $1,758 · $146/mo
- Expected delta
- $0/yr ($0/mo · -0.0%)
ⓘ Screening estimate from a state-policy table — verify with the county assessor before closing.
Climate risk First Street
- Flood 1/10 Low FEMA zone X (unshaded) · 0% chance over 30 yrs
- Wildfire 1/10 Low
- Heat 3/10 Moderate 7 d/yr ≥100°F today · 18 d/yr by 30 yrs out
- Wind 2/10 Low 0% chance of damaging wind over 30 yrs
- Air quality 3/10 Moderate 2 unhealthy d/yr today · 3 by 30 yrs out
Nearby sold comps map
Loading sold comps map…
Walkable amenities ~0.75 mi
Loading nearby amenities…
Taxation est. · year 1
- Rental income
- $13,109
- − Mortgage interest
- −$5,876
- − Property taxes
- −$1,758
- − Insurance
- −$524
- − Repairs & maintenance
- −$1,049
- − Management
- −$1,049
- − Depreciation
- −$3,052
- Taxable loss
- −$199
- Est. tax savings @ 24.0%
- +$48
- After-tax cash flow
- $1,520/yr
For passive investors: Depreciation is non-cash, so a rental often shows a tax loss while cash-flowing — sheltering income. Rental losses are passive: they offset passive income freely, and up to $25,000/yr can offset ordinary (W-2) income if you actively participate and your MAGI is under $100k (phasing out to $0 by $150k); unused losses carry forward. On sale, claimed depreciation is recaptured at up to 25%, and gains may owe capital-gains tax (a 1031 exchange can defer both). Figures are a year-1 estimate at your 24.0% rate — not tax advice; consult a CPA.
Schools (NCES district)
- District
- Anderson Community School Corporation
- NCES district ID
- 1800150
- Math proficiency
- 15% ▼ -14.00%
- Reading proficiency
- 23% ▼ -7.00%
- Median HH income
- $38,208
- Composite
- 15.93/100
- National rank
- #9250
- State rank
- #280 of 301 in IN
Livability — Anderson
- Score
- 60/100
- State rank
- #521
- US rank
- #18709
Category grades
Schools grade is shown separately in the Schools card above.
Census & demographics
- Census place
- Anderson, IN
- County
- Madison County · 69,445 people
- City population
- 57,762
- Metro
- Indianapolis-Carmel-Anderson, IN
- Population (ZIP)
- 19,073
- Household income
- $49,310
- Rent vs Own
- Severe rent burden
- 612.0
Population outlook (Madison County) Hauer SSP2
- Today (2025)
- 125,800 people
- By 2030
- 122,640 · -2.5%
- By 2040
- 115,420 · -8.3%
- By 2050
- 108,148 · -14.0%
- By 2075
- 91,838 · -27.0%
- By 2100
- 75,670 · -39.8%
Race, ethnicity, and origin ACS 2023
- Neighborhood character
- Predominantly White (83%)
- Race & ethnicity
- White 83% Two or more races 8% Black 7% Hispanic / Latino 3%
- Common ancestry
- Lithuanian 2% Slovak 2% Italian 1%
- Foreign-born
- 0% · Canada
- Languages at home
- 97% English-only · Spanish 2%
Political lean MEDSL · Madison
- 2024 margin
- Strong R (+26.9) · D 35.6% · R 62.5% · Other 1.9%
- 2008→2024 swing
- -33.5pp toward R · 2008: 6.5pp · 2024: -26.9pp
- All cycles
- 2024: R+26.9 2020: R+22.6 2016: R+25.7 2012: R+4.5 2008: D+6.5
Not yet ingested
- Civics
- —
Market trends
- HPI YoY
- ▼ -86.70%
- Current HPI
- 235.7485
- Rent YoY
- —
- Metro
- Indianapolis-Carmel-Anderson, IN
- State GDP YoY
- ▲ 2.90%
- F500 in state
- 18
Industry mix (Fortune 500 HQ in IN)
| Industry | F500 HQs | Revenue |
|---|---|---|
| Industrial Machinery | 2 | $37B |
|
||
| Healthcare | 1 | $177B |
|
||
| Pharmaceuticals | 1 | $45B |
|
||
| Metals / Steel | 1 | $18B |
|
||
| Agriculture | 1 | $17B |
|
||
| Packaging | 1 | $12B |
|
||
Price history
+91.1% since first listed16 events — show timeline
- 2026-05-18 Price Changed $104,900 MIBOR as Distributed by MLS Grid
- 2026-04-16 Listed $114,900 MIBOR as Distributed by MLS Grid
- 2025-08-23 Listing Removed — MIBOR as Distributed by MLS Grid
- 2025-04-04 Relisted — MIBOR as Distributed by MLS Grid
- 2025-04-04 Price Changed $144,900 MIBOR as Distributed by MLS Grid
- 2024-12-11 Listing Removed — MIBOR as Distributed by MLS Grid
- 2024-10-22 Price Changed $119,900 MIBOR as Distributed by MLS Grid
- 2024-09-21 Listed $132,000 MIBOR as Distributed by MLS Grid
- 2019-04-03 Sold (MLS) $73,000 IRMLS
- 2019-04-03 Sold (MLS) $73,000 MIBOR as Distributed by MLS Grid
- 2019-03-01 Pending — MIBOR as Distributed by MLS Grid
- 2019-02-26 Listed $69,900 MIBOR as Distributed by MLS Grid
- 2019-02-26 Listed $69,900 IRMLS
- 2019-01-02 Sold (MLS) $54,900 MIBOR as Distributed by MLS Grid
- 2018-11-22 Listed $54,900 MIBOR as Distributed by MLS Grid
- 2018-11-21 Listing Removed — MIBOR as Distributed by MLS Grid
Property tax history
+31.4%/yrLatest (2024): $1,758 · +33.4% YoY. Source: county tax records.
Cash-flow waterfall
monthlySold comps — $/sqft
last 12 mo · ≤1 miLoading sold comps…