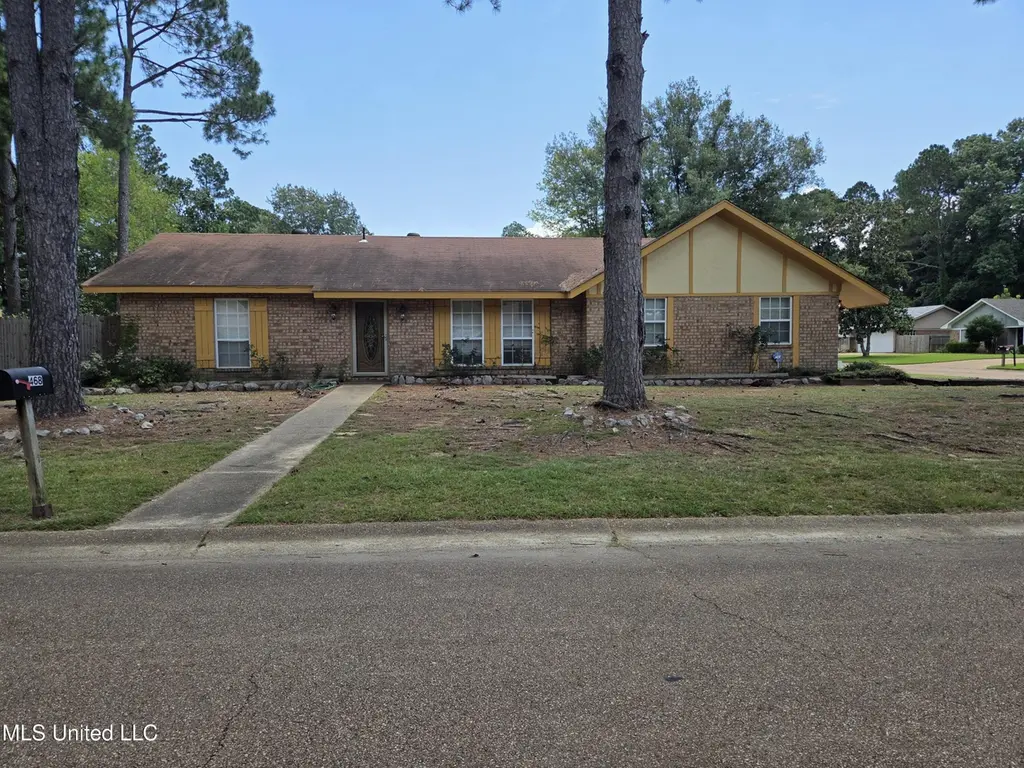
468 Longwood Trl · Madison, MS
Flood risk 1/10 · Minimal
- FEMA flood zone
- X (unshaded)
- Chance of flooding over 30 yrs
- 0.0%
- Est. flood insurance / yr
- $507 – $1,088
Fire risk 1/10 · Minimal
- Est. fire insurance / yr
- $1,241 – $2,305
Heat risk 7/10 · Major
- Hot days now (above 108°F)
- 7 days/yr
- Hot days in 30 yrs
- 20 days/yr
Wind risk 8/10 · Major
- Chance of severe wind over 30 yrs
- 80.0%
Air-quality risk 2/10 · Minimal
- Unhealthy air days now
- 0 days/yr
- Unhealthy air days in 30 yrs
- 1 days/yr
Risk factors via First Street. Map © Google.
Why this score? — see what drove the C- grade
The composite is a weighted blend of 9 inputs, each scored 0–100. Each bar is that input's sub-score; the figure is the points it added to the 100-point composite (weight × sub-score).
- Cash flow +17.4/30.0
- ARV discount +9.0/15.0
- DSCR +5.4/10.0
- Schools +4.8/10.0
- 1% rule +4.7/10.0
- Livability +4.0/5.0
- Rent growth +3.2/5.0
- Condition / age +2.5/5.0
- Appreciation +0.0/10.0
$239,999
🖨 Deal sheet (PDF) 📄 Offer letter ✓ Due diligence
Listing remarks
Charming 3-bedroom, 2-bath home situated on a spacious corner lot with plenty of curb appeal. This property features a large backyard complete with a nice storage shed and a matching dog house, perfect for pets or additional storage needs. Inside the home offers comfortable living spaces with great potential for updates and personalization. Conveniently located near local amenities, this home is being SOLD AS-IS, making it a wonderful opportunity for buyers or investors looking to add their own touch. Don't miss the chance to make this property yours!
Key facts
- Large backyard
- Dog house
- Storage shed
Tags
Property features AI
Finance
- HOA & community: Near entertainment, park, and restaurants
Exterior
- Parking: 2-car garage; Garage faces side; Concrete driveway
- Utilities: Public water; Public sewer; Cable available
- Home design: Single-family house; One story; Fixer condition
- Construction: Brick construction; Asphalt shingle roof; Slab foundation; Built in public-record year
- Exterior features: Patio; Private yard; Back yard privacy fencing; Wood fence; Kennel/dog run; Shed(s); Workshop; Corner lot
Interior
- Kitchen: Includes dishwasher and garbage disposal
- Bathrooms: 2 full bathrooms
- Heating & cooling: Central heating; Central air; Ceiling fans
- Interior features: Dishwasher; Disposal
Neighborhood map
What this means for you Summary
Snapshot
- This is a 3-bed/3.0-bath single-family listed at $240k.
Deal economics
- At list price, monthly cash flow is $182 ($2k/yr) — positive.
- The deal already cash-flows at list — no discount required.
- To meet the 1% rule (rent ≥ 1% of price), the offer needs to be $233k (2.9% below list).
- Recommended offer: $233k (3.0% below list) — sets the bar for market timing.
- Cap rate 7.2% vs local median 3.7% in Madison — top-decile yield for the area; either an underpriced asset or a hidden risk that comps aren't pricing in. Stress-test before assuming the spread holds.
Location & tenants
- Location reads 81/100 on livability (#4 in MS, #1,556 nationally) — a professional / high-income tenant draw. Strengths: crime A+, employment A+, housing A+; Watch: amenities D-, commute F.
- Madison County School District (rural): math 54% / reading 54% proficiency, ranked #3 of 130 in MS (top 2%) — acceptable for families but not a draw, mixed tenant base, ~2y average lease.
- Zoned schools: Madison Avenue Lower Elementary (437 students, 99% FRL); Madison Middle School (math 66% / reading 57%, grade B+, #6 of 179 statewide, top 3%, 1,154 students, 100% FRL); Madison Central High School (math 5% / reading 63%, grade F, #78 of 197 statewide, top 39%, 1,246 students, 100% FRL) — zoned schools average 100% FRL vs 29% district-wide (70 pts higher); higher-poverty schools than district average — tighter screening recommended.
- Market conditions: Rents rising (+2.6%/yr); 628 active listings in the ZIP; high-income renter base; 553 units permitted in Madison County in 2024 (0 in 5+ unit buildings).
Forward outlook
- Local home prices are declining (-3.0%/yr); year-one equity from $2k of loan paydown is wiped out by about $7k of value loss. Plan a longer hold.
- Madison County population projected at +34% by 2050 — long-run rental-demand tailwind backs the buy-and-hold thesis.
Negotiation context
- It's been on market 55 days — a 3% lower offer ($233k) is reasonable based on typical stale-listing flexibility.
- 3 sale attempts with the ask held roughly flat each time — persistent listings suggest the price (not the market) is what's stuck; bring a comps-based counter.
Risks & watch-outs
- Climate carrying-cost: severe wind risk, 80% chance of damaging wind over 30y; extreme-heat days projected 7→20/yr by 2055 (HVAC capex compounding) — expect insurance premiums to compound above CPI over the hold.
Questions for the listing agent
- It's been on market 55 days. Have you received any prior offers? Is the seller open to a 3% concession, seller financing, or rate buy-down credit?
- Built in 1974 — when were the roof, HVAC, electrical panel, plumbing, and water heater last replaced?
- Is there a deadline driving the sale (1031 exchange, divorce, estate, relocation)? That informs how much negotiation room exists.
- Schools are A-rated — typically a magnet for longer-tenancy family renters. What's the average tenant stay here, and is there a school-zone premium baked into asking?
- What's the average days-on-market for RENTAL listings here right now (not sales)? A rising rental-DOM trend means longer vacancies and softer asking-rent achievability than the comps imply.
- What's the recent tenant-quality profile in this submarket — average credit score on applications, eviction rate, late-payment / NSF rate, and stable-employment percentage? A property-management company in the area should have these aggregated.
- How much new for-sale + rental construction is in the pipeline within 1–3 miles? Heavy new supply typically softens prices + rents 12–24 months out; constrained supply supports both.
Investment metrics
- 1% rule
- 0.97% ✗
- Cap rate
- 7.20%
- Cash-on-cash
- 3.24%
- DSCR
- 1.14
- GRM
- 8.6
CMA / ARV
- ARV (median comp)
- $248,544
- List price
- $239,999
- Delta
- -3.44%
- Verdict
- FAIR
- Comps
- 20 within 1.0 mi
Show comp detail 8 sales within ~0.75 mi
| Address | Dist | Beds/Ba | Sqft | Sold | Price | $/sf | Match |
|---|---|---|---|---|---|---|---|
| 456 Longwood Trl | 0.06mi | 3/2.0 | 1,332 (+11%) | 11mo | $240,000 | $180 | 66 |
| 166 Cypress Dr | 0.28mi | 3/2.0 | 1,345 (+12%) | 2mo | $246,000 | $183 | 62 |
| 131 Cypress Dr | 0.35mi | 3/2.0 | 1,281 (+6%) | 9mo | $237,500 | $185 | 61 |
| 109 Twin Oaks Dr | 0.38mi | 3/2.0 | 1,288 (+7%) | 7mo | $239,000 | $186 | 61 |
| 250 Traceland Dr | 0.14mi | 3/2.0 | 1,305 (+8%) | 20mo | $219,900 | $169 | 59 |
| 232 Lisa Cir | 0.72mi | 3/2.0 | 1,314 (+9%) | 5mo | $228,500 | $174 | 43 |
| 405 Beaver Creek Dr | 0.72mi | 3/2.0 | 1,375 (+14%) | 3mo | $215,000 | $156 | 36 |
| 304 Pebble Creek Dr | 0.49mi | 3/2.5 | 1,382 (+15%) | 23mo | $199,000 | $144 | 31 |
Match score weights: distance 35% · size 25% · config 20% · recency 20%. Top-matched comps best support the ARV.
Projected returns pro-forma
-3.0% appreciation · 2.61% rent growth · sell at horizon
- IRR
- -11.6%
- Equity multiple
- 0.58×
- Total profit
- $-28,201
- Equity at exit
- $35,785
- IRR
- -3.0%
- Equity multiple
- 0.80×
- Total profit
- $-13,231
- Equity at exit
- $20,751
Cash invested: $67,200 (down + closing). Projections, not guarantees.
Landlord ↔ Tenant lean methodology
- Overall (STATE)
- 90 Strongly Landlord-Friendly
- State Mississippi
- 90 Strongly Landlord-Friendly · R+11
- County
- — inherits STATE
- City
- — inherits STATE
ZIP-level market 39110
- Home prices YoY
- -28.3%
- Rents YoY
- 2.6%
- Active inventory
- 628
- Price-to-rent
- 8.6×
Monthly cashflow live
- Estimated rent
- $2,329 medium interval (Pro) →
- Mortgage (P&I)
- −$1,259
- Tax est. 1.5%
- −$300 /mo · $3,600/yr
- Insurance
- −$100
- HOA
- −$0
- Vacancy / Maint / Mgmt
- −$489
- Net cashflow
- $182
Break-even live
Sensitivity live
| Price | -10% $347 | -5% $264 | +0% $182 | +5% $99 | +10% $16 |
|---|---|---|---|---|---|
| Rent | -10% $-2 | -5% $90 | +0% $182 | +5% $274 | +10% $366 |
| Rate | -1.0pp $302 | -0.5pp $243 | base $182 | +0.5pp $119 | +1.0pp $56 |
UW: 25.0% down · 7.5% · 30yr · 1.5% tax · 5.0% vac · 8.0% maint · 8.0% mgmt
Financing live
Cash to close
- Down payment
- $60,000
- Closing costs
- $7,200
- Reserves months
- —
- Total cash needed
- —
Loan-product check · same deal, 3 products live
Conventional
25% down · 7.5% · 30yr
- Down + closing
- —
- Monthly P&I
- —
- Monthly cashflow
- —
- DSCR
- —
- Eligible?
- —
Personal DTI + credit; lowest rate.
DSCR
20% down · 8.5% · 30yr
- Down + closing
- —
- Monthly P&I
- —
- Monthly cashflow
- —
- DSCR
- —
- Eligible?
- —
No personal income docs; deal must DSCR.
Hard money
10% down · 12.0% · 12mo
- Down + closing
- —
- Monthly P&I
- —
- Monthly cashflow
- —
- DSCR
- —
- Eligible?
- —
Short-term bridge; refi at stabilization.
Listing history 22 events
-
2026-06-18days on market $239,999 Active 55 DOM
-
2026-06-17days on market $239,999 Active 54 DOM
-
2026-06-16days on market $239,999 Active 53 DOM
-
2026-06-15days on market $239,999 Active 52 DOM
-
2026-06-14days on market $239,999 Active 50 DOM
-
2026-06-10days on market $239,999 Active 47 DOM
-
2026-06-09days on market $239,999 Active 46 DOM
-
2026-06-08days on market $239,999 Active 45 DOM
-
2026-06-07days on market $239,999 Active 44 DOM
-
2026-06-03days on market $239,999 Active 40 DOM
-
2026-06-02days on market $239,999 Active 39 DOM
-
2026-06-01days on market $239,999 Active 38 DOM
-
2026-05-31days on market $239,999 Active 37 DOM
-
2026-05-30days on market $239,999 Active 36 DOM
-
2026-04-24$239,999 Active 558-char remark
-
2026-03-13historical
-
2025-12-26$239,999 Active
-
2025-12-11historical
-
2025-09-09price $271,000
-
2025-09-01$281,000 Active
-
2006-09-15soldstatus
-
1981-12-01soldstatus
ⓘ Source: listings_history table (triggers on properties + properties_extension) + one-shot
backfill from property_details.listing_events for pre-trigger history.
Climate risk First Street
- Flood 1/10 Low FEMA zone X (unshaded) · 0% chance over 30 yrs
- Wildfire 1/10 Low
- Heat 7/10 Severe 7 d/yr ≥108°F today · 20 d/yr by 30 yrs out
- Wind 8/10 Severe 80% chance of damaging wind over 30 yrs
- Air quality 2/10 Low 0 unhealthy d/yr today · 1 by 30 yrs out
Nearby sold comps map
Loading sold comps map…
Walkable amenities ~0.75 mi
Loading nearby amenities…
Taxation est. · year 1
- Rental income
- $27,952
- − Mortgage interest
- −$13,444
- − Property taxes
- −$3,600
- − Insurance
- −$1,200
- − Repairs & maintenance
- −$2,236
- − Management
- −$2,236
- − Depreciation
- −$6,982
- Taxable loss
- −$1,746
- Est. tax savings @ 24.0%
- +$419
- After-tax cash flow
- $2,598/yr
For passive investors: Depreciation is non-cash, so a rental often shows a tax loss while cash-flowing — sheltering income. Rental losses are passive: they offset passive income freely, and up to $25,000/yr can offset ordinary (W-2) income if you actively participate and your MAGI is under $100k (phasing out to $0 by $150k); unused losses carry forward. On sale, claimed depreciation is recaptured at up to 25%, and gains may owe capital-gains tax (a 1031 exchange can defer both). Figures are a year-1 estimate at your 24.0% rate — not tax advice; consult a CPA.
Schools (NCES district)
- District
- Madison County School District
- NCES district ID
- 2802790
- Math proficiency
- 54% ▼ -7.00%
- Reading proficiency
- 54% ▼ -7.00%
- Median HH income
- $70,579
- Composite
- 48.08/100
- National rank
- #2188
- State rank
- #3 of 130 in MS
Livability — Madison
- Score
- 81/100
- State rank
- #4
- US rank
- #1556
Category grades
Schools grade is shown separately in the Schools card above.
Census & demographics
- Census place
- Madison, MS
- County
- Madison County · 75,005 people
- City population
- 50,443
- Metro
- Jackson, MS
- Population (ZIP)
- 50,443
- Household income
- $125,506
- Rent vs Own
- Severe rent burden
- 227.0
Population outlook (Madison County) Hauer SSP2
- Today (2025)
- 122,509 people
- By 2030
- 131,737 · +7.5%
- By 2040
- 148,930 · +21.6%
- By 2050
- 164,300 · +34.1%
- By 2075
- 197,495 · +61.2%
- By 2100
- 211,429 · +72.6%
Race, ethnicity, and origin ACS 2023
- Neighborhood character
- Predominantly White (76%)
- Race & ethnicity
- White 76% Black 15% Asian 4% Two or more races 3% Hispanic / Latino 2%
- Common ancestry
- Italian 6% Slovak 3% Lithuanian 3%
- Foreign-born
- 5% · China, Canada
- Languages at home
- 92% English-only · Spanish 2% Other Indo-European 2% Chinese 1%
Political lean MEDSL · Madison
- 2024 margin
- R (+17.3) · D 40.8% · R 58.0% · Other 1.2%
- 2008→2024 swing
- -1.7pp toward R · 2008: -15.6pp · 2024: -17.3pp
- All cycles
- 2024: R+17.3 2020: R+11.8 2016: R+16.1 2012: R+15.7 2008: R+15.6
Not yet ingested
- Civics
- —
Market trends
- HPI YoY
- ▼ -60.99%
- Current HPI
- 154.6909
- Rent YoY
- ▲ 2.61%
- Metro
- Jackson, MS
- State GDP YoY
- —
- F500 in state
- 0
Price history
-14.6% since first listed8 events — show timeline
- 2026-04-24 Listed $239,999 MLSU
- 2026-03-13 Listing Removed — MLSU
- 2025-12-26 Listed $239,999 MLSU
- 2025-12-11 Listing Removed — MLSU
- 2025-09-09 Price Changed $271,000 MLSU
- 2025-09-01 Listed $281,000 MLSU
- 2006-09-15 Sold (Public Records) — Public Records
- 1981-12-01 Sold (Public Records) — Public Records
Property tax history
-22.8%/yrLatest (2025): $54 · +0.0% YoY. Source: county tax records.
Cash-flow waterfall
monthlySold comps — $/sqft
last 12 mo · ≤1 miLoading sold comps…