 Fourplex
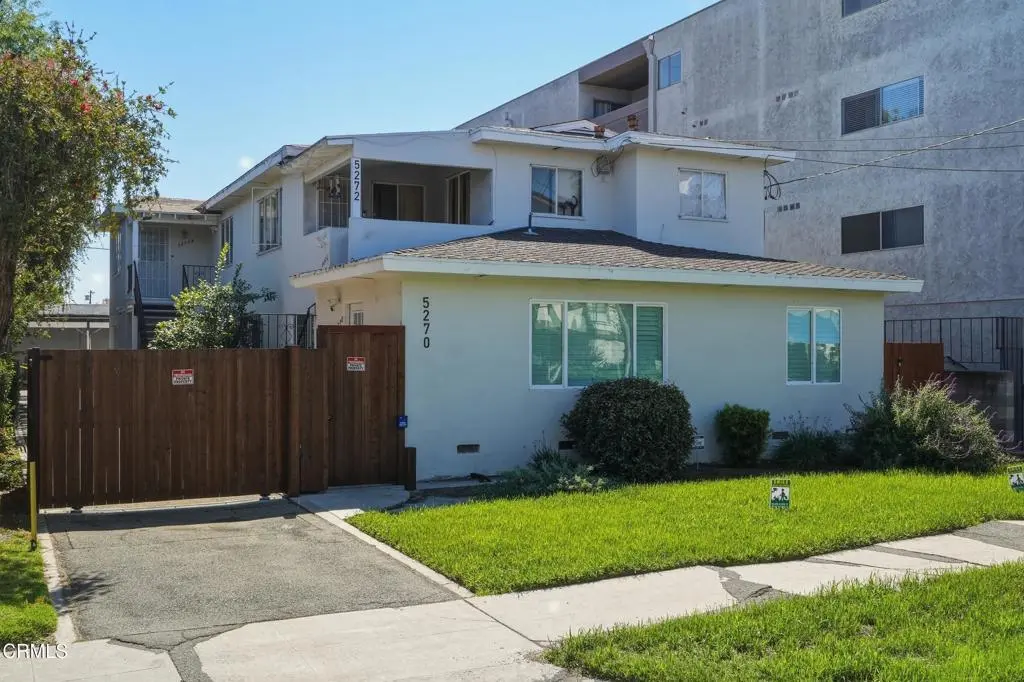
5270 Bellingham Ave · Los Angeles, CA
Flood risk 1/10 · Minimal
- FEMA flood zone
- X (unshaded)
- Chance of flooding over 30 yrs
- 0.0%
- Est. flood insurance / yr
- $507 – $1,088
Fire risk 1/10 · Minimal
- Est. fire insurance / yr
- $659 – $1,223
Heat risk 6/10 · Moderate
- Hot days now (above 97°F)
- 7 days/yr
- Hot days in 30 yrs
- 23 days/yr
Wind risk 1/10 · Minimal
- Chance of severe wind over 30 yrs
- —
Air-quality risk 5/10 · Moderate
- Unhealthy air days now
- 7 days/yr
- Unhealthy air days in 30 yrs
- 9 days/yr
Risk factors via First Street. Map © Google.
Why this score? — see what drove the D grade
The composite is a weighted blend of 9 inputs, each scored 0–100. Each bar is that input's sub-score; the figure is the points it added to the 100-point composite (weight × sub-score).
- Cash flow +14.5/30.0
- ARV discount +9.7/15.0
- DSCR +4.4/10.0
- 1% rule +3.7/10.0
- Schools +3.6/10.0
- Livability +3.4/5.0
- Condition / age +2.5/5.0
- Rent growth +2.2/5.0
- Appreciation +0.0/10.0
$1,349,000
🖨 Deal sheet 📄 Offer letter ✓ Due diligence
Multi-family units
County records classify this as Multi-Family (2-4 Unit). Listing-text estimate: 4 units. confirmed
Listing remarks
Exceptional investment opportunity in the heart of Valley Village featuring a well-maintained quadplex comprised of two 2-bedroom, 1-bathroom units and two 1-bedroom, 1-bathroom units. This attractive income property offers a desirable unit mix along with covered carport parking for each unit, with the carport currently being rebuilt and improved. The vacant front unit has been tastefully upgraded and showcases a beautifully remodeled kitchen with custom cabinetry, quartz countertops, stainless steel appliances, designer tile flooring, an upgraded spa-inspired bathroom with soaking tub and walk-in shower, refinished hardwood flooring, recessed lighting, and washer/dryer hook-ups for added c
Key facts
- Custom cabinetry
- Quartz countertops
- Remodeled kitchen
Tags
Property features AI
Finance
- Other: Tenants are responsible for gas, water, cable TV and electricity
- Financial info: Total building area 3,840 (building area reported); Total of 4 units; Gross income and scheduled income reported at $51,090; Net operating income reported at $13,423; Gross multiplier reported at 26.4; Operating/annual expenses reported at $36,135 (including insurance, trash, electric, water/sewer, fuel)
- HOA & community: Rent control applies; Community features include street lighting, sidewalks, and suburban setting
Exterior
- Parking: Assigned parking; Carport (4 carport spaces total); Driveway parking
- Security: Gated community; Carbon monoxide and smoke detectors; Smoke detectors
- Utilities: Public/district water; Public sewer (sewer paid); Natural gas connected; Electricity connected; Water connected; Separate water, gas, and electric meters for units (4 each)
- Home design: Attached property; Two-story building; Faces west; Fixer condition; Has view
- Construction: Frame and stucco construction; Common roof; Raised foundation; Year built per public records
- Exterior features: Block wall and wood fencing; No pool; Sprinkler system and lawn; Front yard; Level/flat lot with street-level access; Landscaped; Near public transit
Interior
- Kitchen: Gas range; Range/stove hood; Refrigerator; Tankless water heater
- Bedrooms: Unit mix includes 1-bedroom and 2-bedroom units (unit-level details available)
- Flooring: Tile; Wood
- Bathrooms: One bathroom in each listed unit
- Heating & cooling: Central cooling; Central furnace heating
- Interior features: Recessed lighting; Stone counters; Gated community; Carbon monoxide and smoke detectors; Two levels
- Laundry & utility: Washer hookup; Gas dryer hookup; In-closet laundry
Neighborhood map
What this means for you Summary
Snapshot
- This is a 4 × 3-bed/2.0-bath units multifamily listed at $1.35M.
Deal economics
- At list price, monthly cash flow is $293 ($4k/yr) — positive. Per door: $73/mo.
- The deal already cash-flows at list — no discount required.
- To meet the 1% rule (rent ≥ 1% of price), the offer needs to be $1.17M (12.9% below list).
- Recommended offer: $1.17M (12.9% below list) — sets the bar for 1% rule.
- Cap rate 6.6% vs local median 2.1% in Los Angeles — top-decile yield for the area; either an underpriced asset or a hidden risk that comps aren't pricing in. Stress-test before assuming the spread holds.
Location & tenants
- Location reads 68/100 on livability (#273 in CA) — a middle-class / working-renter tenant base. Strengths: amenities A+, commute A+, employment B; Watch: health & safety C-, schools D+, crime F.
- Los Angeles Unified (urban): math 29% / reading 54% proficiency, ranked #223 of 517 in CA (top 43%) — families likely to look elsewhere, expect single-tenant / working-renter base with shorter leases; 67% free/reduced lunch — lower-income household profile, screen leases tightly.
- Market conditions: Rents soft (-1.1%/yr); 90 active listings in the ZIP; 9 comparable units currently listed for rent nearby; rentals at typical pace (median 22d on market — plan ~3-4 weeks tenant-placement turnaround); solid renter incomes; 19,697 units permitted in Los Angeles County in 2024 (9,426 in 5+ unit buildings).
- At $11,749/mo this rent would consume 160% of the median local household income ($88k/yr) (locally 3099% of renters already pay >50% of income on rent) — very limited rent-growth headroom before tenants either downsize or default.
Forward outlook
- Local home prices are declining (-3.0%/yr); year-one equity from $9k of loan paydown is wiped out by about $40k of value loss. Plan a longer hold.
- Los Angeles County population projected at +9% by 2050 — modest demand growth; plan on rents tracking national, not racing it.
Negotiation context
- It's been on market 30 days — a 2% lower offer ($1.33M) is reasonable based on typical stale-listing flexibility.
- 5 sale attempts since 20y ago with the ask held roughly flat each time — persistent listings suggest the price (not the market) is what's stuck; bring a comps-based counter.
- Current owner paid $1.15M; 17% above their basis — modest negotiation headroom, anchor on the comps not their cost.
Risks & watch-outs
- Watch-outs: built in 1953 — expect roof / HVAC / electrical / plumbing capex.
- Climate carrying-cost: extreme-heat days projected 7→23/yr by 2055 (HVAC capex compounding) — expect insurance premiums to compound above CPI over the hold.
Questions for the listing agent
- Can we see the unit-by-unit rent roll, current vacancy, and any below-market leases? What's the average tenancy length?
- What capital expenditures (roof, boiler, parking lot, exteriors) have been made in the last 5 years, and what's planned in the next 2?
- Built in 1953 — when were the roof, HVAC, electrical panel, plumbing, and water heater last replaced?
- Is there a deadline driving the sale (1031 exchange, divorce, estate, relocation)? That informs how much negotiation room exists.
- Schools are D-rated, which usually means shorter tenancies and higher turnover. Who's the typical renter profile here, and what's been the actual vacancy rate?
- Crime grade is F in this area — have there been break-ins, vandalism, or insurance claims at this property in the last 3 years? What carrier currently insures it and at what premium?
- The area grade is low — what's the realistic commute time and amenity access for the typical tenant pool here? Any planned neighborhood developments (good or bad) we should know about?
- What's the average days-on-market for RENTAL listings here right now (not sales)? A rising rental-DOM trend means longer vacancies and softer asking-rent achievability than the comps imply.
- What's the recent tenant-quality profile in this submarket — average credit score on applications, eviction rate, late-payment / NSF rate, and stable-employment percentage? A property-management company in the area should have these aggregated.
- How much new apartment / multifamily construction is in the pipeline within 1–3 miles? Heavy new supply (>2% of stock underway) typically softens rents 12–24 months out; light construction supports rent growth.
Investment metrics
- 1% rule
- 0.87% ✗
- Cap rate
- 6.55%
- Cash-on-cash
- 0.93%
- DSCR
- 1.04
- GRM
- 9.6
CMA / ARV
- ARV (on-the-fly)
- $1,416,960
- Comps found
- 4
Show comp detail 4 sales within ~0.75 mi
| Address | Dist | Beds/Ba | Sqft | Sold | Price | $/sf | Match |
|---|---|---|---|---|---|---|---|
| 5312 Vantage Ave | 0.07mi | 6/4.0 | 3,348 (-13%) | 1mo | $1,050,000 | $314 | 75 |
| 5318 Vantage Ave | 0.07mi | 6/4.0 | 3,348 (-13%) | 10mo | $745,000 | $223 | 67 |
| 12032 Magnolia Blvd | 0.24mi | 6/5.0 | 3,670 (-4%) | 18mo | $1,355,000 | $369 | 62 |
| 11758 11752 Magnolia Blvd | 0.55mi | 7/6.0 (+1) | 4,308 (+12%) | 6mo | $1,760,000 | $409 | 36 |
Match score weights: distance 35% · size 25% · config 20% · recency 20%. Top-matched comps best support the ARV.
Projected returns pro-forma
-3.0% appreciation · 0.0% rent growth · sell at horizon
- IRR
- -18.1%
- Equity multiple
- 0.38×
- Total profit
- $-234,405
- Equity at exit
- $201,140
- IRR
- -17.4%
- Equity multiple
- 0.17×
- Total profit
- $-313,278
- Equity at exit
- $116,637
Cash invested: $377,720 (down + closing). Projections, not guarantees.
Landlord ↔ Tenant lean methodology
- Overall (CITY)
- 0 Strongly Tenant-Friendly
- State California
- 18 Strongly Tenant-Friendly · D+13
- County
- — inherits STATE
- City Los Angeles
- 0 Strongly Tenant-Friendly · D+22
ZIP-level market 91607
- Rents YoY
- -1.1%
- Active inventory
- 90
- Price-to-rent
- 38.3×
Monthly cashflow live
- Estimated rent
- $11,749 high interval (Pro) →
- Mortgage (P&I)
- −$7,074
- Tax from tax record
- −$1,352 /mo · $16,230/yr
- Insurance
- −$562
- HOA
- −$0
- Vacancy / Maint / Mgmt
- −$2,467
- Net cashflow
- $293
Break-even live
4-unit breakdown (identical units grouped — click to expand)
| Units | Beds | Baths | Est. rent |
|---|---|---|---|
| 4× units | 3 | 2 | $11,748 |
| #1 | 3 | 2 | $2,937 |
| #2 | 3 | 2 | $2,937 |
| #3 | 3 | 2 | $2,937 |
| #4 | 3 | 2 | $2,937 |
| Total (4 units) | $11,749 | ||
UW: 25.0% down · 7.5% · 30yr · 1.5% tax · 5.0% vac · 8.0% maint · 8.0% mgmt
Financing live
Cash to close
- Down payment
- $337,250
- Closing costs
- $40,470
- Reserves months
- —
- Total cash needed
- —
Loan-product check · same deal, 3 products live
Conventional
25% down · 7.5% · 30yr
- Down + closing
- —
- Monthly P&I
- —
- Monthly cashflow
- —
- DSCR
- —
- Eligible?
- —
Personal DTI + credit; lowest rate.
DSCR
20% down · 8.5% · 30yr
- Down + closing
- —
- Monthly P&I
- —
- Monthly cashflow
- —
- DSCR
- —
- Eligible?
- —
No personal income docs; deal must DSCR.
Hard money
10% down · 12.0% · 12mo
- Down + closing
- —
- Monthly P&I
- —
- Monthly cashflow
- —
- DSCR
- —
- Eligible?
- —
Short-term bridge; refi at stabilization.
Rent comps 9 comps
| Address | Beds | Baths | Sqft | Rent | $/sqft | DOM | Units | Dist |
|---|---|---|---|---|---|---|---|---|
| 12249 Addison St North Hollywood, CA | 6.0 | 6.5 | 4231 | $24,500 | $5.79 | 1d | 1 | 0.39mi |
| 11937 Addison St Valley Village, CA | 5.0 | 5.5 | 5045 | $34,500 | $6.84 | 22d | 1 | 0.49mi |
| 12041 Huston St Valley Village, CA | 5.0 | 5.0 | 4038 | $11,995 | $2.97 | 22d | 1 | 0.55mi |
| 11748 La Maida St Valley Village, CA | 5.0 | 5.5 | 4983 | $19,950 | $4.00 | 24d | 1 | 0.81mi |
| 12606 Emelita St Valley Village, CA | 5.0 | 3.5 | 3000 | $12,950 | $4.32 | 43d | 1 | 0.82mi |
| 5010 Fulton Ave Sherman Oaks, CA | 7.0 | 7.0 | 3286 | $15,500 | $4.72 | 43d | 1 | 1.38mi |
| 4533 Farmdale Ave North Hollywood, CA | 5.0 | 5.5 | 3821 | $15,000 | $3.93 | 43d | 1 | 1.38mi |
| 4627 Ethel Ave Sherman Oaks, CA | 5.0 | 5.0 | 3012 | $16,500 | $5.48 | 2d | 1 | 1.40mi |
| 4435 Camellia Ave North Hollywood, CA | 5.0 | 6.0 | 5130 | $19,000 | $3.70 | 1d | 1 | 1.43mi |
Listing history 26 events
-
2026-06-18days on market $1,349,000 Active 30 DOM
-
2026-06-17days on market $1,349,000 Active 29 DOM
-
2026-06-16days on market $1,349,000 Active 28 DOM
-
2026-06-15days on market $1,349,000 Active 27 DOM
-
2026-06-13days on market $1,349,000 Active 25 DOM
-
2026-06-09days on market $1,349,000 Active 21 DOM
-
2026-06-08days on market $1,349,000 Active 20 DOM
-
2026-06-07days on market $1,349,000 Active 19 DOM
-
2026-06-04days on market $1,349,000 Active 16 DOM
-
2026-06-03days on market $1,349,000 Active 15 DOM
-
2026-06-02days on market $1,349,000 Active 14 DOM
-
2026-06-01days on market $1,349,000 Active 13 DOM
-
2026-05-31days on market $1,349,000 Active 12 DOM
-
2026-05-19$1,349,000 Active
-
2018-05-03soldstatus $1,150,000
-
2017-10-13historical
-
2017-10-13historical
-
2017-07-13status Active
-
2017-07-13historical Active Under Contract
-
2017-04-18price $1,265,000
-
2017-03-20$1,325,000 Active
-
2017-03-16$1,265,000
-
2007-06-20historical
-
2006-06-20$1,350,000
-
2003-04-09soldstatus $550,000
-
1977-09-15soldstatus $107,000
ⓘ Source: listings_history table (triggers on properties + properties_extension) + one-shot
backfill from property_details.listing_events for pre-trigger history.
Tax reassessment forecast CA · Resets to sale price
- Current annual tax
- $16,230 · $1,352/mo
- Projected year-2 tax
- $16,230 · $1,352/mo
- Expected delta
- $0/yr ($0/mo · 0.0%)
ⓘ Screening estimate from a state-policy table — verify with the county assessor before closing.
Climate risk First Street
- Flood 1/10 Low FEMA zone X (unshaded) · 0% chance over 30 yrs
- Wildfire 1/10 Low
- Heat 6/10 Major 7 d/yr ≥97°F today · 23 d/yr by 30 yrs out
- Wind 1/10 Low
- Air quality 5/10 Major 7 unhealthy d/yr today · 9 by 30 yrs out
Nearby sold comps map
Loading sold comps map…
Walkable amenities ~0.75 mi
Loading nearby amenities…
Taxation est. · year 1
- Rental income
- $140,988
- − Mortgage interest
- −$75,565
- − Property taxes
- −$16,230
- − Insurance
- −$6,745
- − Repairs & maintenance
- −$11,279
- − Management
- −$11,279
- − Depreciation
- −$39,244
- Taxable loss
- −$19,354
- Est. tax savings @ 24.0%
- +$4,645
- After-tax cash flow
- $8,159/yr
For passive investors: Depreciation is non-cash, so a rental often shows a tax loss while cash-flowing — sheltering income. Rental losses are passive: they offset passive income freely, and up to $25,000/yr can offset ordinary (W-2) income if you actively participate and your MAGI is under $100k (phasing out to $0 by $150k); unused losses carry forward. On sale, claimed depreciation is recaptured at up to 25%, and gains may owe capital-gains tax (a 1031 exchange can defer both). Figures are a year-1 estimate at your 24.0% rate — not tax advice; consult a CPA.
Schools (NCES district)
- District
- Los Angeles Unified
- NCES district ID
- 0622710
- Math proficiency
- 29% ▼ -4.00%
- Reading proficiency
- 54% ▲ 10.00%
- Median HH income
- $50,403
- Composite
- 35.67/100
- National rank
- #4875
- State rank
- #223 of 517 in CA
Livability — Los Angeles
- Score
- 68/100
- State rank
- #273
- US rank
- #9237
Category grades
Schools grade is shown separately in the Schools card above.
Census & demographics
- Census place
- Los Angeles, CA
- County
- Los Angeles County · 9,444,647 people
- City population
- 3,838,149
- Metro
- Los Angeles-Long Beach-Anaheim, CA
- Population (ZIP)
- 31,890
- Household income
- $87,874
- Rent vs Own
- Severe rent burden
- 3099.0
Population outlook (Los Angeles County) Hauer SSP2
- Today (2025)
- 10,940,515 people
- By 2030
- 11,256,481 · +2.9%
- By 2040
- 11,729,929 · +7.2%
- By 2050
- 11,948,407 · +9.2%
- By 2075
- 11,818,114 · +8.0%
- By 2100
- 10,842,928 · -0.9%
Race, ethnicity, and origin ACS 2023
- Neighborhood character
- Diverse neighborhood (Simpson 0.62)
- Race & ethnicity
- White 57% Hispanic / Latino 21% Two or more races 15% Asian 8% Black 7%
- Hispanic origin (detail)
- Mexican 11%
- Common ancestry
- Scotch-Irish 4% Romanian 3% Subsaharan African 2%
- Foreign-born
- 29% · Canada, Vietnam, Jamaica
- Languages at home
- 61% English-only · Spanish 16% Other Indo-European 9% Russian/Polish/Slavic 7%
Political lean MEDSL · Los Angeles
- 2024 margin
- Solid D (+32.9) · D 64.8% · R 31.9% · Other 3.3%
- 2008→2024 swing
- -7.4pp toward R · 2008: 40.4pp · 2024: 32.9pp
- All cycles
- 2024: D+32.9 2020: D+44.2 2016: D+48.0 2012: D+40.0 2008: D+40.4
Not yet ingested
- Civics
- —
Market trends
- HPI YoY
- ▼ -861.04%
- Current HPI
- 464.0519
- Rent YoY
- ▼ -1.13%
- Metro
- Los Angeles-Long Beach-Anaheim, CA
- State GDP YoY
- ▲ 3.21%
- F500 in state
- 116
Industry mix (Fortune 500 HQ in CA)
| Industry | F500 HQs | Revenue |
|---|---|---|
| Technology | 27 | $1,492B |
|
||
| Financial Services | 3 | $174B |
|
||
| Retail | 3 | $44B |
|
||
| Insurance | 3 | $26B |
|
||
| Media / Entertainment | 2 | $115B |
|
||
| Pharmaceuticals / Biotech | 2 | $62B |
|
||
Price history
+1160.7% since first listed13 events — show timeline
- 2026-05-19 Listed $1,349,000 CRMLS
- 2018-05-03 Sold (Public Records) $1,150,000 Public Records
- 2017-10-13 Listing Removed — SDMLS
- 2017-10-13 Listing Removed — CRMLS
- 2017-07-13 Relisted — CRMLS
- 2017-07-13 Contingent — CRMLS
- 2017-04-18 Price Changed $1,265,000 CRMLS
- 2017-03-20 Listed $1,325,000 CRMLS
- 2017-03-16 Listed $1,265,000 SDMLS
- 2007-06-20 Listing Removed — CRMLS
- 2006-06-20 Listed $1,350,000 CRMLS
- 2003-04-09 Sold (Public Records) $550,000 Public Records
- 1977-09-15 Sold (Public Records) $107,000 Public Records
Property tax history
+2.8%/yrLatest (2025): $16,230 · +1.2% YoY. Source: county tax records.
Cash-flow waterfall
monthlySold comps — $/sqft
last 12 mo · ≤1 miLoading sold comps…