 Triplex
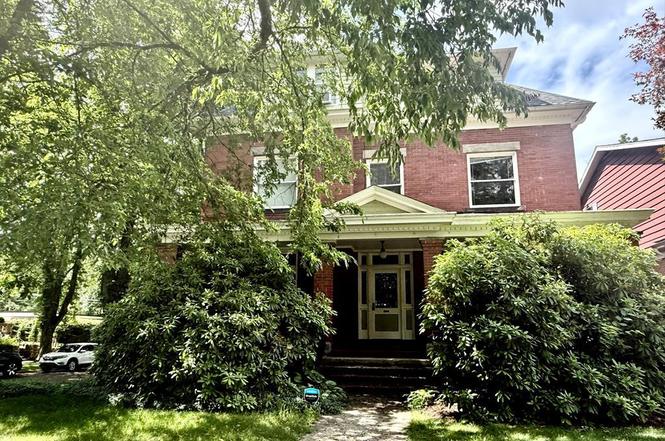
638 Luzerne St · Westmont, PA
Flood risk 1/10 · Minimal
- FEMA flood zone
- X (unshaded)
- Chance of flooding over 30 yrs
- 0.0%
- Est. flood insurance / yr
- $507 – $1,088
Fire risk 1/10 · Minimal
- Est. fire insurance / yr
- $511 – $949
Heat risk 3/10 · Minor
- Hot days now (above 96°F)
- 6 days/yr
- Hot days in 30 yrs
- 14 days/yr
Wind risk 2/10 · Minimal
- Chance of severe wind over 30 yrs
- —
Air-quality risk 2/10 · Minimal
- Unhealthy air days now
- 1 days/yr
- Unhealthy air days in 30 yrs
- 2 days/yr
Risk factors via First Street. Map © Google.
Why this score? — see what drove the B grade
The composite is a weighted blend of 9 inputs, each scored 0–100. Each bar is that input's sub-score; the figure is the points it added to the 100-point composite (weight × sub-score).
- Cash flow +30.0/30.0
- 1% rule +10.0/10.0
- DSCR +10.0/10.0
- ARV discount +9.2/15.0
- Livability +4.1/5.0
- Schools +3.9/10.0
- Rent growth +2.5/5.0
- Condition / age +2.5/5.0
- Appreciation +0.0/10.0
$252,500
🖨 Deal sheet 📄 Offer letter ✓ Due diligence
Multi-family units
County records classify this as Multi-Family (2-4 Unit). Listing-text estimate: 3 units. confirmed
Listing remarks MLS
YOU WON'T FIND A NICER MULT-UNIT than this brick 3-story. Located on a corner lot on historic Luzerne Street in Westmont, this beautiful home features 3 separate apartments. Old-world charm with all of the modern conveniences of today. Beautiful woodwork stained and beveled glass windows/doors. Gorgeous newly updated kitchens with all newer appliances. Enclosed sunroom access in rear for all 3 floors. Full basement with laundry facilities. Large 3 car detached garage. Just steps away from Stackhouse Park and trails.
Key facts
- Historic westmont
- Updated kitchens
- Original woodwork
Tags
Property features AI
Finance
- Other:
- Financial info:
- HOA & community:
Exterior
- Parking: Detached concrete parking
- Security: Security system
- Utilities: Cable available; Public sewer
- Home design: Residential income property; Multi-family; 3 stories
- Construction: Brick and frame construction; Shingle roof
- Exterior features: Covered porch; Corner lot
Interior
- Kitchen: Dishwasher; Disposal; Range/Oven; Refrigerator
- Bedrooms:
- Flooring: Hardwood; Carpet; Ceramic tile; Wood
- Bathrooms:
- Heating & cooling: Natural gas heating; Hot water heating; Ceiling fans; Window air conditioning
- Interior features: Eat-in kitchen; Entrance foyer; Full basement
- Laundry & utility: Washer; Dryer
Neighborhood map
What this means for you Summary
Snapshot
- This is a 3 × 3-bed/1.5-bath units multifamily listed at $252k.
Deal economics
- At list price, monthly cash flow is $1k ($16k/yr) — positive. Per door: $436/mo.
- The deal already cash-flows at list — no discount required.
- Meets the 1% rule at list price ($4k rent vs $252k).
Location & tenants
- Location reads 82/100 on livability (#144 in PA, #1,167 nationally) — a professional / high-income tenant draw. Strengths: cost of living A+, housing A+, crime A; Watch: amenities F.
- Westmont Hilltop SD (suburban): math 39% / reading 51% proficiency, ranked #252 of 539 in PA (top 47%) — families likely to look elsewhere, expect single-tenant / working-renter base with shorter leases.
- Market conditions: 92 active listings in the ZIP; 64 units permitted in Cambria County in 2024 (0 in 5+ unit buildings).
- At $3,929/mo this rent would consume 68% of the median local household income ($69k/yr) (locally 359% of renters already pay >50% of income on rent) — very limited rent-growth headroom before tenants either downsize or default.
Forward outlook
- Local home prices are declining (-3.0%/yr); year-one equity from $2k of loan paydown is wiped out by about $8k of value loss. Plan a longer hold.
- Cambria County population projected at -28% by 2050 — secular population decline; favor cash flow + early exit over multi-decade hold.
- At projected returns (-3.0% appreciation + 3.0% rent growth), your $71k cash investment doubles in ~6 years — after that, you're playing with house money.
Negotiation context
- Only 2 days on market — expect competitive offers; lowballing is unlikely to land.
- Current owner paid $215k; 17% above their basis — modest negotiation headroom, anchor on the comps not their cost.
Questions for the listing agent
- Can we see the unit-by-unit rent roll, current vacancy, and any below-market leases? What's the average tenancy length?
- What capital expenditures (roof, boiler, parking lot, exteriors) have been made in the last 5 years, and what's planned in the next 2?
- Is there a deadline driving the sale (1031 exchange, divorce, estate, relocation)? That informs how much negotiation room exists.
- Schools are B-rated — typically a magnet for longer-tenancy family renters. What's the average tenant stay here, and is there a school-zone premium baked into asking?
- What's the average days-on-market for RENTAL listings here right now (not sales)? A rising rental-DOM trend means longer vacancies and softer asking-rent achievability than the comps imply.
- What's the recent tenant-quality profile in this submarket — average credit score on applications, eviction rate, late-payment / NSF rate, and stable-employment percentage? A property-management company in the area should have these aggregated.
- How much new apartment / multifamily construction is in the pipeline within 1–3 miles? Heavy new supply (>2% of stock underway) typically softens rents 12–24 months out; light construction supports rent growth.
Investment metrics
- 1% rule
- 1.56% ✓
- Cap rate
- 12.52%
- Cash-on-cash
- 22.22%
- DSCR
- 1.99
- GRM
- 5.4
CMA / ARV
- ARV (on-the-fly)
- $262,528
- Comps found
- 2
Show comp detail 2 sales within ~0.75 mi
| Address | Dist | Beds/Ba | Sqft | Sold | Price | $/sf | Match |
|---|---|---|---|---|---|---|---|
| 508 Luzerne St | 0.13mi | 9/5.0 | 4,919 (+5%) | 10mo | $275,000 | $56 | 78 |
| 304 State St | 0.72mi | 8/4.0 | 5,140 (+10%) | 15mo | $265,800 | $52 | 38 |
Match score weights: distance 35% · size 25% · config 20% · recency 20%. Top-matched comps best support the ARV.
Projected returns pro-forma
-3.0% appreciation · 3.0% rent growth · sell at horizon
- IRR
- 15.0%
- Equity multiple
- 1.60×
- Total profit
- $42,561
- Equity at exit
- $37,649
- IRR
- 23.7%
- Equity multiple
- 3.05×
- Total profit
- $144,800
- Equity at exit
- $21,832
Cash invested: $70,700 (down + closing). Projections, not guarantees.
Landlord ↔ Tenant lean methodology
- Overall (STATE)
- 62 Landlord-Friendly
- State Pennsylvania
- 62 Landlord-Friendly · EVEN
- County
- — inherits STATE
- City
- — inherits STATE
ZIP-level market 15905
- Home prices YoY
- -31.1%
- Active inventory
- 92
- Price-to-rent
- 16.1×
Monthly cashflow live
- Estimated rent
- $3,929 medium interval (Pro) →
- Mortgage (P&I)
- −$1,324
- Tax from tax record
- −$365 /mo · $4,384/yr
- Insurance
- −$105
- HOA
- −$0
- Vacancy / Maint / Mgmt
- −$825
- Net cashflow
- $1,309
Break-even live
3-unit breakdown (identical units grouped — click to expand)
| Units | Beds | Baths | Est. rent |
|---|---|---|---|
| 3× units | 3 | 1.5 | $3,930 |
| #1 | 3 | 1.5 | $1,310 |
| #2 | 3 | 1.5 | $1,310 |
| #3 | 3 | 1.5 | $1,310 |
| Total (3 units) | $3,929 | ||
UW: 25.0% down · 7.5% · 30yr · 1.5% tax · 5.0% vac · 8.0% maint · 8.0% mgmt
Financing live
Cash to close
- Down payment
- $63,125
- Closing costs
- $7,575
- Reserves months
- —
- Total cash needed
- —
Loan-product check · same deal, 3 products live
Conventional
25% down · 7.5% · 30yr
- Down + closing
- —
- Monthly P&I
- —
- Monthly cashflow
- —
- DSCR
- —
- Eligible?
- —
Personal DTI + credit; lowest rate.
DSCR
20% down · 8.5% · 30yr
- Down + closing
- —
- Monthly P&I
- —
- Monthly cashflow
- —
- DSCR
- —
- Eligible?
- —
No personal income docs; deal must DSCR.
Hard money
10% down · 12.0% · 12mo
- Down + closing
- —
- Monthly P&I
- —
- Monthly cashflow
- —
- DSCR
- —
- Eligible?
- —
Short-term bridge; refi at stabilization.
Listing history 3 events
-
2026-06-19days on market $252,500 Active 2 DOM
-
2026-06-17remarks 699-char remark
-
2026-06-17$252,500 Active 1 DOM
ⓘ Source: listings_history table (triggers on properties + properties_extension) + one-shot
backfill from property_details.listing_events for pre-trigger history.
Tax reassessment forecast PA · Partial reset (capped growth)
- Current annual tax
- $4,384 · $365/mo
- Projected year-2 tax
- $4,384 · $365/mo
- Expected delta
- $0/yr ($0/mo · 0.0%)
ⓘ Screening estimate from a state-policy table — verify with the county assessor before closing.
Climate risk First Street
- Flood 1/10 Low FEMA zone X (unshaded) · 0% chance over 30 yrs
- Wildfire 1/10 Low
- Heat 3/10 Moderate 6 d/yr ≥96°F today · 14 d/yr by 30 yrs out
- Wind 2/10 Low
- Air quality 2/10 Low 1 unhealthy d/yr today · 2 by 30 yrs out
Nearby sold comps map
Loading sold comps map…
Walkable amenities ~0.75 mi
Loading nearby amenities…
Taxation est. · year 1
- Rental income
- $47,148
- − Mortgage interest
- −$14,144
- − Property taxes
- −$4,384
- − Insurance
- −$1,262
- − Repairs & maintenance
- −$3,772
- − Management
- −$3,772
- − Depreciation
- −$7,345
- Taxable income
- $12,469
- Est. tax owed @ 24.0%
- −$2,992
- After-tax cash flow
- $12,719/yr
For passive investors: Depreciation is non-cash, so a rental often shows a tax loss while cash-flowing — sheltering income. Rental losses are passive: they offset passive income freely, and up to $25,000/yr can offset ordinary (W-2) income if you actively participate and your MAGI is under $100k (phasing out to $0 by $150k); unused losses carry forward. On sale, claimed depreciation is recaptured at up to 25%, and gains may owe capital-gains tax (a 1031 exchange can defer both). Figures are a year-1 estimate at your 24.0% rate — not tax advice; consult a CPA.
Schools (NCES district)
- District
- Westmont Hilltop SD
- NCES district ID
- 4226130
- Math proficiency
- 39% ▼ -10.00%
- Reading proficiency
- 51% ▼ -15.00%
- Median HH income
- $59,325
- Composite
- 39.49/100
- National rank
- #3955
- State rank
- #252 of 539 in PA
Livability — Westmont
- Score
- 82/100
- State rank
- #144
- US rank
- #1167
Category grades
Schools grade is shown separately in the Schools card above.
Census & demographics
- Census place
- Westmont, PA
- County
- Cambria County · 30,791 people
- City population
- 30,791
- Metro
- Johnstown, PA
- Population (ZIP)
- 19,329
- Household income
- $69,212
- Rent vs Own
- Severe rent burden
- 359.0
Population outlook (Cambria County) Hauer SSP2
- Today (2025)
- 122,754 people
- By 2030
- 115,827 · -5.6%
- By 2040
- 101,309 · -17.5%
- By 2050
- 88,379 · -28.0%
- By 2075
- 65,237 · -46.9%
- By 2100
- 46,909 · -61.8%
Race, ethnicity, and origin ACS 2023
- Neighborhood character
- Predominantly White (92%)
- Race & ethnicity
- White 92% Two or more races 3% Hispanic / Latino 2% Black 2%
- Common ancestry
- Romanian 7% Scotch-Irish 1% Italian 1%
- Foreign-born
- 2% · Canada
- Languages at home
- 96% English-only · Spanish 1%
Political lean MEDSL · Cambria
- 2024 margin
- Solid R (+39.7) · D 29.8% · R 69.5%
- 2008→2024 swing
- -40.4pp toward R · 2008: 0.7pp · 2024: -39.7pp
- All cycles
- 2024: R+39.7 2020: R+37.3 2016: R+37.8 2012: R+17.8 2008: D+0.7
Not yet ingested
- Civics
- —
Market trends
- HPI YoY
- ▼ -64.18%
- Current HPI
- 142.5218
- Rent YoY
- —
- Metro
- Johnstown, PA
- State GDP YoY
- ▲ 1.68%
- F500 in state
- 34
Industry mix (Fortune 500 HQ in PA)
| Industry | F500 HQs | Revenue |
|---|---|---|
| Healthcare | 2 | $309B |
|
||
| Insurance | 2 | $27B |
|
||
| Telecommunications / Media | 1 | $124B |
|
||
| Industrial Distribution | 1 | $22B |
|
||
| Financial Services | 1 | $20B |
|
||
| Chemicals / Materials | 1 | $18B |
|
||
Price history
+271.3% since first listed5 events — show timeline
- 2026-06-17 Listed $252,500 CSMLS
- 2022-03-21 Sold (Public Records) $215,000 Public Records
- 2022-03-17 Sold (MLS) $215,000 CSMLS
- 1987-05-01 Sold (Public Records) $76,000 Public Records
- 1985-03-01 Sold (Public Records) $68,000 Public Records
Property tax history
+0.6%/yrLatest (2026): $4,384 · +0.0% YoY. Source: county tax records.
Cash-flow waterfall
monthlySold comps — $/sqft
last 12 mo · ≤1 miLoading sold comps…