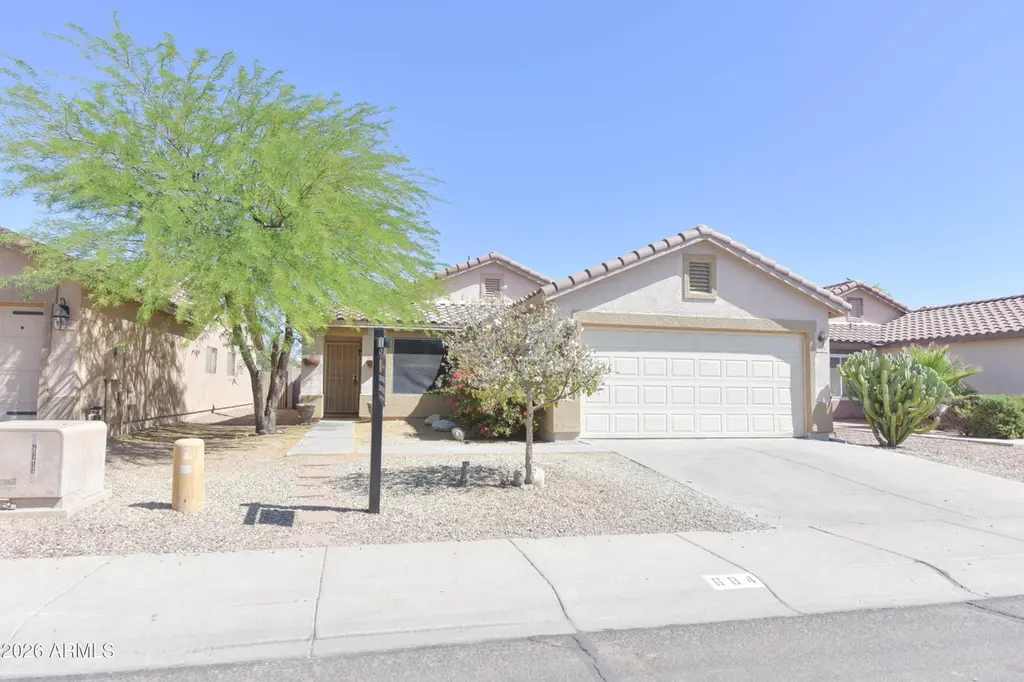
684 W Jardin Dr · Casa Grande, AZ
Flood risk 1/10 · Minimal
- FEMA flood zone
- X (unshaded)
- Chance of flooding over 30 yrs
- 0.0%
- Est. flood insurance / yr
- $507 – $1,088
Fire risk 6/10 · Moderate
- Est. fire insurance / yr
- $610 – $1,132
Heat risk 9/10 · Severe
- Hot days now (above 113°F)
- 7 days/yr
- Hot days in 30 yrs
- 18 days/yr
Wind risk 1/10 · Minimal
- Chance of severe wind over 30 yrs
- —
Air-quality risk 2/10 · Minimal
- Unhealthy air days now
- 1 days/yr
- Unhealthy air days in 30 yrs
- 1 days/yr
Risk factors via First Street. Map © Google.
Why this score? — see what drove the D grade
The composite is a weighted blend of 9 inputs, each scored 0–100. Each bar is that input's sub-score; the figure is the points it added to the 100-point composite (weight × sub-score).
- Cash flow +14.6/30.0
- ARV discount +9.9/15.0
- DSCR +4.5/10.0
- Rent growth +3.7/5.0
- 1% rule +3.2/10.0
- Livability +2.9/5.0
- Condition / age +2.5/5.0
- Schools +1.5/10.0
- Appreciation +0.0/10.0
$269,900
🖨 Deal sheet (PDF) 📄 Offer letter ✓ Due diligence
Listing remarks
Wow, a great find! Newly updated in 2026. This floorplan features 3 bedrooms, 2 bathrooms, an office and great room. New plush carpet just installed in all 3 bedrooms. Ceramic wood-texture tile everywhere else. Fresh interior paint throughout. Kitchen includes new white quartz countertops, white cabinets and all appliances. This home has been well maintained and is move-in ready. A must see!
Key facts
- 4,951 sq ft lot
- 2 garage spots
- Built 2001
Neighborhood map
What this means for you Summary
Snapshot
- This is a 3-bed/2.0-bath single-family listed at $270k.
Deal economics
- At list price, monthly cash flow is $67 ($798/yr) — positive.
- The deal already cash-flows at list — no discount required.
- To meet the 1% rule (rent ≥ 1% of price), the offer needs to be $221k (18.1% below list).
- Recommended offer: $221k (18.1% below list) — sets the bar for 1% rule.
- Cap rate 6.6% vs local median 4.0% in Casa Grande — top-decile yield for the area; either an underpriced asset or a hidden risk that comps aren't pricing in. Stress-test before assuming the spread holds.
Location & tenants
- Location reads 58/100 on livability (#220 in AZ) — a working-class tenant base; expect higher turnover. Strengths: cost of living A+, housing A+; Watch: crime D+, employment D+, amenities F.
- Casa Grande Union High School District (4453) (suburban): math 14% / reading 21% proficiency, ranked #193 of 249 in AZ (top 78%) — low school quality limits family demand, transient renter base, plan for 1-2y turnover.
- Zoned schools: Cottonwood Elementary School (math 8% / reading 8%, grade F, #1,056 of 1,109 statewide, top 96%, 451 students, 89% FRL); Casa Grande Middle School (math 7% / reading 12%, grade F, #197 of 218 statewide, top 91%, 645 students, 84% FRL); Casa Grande Union High School (math 18% / reading 25%, grade F, #217 of 381 statewide, top 57%, 2,132 students, 52% FRL).
- Market conditions: Rents rising fast (+4.6%/yr); 632 active listings in the ZIP; 20 comparable units currently listed for rent nearby; rentals at typical pace (median 27d on market — plan ~3-4 weeks tenant-placement turnaround); 9,504 units permitted in Pinal County in 2024 (776 in 5+ unit buildings).
- This rent runs 39% of the median local income ($68k/yr) — at the standard rent-burdened threshold; future hikes will face affordability resistance.
Forward outlook
- Local home prices are declining (-3.0%/yr); year-one equity from $2k of loan paydown is wiped out by about $8k of value loss. Plan a longer hold.
Negotiation context
- Only 11 days on market — expect competitive offers; lowballing is unlikely to land.
- 2 sale attempts since 19y ago with the ask held roughly flat each time — persistent listings suggest the price (not the market) is what's stuck; bring a comps-based counter.
- Current owner paid $125k; list at $270k implies a 116% gain — meaningful room to come down on a strong offer.
Risks & watch-outs
- Climate carrying-cost: major wildfire risk; extreme-heat days projected 7→18/yr by 2055 (HVAC capex compounding) — expect insurance premiums to compound above CPI over the hold.
Questions for the listing agent
- What does the HOA fee cover, when was the last increase, and are there any pending special assessments or reserve-fund shortfalls?
- Is there a deadline driving the sale (1031 exchange, divorce, estate, relocation)? That informs how much negotiation room exists.
- Schools are F-rated, which usually means shorter tenancies and higher turnover. Who's the typical renter profile here, and what's been the actual vacancy rate?
- Crime grade is D in this area — have there been break-ins, vandalism, or insurance claims at this property in the last 3 years? What carrier currently insures it and at what premium?
- The area grade is low — what's the realistic commute time and amenity access for the typical tenant pool here? Any planned neighborhood developments (good or bad) we should know about?
- What's the average days-on-market for RENTAL listings here right now (not sales)? A rising rental-DOM trend means longer vacancies and softer asking-rent achievability than the comps imply.
- What's the recent tenant-quality profile in this submarket — average credit score on applications, eviction rate, late-payment / NSF rate, and stable-employment percentage? A property-management company in the area should have these aggregated.
- How much new for-sale + rental construction is in the pipeline within 1–3 miles? Heavy new supply typically softens prices + rents 12–24 months out; constrained supply supports both.
Investment metrics
- 1% rule
- 0.82% ✗
- Cap rate
- 6.59%
- Cash-on-cash
- 1.06%
- DSCR
- 1.05
- GRM
- 10.2
CMA / ARV
- ARV (on-the-fly)
- $285,008
- Comps found
- 12
Show comp detail 12 sales within ~0.75 mi
| Address | Dist | Beds/Ba | Sqft | Sold | Price | $/sf | Match |
|---|---|---|---|---|---|---|---|
| 684 W Jardin Dr | 0.00mi | 3/2.0 | 1,517 (+0%) | 1mo | $266,000 | $175 | 99 |
| 667 W Jardin Dr | 0.05mi | 3/2.0 | 1,516 (0%) | 2mo | $260,000 | $172 | 96 |
| 771 W Fairlane Ct | 0.24mi | 3/2.0 | 1,489 (-2%) | 2mo | $260,000 | $175 | 84 |
| 659 W Jahns Ct | 0.32mi | 3/2.0 | 1,548 (+2%) | 0mo | $277,900 | $180 | 81 |
| 727 W Judi Dr | 0.23mi | 4/2.0 (+1) | 1,569 (+4%) | 1mo | $296,000 | $189 | 77 |
| 592 W Gabrilla Ct | 0.48mi | 3/2.0 | 1,569 (+4%) | 2mo | $310,000 | $198 | 70 |
| 669 W Silver Reef Ct | 0.27mi | 3/2.0 | 1,384 (-9%) | 4mo | $260,000 | $188 | 69 |
| 2127 N Nancy Ln | 0.56mi | 3/2.0 | 1,550 (+2%) | 3mo | $337,000 | $217 | 68 |
| 2041 N Thunderbird Ave | 0.35mi | 4/2.0 (+1) | 1,613 (+6%) | 3mo | $268,900 | $167 | 66 |
| 2140 N Nancy Ln | 0.60mi | 3/2.0 | 1,597 (+5%) | 0mo | $240,000 | $150 | 63 |
| 2145 N Nancy Ln | 0.59mi | 4/2.0 (+1) | 1,423 (-6%) | 4mo | $329,000 | $231 | 54 |
| 2122 N Sweetwater Dr | 0.53mi | 3/2.0 | 1,330 (-12%) | 2mo | $305,000 | $229 | 53 |
Match score weights: distance 35% · size 25% · config 20% · recency 20%. Top-matched comps best support the ARV.
Projected returns pro-forma
-3.0% appreciation · 4.6% rent growth · sell at horizon
- IRR
- -13.0%
- Equity multiple
- 0.52×
- Total profit
- $-35,964
- Equity at exit
- $40,243
- IRR
- -2.0%
- Equity multiple
- 0.86×
- Total profit
- $-10,861
- Equity at exit
- $23,336
Cash invested: $75,572 (down + closing). Projections, not guarantees.
Landlord ↔ Tenant lean methodology
- Overall (STATE)
- 87 Strongly Landlord-Friendly
- State Arizona
- 87 Strongly Landlord-Friendly · R+3
- County
- — inherits STATE
- City
- — inherits STATE
ZIP-level market 85122
- Home prices YoY
- -22.4%
- Rents YoY
- 4.6%
- Active inventory
- 632
- Price-to-rent
- 10.2×
Monthly cashflow live
- Estimated rent
- $2,211 high interval (Pro) →
- Mortgage (P&I)
- −$1,415
- Tax from tax record
- −$111 /mo · $1,331/yr
- Insurance
- −$112
- HOA
- −$41
- Vacancy / Maint / Mgmt
- −$464
- Net cashflow
- $67
Break-even live
Sensitivity live
| Price | -10% $219 | -5% $143 | +0% $67 | +5% $-10 | +10% $-86 |
|---|---|---|---|---|---|
| Rent | -10% $-108 | -5% $-21 | +0% $67 | +5% $154 | +10% $241 |
| Rate | -1.0pp $202 | -0.5pp $135 | base $67 | +0.5pp $-3 | +1.0pp $-75 |
UW: 25.0% down · 7.5% · 30yr · 1.5% tax · 5.0% vac · 8.0% maint · 8.0% mgmt
Financing live
Cash to close
- Down payment
- $67,475
- Closing costs
- $8,097
- Reserves months
- —
- Total cash needed
- —
Loan-product check · same deal, 3 products live
Conventional
25% down · 7.5% · 30yr
- Down + closing
- —
- Monthly P&I
- —
- Monthly cashflow
- —
- DSCR
- —
- Eligible?
- —
Personal DTI + credit; lowest rate.
DSCR
20% down · 8.5% · 30yr
- Down + closing
- —
- Monthly P&I
- —
- Monthly cashflow
- —
- DSCR
- —
- Eligible?
- —
No personal income docs; deal must DSCR.
Hard money
10% down · 12.0% · 12mo
- Down + closing
- —
- Monthly P&I
- —
- Monthly cashflow
- —
- DSCR
- —
- Eligible?
- —
Short-term bridge; refi at stabilization.
Rent comps 20 comps
| Address | Beds | Baths | Sqft | Rent | $/sqft | DOM | Units | Dist |
|---|---|---|---|---|---|---|---|---|
| 645 W Jardin Dr Casa Grande, AZ | 3.0 | 2.0 | 1309 | $1,650 | $1.26 | 26d | 1 | 0.11mi |
| 736 W Palo Verde Dr Casa Grande, AZ | 3.0 | 2.0 | 1810 | $3,550 | $1.96 | 26d | 1 | 0.15mi |
| 803 W Jardin Dr Casa Grande, AZ | 3.0 | 2.0 | 1491 | $1,725 | $1.16 | 6d | 1 | 0.22mi |
| 776 W Fairlane Ct Casa Grande, AZ | 3.0 | 2.0 | 1489 | $3,200 | $2.15 | 26d | 1 | 0.25mi |
| 520 W Casa Mirage Ct Casa Grande, AZ | 3.0 | 2.0 | 1536 | $1,600 | $1.04 | 6d | 1 | 0.29mi |
| 750 W Torino Pl Casa Grande, AZ | 3.0 | 2.0 | 2007 | $3,000 | $1.49 | 1d | 1 | 0.32mi |
| 845 W Crooked Stick Dr Casa Grande, AZ | 3.0 | 2.0 | 1601 | $2,000 | $1.25 | 26d | 1 | 0.35mi |
| 767 W Barrus Dr Casa Grande, AZ | 3.0 | 2.0 | 1463 | $1,695 | $1.16 | 26d | 1 | 0.44mi |
| 2094 N Sweetwater Dr Casa Grande, AZ | 3.0 | 2.0 | 1266 | $1,700 | $1.34 | 26d | 1 | 0.46mi |
| 1858 N Center Ave Casa Grande, AZ | 2.0 | 2.0 | 1146 | $1,500 | $1.31 | 26d | 1 | 0.78mi |
| 1846 N Princeton Ave Casa Grande, AZ | 4.0 | 2.0 | 1786 | $1,750 | $0.98 | 6d | 1 | 0.98mi |
| 1584 N Wood St Casa Grande, AZ | 4.0 | 2.0 | 1928 | $1,800 | $0.93 | 17d | 1 | 1.02mi |
| 2356 N Sand Hills Ct Casa Grande, AZ | 3.0 | 2.0 | 1209 | $1,995 | $1.65 | 17d | 1 | 1.19mi |
| 541 W Melrose Dr Casa Grande, AZ | 3.0 | 2.0 | 1101 | $1,600 | $1.45 | 26d | 1 | 1.24mi |
| 1640 N Cameron St Casa Grande, AZ | 3.0 | 2.0 | 1577 | $3,250 | $2.06 | 24d | 1 | 1.34mi |
| 1640 N Cameron St Casa Grande, AZ | 3.0 | 2.0 | 1577 | $3,250 | $2.06 | 26d | 1 | 1.34mi |
| 1640 N Cameron St Unit 1640 Casa Grande, AZ | 3.0 | 2.5 | 1577 | $3,250 | $2.06 | 26d | 1 | 1.34mi |
| 1926 N Avenida de Palmas Casa Grande, AZ | 2.0 | 2.0 | 1106 | $1,199 | $1.08 | 24d | 3 | 1.34mi |
| 1642 N Cameron St Casa Grande, AZ | 3.0 | 2.5 | 1577 | $3,250 | $2.06 | 26d | 1 | 1.34mi |
| 1775 N Terrace Cir Casa Grande, AZ | 3.0 | 2.0 | 1628 | $1,699 | $1.04 | 17d | 1 | 1.45mi |
HOA detail
- Monthly dues
- $41 · $492/yr
Listing history 5 events
-
2026-04-22status Pending
-
2026-04-11$269,900 Active
-
2019-10-11soldstatus $125,000
-
2008-02-20historical
-
2007-09-14$137,000
ⓘ Source: listings_history table (triggers on properties + properties_extension) + one-shot
backfill from property_details.listing_events for pre-trigger history.
Tax reassessment forecast AZ · Resets to sale price
- Current annual tax
- $1,331 · $111/mo
- Projected year-2 tax
- $1,781 · $148/mo
- Expected delta
- +$450/yr (+$37/mo · 33.8%)
ⓘ Screening estimate from a state-policy table — verify with the county assessor before closing.
Climate risk First Street
- Flood 1/10 Low FEMA zone X (unshaded) · 0% chance over 30 yrs
- Wildfire 6/10 Major
- Heat 9/10 Extreme 7 d/yr ≥113°F today · 18 d/yr by 30 yrs out
- Wind 1/10 Low
- Air quality 2/10 Low 1 unhealthy d/yr today · 1 by 30 yrs out
Nearby sold comps map
Loading sold comps map…
Walkable amenities ~0.75 mi
Loading nearby amenities…
Taxation est. · year 1
- Rental income
- $26,526
- − Mortgage interest
- −$15,119
- − Property taxes
- −$1,331
- − Insurance
- −$1,350
- − Repairs & maintenance
- −$2,122
- − Management
- −$2,122
- − HOA
- −$492
- − Depreciation
- −$7,852
- Taxable loss
- −$3,861
- Est. tax savings @ 24.0%
- +$927
- After-tax cash flow
- $1,725/yr
For passive investors: Depreciation is non-cash, so a rental often shows a tax loss while cash-flowing — sheltering income. Rental losses are passive: they offset passive income freely, and up to $25,000/yr can offset ordinary (W-2) income if you actively participate and your MAGI is under $100k (phasing out to $0 by $150k); unused losses carry forward. On sale, claimed depreciation is recaptured at up to 25%, and gains may owe capital-gains tax (a 1031 exchange can defer both). Figures are a year-1 estimate at your 24.0% rate — not tax advice; consult a CPA.
Schools (NCES district)
- District
- Casa Grande Union High School District (4453)
- NCES district ID
- 0401740
- Math proficiency
- 14% ▼ -15.00%
- Reading proficiency
- 21% ▼ -10.00%
- Median HH income
- $45,373
- Composite
- 15.38/100
- National rank
- #9319
- State rank
- #193 of 249 in AZ
Livability — Casa Grande
- Score
- 58/100
- State rank
- #220
- US rank
- #21534
Category grades
Schools grade is shown separately in the Schools card above.
Census & demographics
- Census place
- Casa Grande, AZ
- County
- Pinal County · 399,947 people
- City population
- 69,701
- Metro
- Phoenix-Mesa-Chandler, AZ
- Population (ZIP)
- 61,624
- Household income
- $68,443
- Rent vs Own
- Severe rent burden
- 1250.0
Population outlook (Pinal County) Hauer SSP2
- Today (2025)
- 437,574 people
- By 2030
- 446,903 · +2.1%
- By 2040
- 452,589 · +3.4%
- By 2050
- 444,126 · +1.5%
- By 2075
- 430,300 · -1.7%
- By 2100
- 393,536 · -10.1%
Race, ethnicity, and origin ACS 2023
- Neighborhood character
- Diverse neighborhood (Simpson 0.63)
- Race & ethnicity
- Hispanic / Latino 44% White 42% Two or more races 21% Black 4% Native American 4% Asian 1%
- Hispanic origin (detail)
- Mexican 40%
- Common ancestry
- Lithuanian 1% Slovak 1% Portuguese 1%
- Foreign-born
- 12% · Canada
- Languages at home
- 75% English-only · Spanish 23% Tagalog/Filipino 1% Other Indo-European 1%
Political lean MEDSL · Pinal
- 2024 margin
- Strong R (+22.1) · D 38.5% · R 60.6%
- 2008→2024 swing
- -7.6pp toward R · 2008: -14.5pp · 2024: -22.1pp
- All cycles
- 2024: R+22.1 2020: R+17.3 2016: R+19.3 2012: R+17.1 2008: R+14.5
Not yet ingested
- Civics
- —
Market trends
- HPI YoY
- ▼ -67.32%
- Current HPI
- 233.148
- Rent YoY
- ▲ 4.60%
- Metro
- Phoenix-Mesa-Chandler, AZ
- State GDP YoY
- ▲ 4.54%
- F500 in state
- 20
Industry mix (Fortune 500 HQ in AZ)
| Industry | F500 HQs | Revenue |
|---|---|---|
| Technology | 2 | $13B |
|
||
| Mining / Metals | 1 | $23B |
|
||
| Environmental Services | 1 | $16B |
|
||
| Metals / Steel | 1 | $14B |
|
||
| Technology Distribution | 1 | $9B |
|
||
| Homebuilding | 1 | $8B |
|
||
Price history
+97.0% since first listed5 events — show timeline
- 2026-04-22 Pending — ARMLS
- 2026-04-11 Listed $269,900 ARMLS
- 2019-10-11 Sold (Public Records) $125,000 Public Records
- 2008-02-20 Listing Removed — ARMLS
- 2007-09-14 Listed $137,000 ARMLS
Property tax history
+0.2%/yrLatest (2025): $1,331 · +6.7% YoY. Source: county tax records.
Cash-flow waterfall
monthlySold comps — $/sqft
last 12 mo · ≤1 miLoading sold comps…