 Multi-family
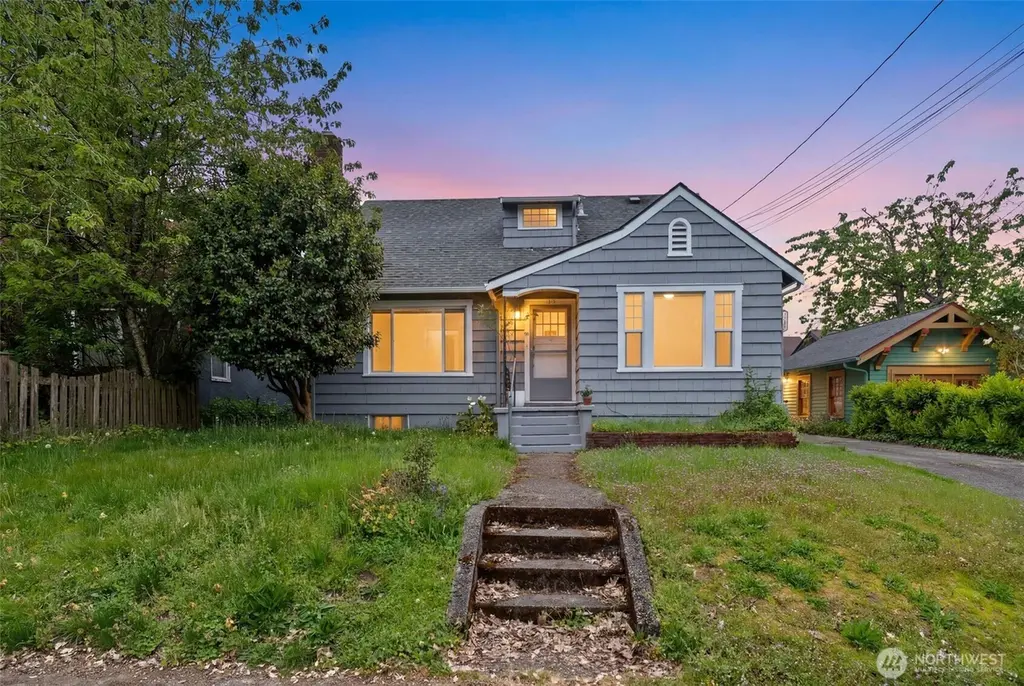
1813 Franklin St SE · Olympia, WA
Flood risk No data
- FEMA flood zone
- —
- Chance of flooding over 30 yrs
- —
- Est. flood insurance / yr
- —
Fire risk No data
- Est. fire insurance / yr
- —
Heat risk No data
- Hot days now (above threshold)
- —
- Hot days in 30 yrs
- —
Wind risk No data
- Chance of severe wind over 30 yrs
- —
Air-quality risk No data
- Unhealthy air days now
- —
- Unhealthy air days in 30 yrs
- —
Risk factors via First Street. Map © Google.
Why this score? — see what drove the D- grade
The composite is a weighted blend of 9 inputs, each scored 0–100. Each bar is that input's sub-score; the figure is the points it added to the 100-point composite (weight × sub-score).
- ARV discount +11.0/15.0
- Cash flow +7.8/30.0
- Schools +6.2/10.0
- Livability +4.2/5.0
- Rent growth +3.5/5.0
- Condition / age +2.5/5.0
- 1% rule +1.9/10.0
- DSCR +1.9/10.0
- Appreciation +0.0/10.0
$549,900
🖨 Deal sheet (PDF) 📄 Offer letter ✓ Due diligence
Multi-family units
County records classify this as Multi-Family (2-4 Unit). Listing-text estimate: 1 unit. estimate disagrees with records
Listing remarks
Great Olympia investment opportunity featuring 2 tenant-occupied units plus a partially finished basement with future rental potential once completed! Charming property with strong income-producing possibilities in a convenient location near downtown Olympia, shopping, restaurants, parks, & I-5 access. Each unit offers functional living spaces with included appliances: refrigerator, stove, dishwasher, washer & dryer. Property features classic character, ample parking, & flexibility for investors or owner-occupants looking to offset expenses. Basement space provides additional upside opportunity for added income or expanded living area with an already finished third full size
Key facts
- Ample parking
- Expanded living area
- Included appliances
Tags
Property features AI
Finance
- Financial info: Gross scheduled income: $37,800/year; Gross adjusted income: $37,800/year; Total monthly income: $3,150; Actual rents: Unit M $1,750/month; Unit U $1,400/month; Net operating income: $25,840/year; Total expenses: $11,960/year; Fuel expense: $1,320/year; Insurance expense: $1,296/year; Gross rent multiplier: 14.5; Listing terms: Cash, Conventional, FHA, VA Loan
Exterior
- Parking: 2 uncovered parking spaces
- Security: Partially fenced
- Utilities: Electric and natural gas energy sources; Sewer connected; Water/sewer/garbage fee listed
- Home design: Duplex (Residential income, Multi Family); Has a view; 2 stories; Effective year built 1981; Entry level details not specified
- Construction: Wood construction; Composition roof; Poured concrete foundation; Effective year built 1981
- Exterior features: Partially fenced; Deck; Outbuildings; Cable TV available; High speed internet available; Gas available; Curbs; Paved; Sidewalk; Wood exterior/wood products
Interior
- Kitchen: Unit M: Range/Oven, Refrigerator, Dishwasher; Unit U: Range/Oven, Refrigerator, Dishwasher
- Bedrooms: Unit M: 2 bedrooms; Unit U: 1 bedroom
- Flooring: Laminate; Vinyl; Carpet
- Bathrooms: Unit M: 1 bathroom; Unit U: 1 bathroom
- Heating & cooling: Forced air heating; No cooling
- Interior features: Basement; Laminate flooring; Vinyl flooring; Carpet flooring; Has heating (Forced Air); No central cooling
- Laundry & utility: Unit M: Washer and dryer included; Unit U: Washer and dryer included
Neighborhood map
What this means for you Summary
Snapshot
- This is a 3-bed/3.0-bath multifamily listed at $550k.
Deal economics
- At list price, monthly cash flow is $-603 ($-7k/yr) — negative.
- To cash-flow at today's rent, offer at most $443k (19.4% below list).
- To meet the 1% rule (rent ≥ 1% of price), the offer needs to be $378k (31.2% below list).
- Recommended offer: $378k (31.2% below list) — sets the bar for 1% rule.
- Cap rate 5.0% vs local median 2.4% in Olympia — top-decile yield for the area; either an underpriced asset or a hidden risk that comps aren't pricing in. Stress-test before assuming the spread holds.
Location & tenants
- Location reads 83/100 on livability (#58 in WA, #1,036 nationally) — a professional / high-income tenant draw. Strengths: amenities A+, commute A+, health & safety A+; Watch: crime F, cost of living D-.
- Olympia School District (urban): math 66% / reading 75% proficiency, ranked #17 of 291 in WA (top 6%) — strong family-tenant draw, lease renewals of 3-5y typical.
- Market conditions: Rents rising (+3.9%/yr); 301 active listings in the ZIP; 2 comparable units currently listed for rent nearby; solid renter incomes; 1,222 units permitted in Thurston County in 2024 (508 in 5+ unit buildings).
- At $3,783/mo this rent would consume 47% of the median local household income ($97k/yr) (locally 1653% of renters already pay >50% of income on rent) — very limited rent-growth headroom before tenants either downsize or default.
Forward outlook
- Local home prices are declining (-3.0%/yr); year-one equity from $4k of loan paydown is wiped out by about $16k of value loss. Plan a longer hold.
- Thurston County population projected at +27% by 2050 — long-run rental-demand tailwind backs the buy-and-hold thesis.
Negotiation context
- It's been on market 20 days — a 2% lower offer ($542k) is reasonable based on typical stale-listing flexibility.
- 2 sale attempts with the ask held roughly flat each time — persistent listings suggest the price (not the market) is what's stuck; bring a comps-based counter.
Risks & watch-outs
- Watch-outs: built in 1926 — expect roof / HVAC / electrical / plumbing capex.
Questions for the listing agent
- What do current leases actually rent for vs. the listed asking? Can we see a recent rent roll and the last 12 months of T-12 income?
- Built in 1926 — when were the roof, HVAC, electrical panel, plumbing, and water heater last replaced?
- Is there a deadline driving the sale (1031 exchange, divorce, estate, relocation)? That informs how much negotiation room exists.
- Schools are A-rated — typically a magnet for longer-tenancy family renters. What's the average tenant stay here, and is there a school-zone premium baked into asking?
- Crime grade is F in this area — have there been break-ins, vandalism, or insurance claims at this property in the last 3 years? What carrier currently insures it and at what premium?
- The area grade is low — what's the realistic commute time and amenity access for the typical tenant pool here? Any planned neighborhood developments (good or bad) we should know about?
- What's the average days-on-market for RENTAL listings here right now (not sales)? A rising rental-DOM trend means longer vacancies and softer asking-rent achievability than the comps imply.
- What's the recent tenant-quality profile in this submarket — average credit score on applications, eviction rate, late-payment / NSF rate, and stable-employment percentage? A property-management company in the area should have these aggregated.
- How much new apartment / multifamily construction is in the pipeline within 1–3 miles? Heavy new supply (>2% of stock underway) typically softens rents 12–24 months out; light construction supports rent growth.
Investment metrics
- 1% rule
- 0.69% ✗
- Cap rate
- 4.98%
- Cash-on-cash
- -4.70%
- DSCR
- 0.79
- GRM
- 12.1
CMA / ARV
- ARV (median comp)
- $596,954
- List price
- $549,900
- Delta
- -7.88%
- Verdict
- FAIR
- Comps
- 5 within 1.0 mi
Projected returns pro-forma
-3.0% appreciation · 3.89% rent growth · sell at horizon
- IRR
- -23.4%
- Equity multiple
- 0.19×
- Total profit
- $-124,162
- Equity at exit
- $81,992
- IRR
- -16.1%
- Equity multiple
- 0.07×
- Total profit
- $-143,573
- Equity at exit
- $47,545
Cash invested: $153,972 (down + closing). Projections, not guarantees.
Landlord ↔ Tenant lean methodology
- Overall (STATE)
- 28 Tenant-Leaning
- State Washington
- 28 Tenant-Leaning · D+8
- County
- — inherits STATE
- City
- — inherits STATE
ZIP-level market 98501
- Rents YoY
- 3.9%
- Active inventory
- 301
- Price-to-rent
- 24.2×
Monthly cashflow live
- Estimated rent
- $3,783 high interval (Pro) →
- Mortgage (P&I)
- −$2,884
- Tax from tax record
- −$479 /mo · $5,744/yr
- Insurance
- −$229
- HOA
- −$0
- Vacancy / Maint / Mgmt
- −$794
- Net cashflow
- $-603
Break-even live
Sensitivity live
| Price | -10% $-292 | -5% $-447 | +0% $-603 | +5% $-759 | +10% $-914 |
|---|---|---|---|---|---|
| Rent | -10% $-902 | -5% $-752 | +0% $-603 | +5% $-453 | +10% $-304 |
| Rate | -1.0pp $-326 | -0.5pp $-463 | base $-603 | +0.5pp $-745 | +1.0pp $-890 |
2-unit breakdown (identical units grouped — click to expand)
| Units | Beds | Baths | Est. rent |
|---|---|---|---|
| 2× units | 2 | 1 | $3,784 |
| #1 | 2 | 1 | $1,892 |
| #2 | 2 | 1 | $1,892 |
| Total (2 units) | $3,783 | ||
UW: 25.0% down · 7.5% · 30yr · 1.5% tax · 5.0% vac · 8.0% maint · 8.0% mgmt
Financing live
Cash to close
- Down payment
- $137,475
- Closing costs
- $16,497
- Reserves months
- —
- Total cash needed
- —
Loan-product check · same deal, 3 products live
Conventional
25% down · 7.5% · 30yr
- Down + closing
- —
- Monthly P&I
- —
- Monthly cashflow
- —
- DSCR
- —
- Eligible?
- —
Personal DTI + credit; lowest rate.
DSCR
20% down · 8.5% · 30yr
- Down + closing
- —
- Monthly P&I
- —
- Monthly cashflow
- —
- DSCR
- —
- Eligible?
- —
No personal income docs; deal must DSCR.
Hard money
10% down · 12.0% · 12mo
- Down + closing
- —
- Monthly P&I
- —
- Monthly cashflow
- —
- DSCR
- —
- Eligible?
- —
Short-term bridge; refi at stabilization.
Rent comps 2 comps
| Address | Beds | Baths | Sqft | Rent | $/sqft | DOM | Units | Dist |
|---|---|---|---|---|---|---|---|---|
| 407 N 5th Ave SW Unit A Tumwater, WA | 3.0 | 1.5 | 1650 | $2,250 | $1.36 | 44d | 1 | 1.10mi |
| 407 N 5th Ave SW Tumwater, WA | 3.0 | 1.5 | 1650 | $2,250 | $1.36 | 44d | 1 | 1.10mi |
Listing history 7 events
-
2026-06-18days on market $549,900 Active 20 DOM
-
2026-06-17days on market $549,900 Active 19 DOM
-
2026-06-16days on market $549,900 Active 18 DOM
-
2026-06-15days on market $549,900 Active 17 DOM
-
2026-06-14days on market $549,900 Active 15 DOM
-
2026-06-13status $549,900 Active 14 DOM
-
2026-05-07$549,900 Active
ⓘ Source: listings_history table (triggers on properties + properties_extension) + one-shot
backfill from property_details.listing_events for pre-trigger history.
Tax reassessment forecast WA · Resets to sale price
- Current annual tax
- $5,744 · $479/mo
- Projected year-2 tax
- $5,744 · $479/mo
- Expected delta
- $0/yr ($0/mo · 0.0%)
ⓘ Screening estimate from a state-policy table — verify with the county assessor before closing.
Nearby sold comps map
Loading sold comps map…
Walkable amenities ~0.75 mi
Loading nearby amenities…
Taxation est. · year 1
- Rental income
- $45,396
- − Mortgage interest
- −$30,803
- − Property taxes
- −$5,744
- − Insurance
- −$2,750
- − Repairs & maintenance
- −$3,632
- − Management
- −$3,632
- − Depreciation
- −$15,997
- Taxable loss
- −$17,160
- Est. tax savings @ 24.0%
- +$4,119
- After-tax cash flow
- $-3,117/yr
For passive investors: Depreciation is non-cash, so a rental often shows a tax loss while cash-flowing — sheltering income. Rental losses are passive: they offset passive income freely, and up to $25,000/yr can offset ordinary (W-2) income if you actively participate and your MAGI is under $100k (phasing out to $0 by $150k); unused losses carry forward. On sale, claimed depreciation is recaptured at up to 25%, and gains may owe capital-gains tax (a 1031 exchange can defer both). Figures are a year-1 estimate at your 24.0% rate — not tax advice; consult a CPA.
Schools (NCES district)
- District
- Olympia School District
- NCES district ID
- 5306180
- Math proficiency
- 66% ▼ -2.00%
- Reading proficiency
- 75% ▼ -2.00%
- Median HH income
- $63,852
- Composite
- 62.27/100
- National rank
- #1438
- State rank
- #17 of 291 in WA
Livability — Olympia
- Score
- 83/100
- State rank
- #58
- US rank
- #1036
Category grades
Schools grade is shown separately in the Schools card above.
Census & demographics
- Census place
- Olympia, WA
- County
- Thurston County · 269,345 people
- City population
- 98,428
- Metro
- Olympia-Lacey-Tumwater, WA
- Population (ZIP)
- 48,067
- Household income
- $97,198
- Rent vs Own
- Severe rent burden
- 1653.0
Population outlook (Thurston County) Hauer SSP2
- Today (2025)
- 308,239 people
- By 2030
- 326,483 · +5.9%
- By 2040
- 359,890 · +16.8%
- By 2050
- 391,800 · +27.1%
- By 2075
- 468,024 · +51.8%
- By 2100
- 519,890 · +68.7%
Race, ethnicity, and origin ACS 2023
- Neighborhood character
- Predominantly White (74%)
- Race & ethnicity
- White 74% Two or more races 11% Hispanic / Latino 9% Asian 5% Black 2% Pacific Islander 1%
- Hispanic origin (detail)
- Mexican 5% Puerto Rican 1%
- Common ancestry
- Portuguese 4% Lithuanian 4% Slovak 3%
- Foreign-born
- 6% · Canada, South Korea, China
- Languages at home
- 90% English-only · Spanish 3% Other Asian/Pacific 2% Korean 2%
Political lean MEDSL · Thurston
- 2024 margin
- Strong D (+20.4) · D 58.5% · R 38.1% · Other 3.5%
- 2008→2024 swing
- -1.3pp toward R · 2008: 21.7pp · 2024: 20.4pp
- All cycles
- 2024: D+20.4 2020: D+18.6 2016: D+15.4 2012: D+19.0 2008: D+21.7
Not yet ingested
- Civics
- —
Market trends
- HPI YoY
- ▼ -413.86%
- Current HPI
- 340.9379
- Rent YoY
- ▲ 3.89%
- Metro
- Olympia-Lacey-Tumwater, WA
- State GDP YoY
- ▲ 4.65%
- F500 in state
- 22
Industry mix (Fortune 500 HQ in WA)
| Industry | F500 HQs | Revenue |
|---|---|---|
| Retail | 2 | $269B |
|
||
| Technology / Retail | 1 | $638B |
|
||
| Technology | 1 | $245B |
|
||
| Telecommunications | 1 | $38B |
|
||
| Food / Beverage | 1 | $36B |
|
||
| Automotive / Trucks | 1 | $34B |
|
||
Price history
3 events — show timeline
- 2026-06-12 Relisted — NWMLS as Distributed by MLS Grid
- 2026-05-21 Pending — NWMLS as Distributed by MLS Grid
- 2026-05-07 Listed $549,900 NWMLS as Distributed by MLS Grid
Property tax history
+5.1%/yrLatest (2026): $5,744 · +8.5% YoY. Source: county tax records.
Cash-flow waterfall
monthlySold comps — $/sqft
last 12 mo · ≤1 miLoading sold comps…