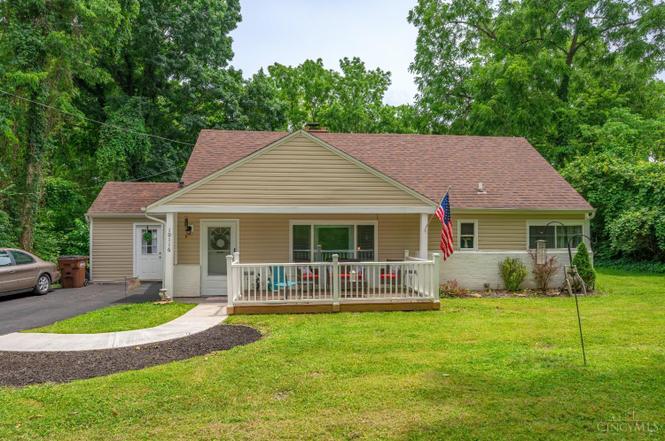
10116 Ronnie Rd · Woodlawn, OH
Flood risk 1/10 · Minimal
- FEMA flood zone
- X (unshaded)
- Chance of flooding over 30 yrs
- 0.0%
- Est. flood insurance / yr
- $507 – $1,088
Fire risk 1/10 · Minimal
- Est. fire insurance / yr
- $713 – $1,323
Heat risk 4/10 · Minor
- Hot days now (above 103°F)
- 7 days/yr
- Hot days in 30 yrs
- 19 days/yr
Wind risk 2/10 · Minimal
- Chance of severe wind over 30 yrs
- 1.0%
Air-quality risk 4/10 · Minor
- Unhealthy air days now
- 4 days/yr
- Unhealthy air days in 30 yrs
- 7 days/yr
Risk factors via First Street. Map © Google.
Why this score? — see what drove the C- grade
The composite is a weighted blend of 9 inputs, each scored 0–100. Each bar is that input's sub-score; the figure is the points it added to the 100-point composite (weight × sub-score).
- ARV discount +15.0/15.0
- Cash flow +14.6/30.0
- Rent growth +4.5/5.0
- DSCR +4.4/10.0
- 1% rule +3.8/10.0
- Livability +3.8/5.0
- Schools +3.4/10.0
- Condition / age +2.5/5.0
- Appreciation +0.0/10.0
$210,000
🖨 Deal sheet (PDF) 📄 Offer letter ✓ Due diligence
Listing remarks MLS
Renovated Ranch with Stainless Steel appliances, new carpet, new granite counters, new ceramic tile, fresh paint and huge inviting new rear concrete patio. Come take a look at this inviting home on a tree lined street. Park nearby. The only thing missing is you!
Key facts
- Spacious backyard
- Storage shed
- Above-ground pool
Tags
Property features AI
Finance
- HOA & community: No HOA
Exterior
- Parking: Driveway
- Security: Visual smoke alarm
- Utilities: Public water; Public sewer; Natural gas
- Home design: Ranch-style single family home; One level; Poured foundation
- Construction: Aluminum siding; Composition roof
- Exterior features: Patio; Above-ground pool; Shed on property; Less than 0.5 acre lot; Residential zoning
Interior
- Kitchen: Pantry; Marble/granite/slate surfaces; Vinyl flooring in kitchen; Electric cooktop, oven/range, microwave, refrigerator, dishwasher
- Bedrooms: Three bedrooms — primary bedroom on level 1 (13 x 10); Second bedroom on level 1 (11 x 9); Third bedroom on level 1 (9 x 8)
- Flooring: Wall-to-wall carpet in family room; Vinyl flooring in kitchen
- Bathrooms: One full bathroom on level 1 with shower; Bathroom includes grab bars
- Heating & cooling: Forced air heating (gas); Central air conditioning; Gas water heater
- Interior features: Six total rooms; Visual smoke alarm; Grab bars in bathroom; Cable available; Family room walkout
- Laundry & utility: Washer and dryer included
Neighborhood map
What this means for you Summary
Snapshot
- This is a 3-bed/1.0-bath single-family listed at $210k.
Deal economics
- At list price, monthly cash flow is $49 ($589/yr) — positive.
- The deal already cash-flows at list — no discount required.
- To meet the 1% rule (rent ≥ 1% of price), the offer needs to be $185k (11.7% below list).
- Recommended offer: $185k (11.7% below list) — sets the bar for 1% rule.
Location & tenants
- Location reads 76/100 on livability (#238 in OH, #3,792 nationally) — a middle-class / working-renter tenant base. Strengths: commute A+, cost of living A+, housing A+; Watch: crime F, amenities F.
- Princeton City (suburban): math 34% / reading 43% proficiency, ranked #542 of 656 in OH (top 83%) — families likely to look elsewhere, expect single-tenant / working-renter base with shorter leases.
- Zoned schools: Princeton Community Middle School (math 28% / reading 38%, grade F, #553 of 654 statewide, top 85%, 1,290 students, 62% FRL) — zoned schools at 62% FRL track the district average.
- Market conditions: Rents rising fast (+8.0%/yr); 50 active listings in the ZIP; 7 comparable units currently listed for rent nearby; rentals leasing fast (median 5d on market — plan ~1-2 weeks tenant-placement turnaround); 801 units permitted in Hamilton County in 2024 (190 in 5+ unit buildings).
- This rent runs 32% of the median local income ($69k/yr) — at the standard rent-burdened threshold; future hikes will face affordability resistance.
Forward outlook
- Local home prices are declining (-3.0%/yr); year-one equity from $1k of loan paydown is wiped out by about $6k of value loss. Plan a longer hold.
Negotiation context
- Only 3 days on market — expect competitive offers; lowballing is unlikely to land.
- 5 sale attempts since 26y ago with the ask held roughly flat each time — persistent listings suggest the price (not the market) is what's stuck; bring a comps-based counter.
- Current owner paid $134k; list at $210k implies a 57% gain — meaningful room to come down on a strong offer.
Risks & watch-outs
- Watch-outs: built in 1953 — expect roof / HVAC / electrical / plumbing capex.
Questions for the listing agent
- Built in 1953 — when were the roof, HVAC, electrical panel, plumbing, and water heater last replaced?
- Is there a deadline driving the sale (1031 exchange, divorce, estate, relocation)? That informs how much negotiation room exists.
- Crime grade is F in this area — have there been break-ins, vandalism, or insurance claims at this property in the last 3 years? What carrier currently insures it and at what premium?
- What's the average days-on-market for RENTAL listings here right now (not sales)? A rising rental-DOM trend means longer vacancies and softer asking-rent achievability than the comps imply.
- What's the recent tenant-quality profile in this submarket — average credit score on applications, eviction rate, late-payment / NSF rate, and stable-employment percentage? A property-management company in the area should have these aggregated.
- How much new for-sale + rental construction is in the pipeline within 1–3 miles? Heavy new supply typically softens prices + rents 12–24 months out; constrained supply supports both.
Investment metrics
- 1% rule
- 0.88% ✗
- Cap rate
- 6.57%
- Cash-on-cash
- 1.00%
- DSCR
- 1.04
- GRM
- 9.4
CMA / ARV
- ARV (on-the-fly)
- $256,464
- Comps found
- 10
Show comp detail 10 sales within ~0.75 mi
| Address | Dist | Beds/Ba | Sqft | Sold | Price | $/sf | Match |
|---|---|---|---|---|---|---|---|
| 126 Riddle Rd | 0.28mi | 3/2.0 | 1,258 (+2%) | 7mo | $230,000 | $183 | 74 |
| 10240 Panola Dr | 0.24mi | 3/1.0 | 1,100 (-11%) | 3mo | $230,000 | $209 | 68 |
| 10277 Faxon Ct | 0.29mi | 3/1.5 | 1,100 (-11%) | 10mo | $202,000 | $184 | 58 |
| 135 Brookhaven Ave | 0.27mi | 3/2.0 | 1,100 (-11%) | 12mo | $155,000 | $141 | 56 |
| 112 W Leslie Ave | 0.32mi | 3/2.0 | 1,064 (-14%) | 3mo | $125,000 | $117 | 56 |
| 10078 Woodstock Rd | 0.11mi | 3/2.0 | 1,378 (+12%) | 20mo | $300,000 | $218 | 54 |
| 139 Brookhaven Ave | 0.26mi | 3/2.0 | 1,100 (-11%) | 17mo | $247,000 | $225 | 52 |
| 101 W Leslie Ave | 0.34mi | 3/1.0 | 1,053 (-15%) | 11mo | $118,000 | $112 | 50 |
| 3 Evergreen Cir | 0.62mi | 2/3.0 (-1) | 1,138 (-8%) | 12mo | $265,000 | $233 | 35 |
| 31 Leslie Ave | 0.48mi | 4/2.0 (+1) | 1,056 (-14%) | 21mo | $220,000 | $208 | 27 |
Match score weights: distance 35% · size 25% · config 20% · recency 20%. Top-matched comps best support the ARV.
Projected returns pro-forma
-3.0% appreciation · 8.0% rent growth · sell at horizon
- IRR
- -9.4%
- Equity multiple
- 0.64×
- Total profit
- $-21,096
- Equity at exit
- $31,312
- IRR
- 5.7%
- Equity multiple
- 1.52×
- Total profit
- $30,287
- Equity at exit
- $18,157
Cash invested: $58,800 (down + closing). Projections, not guarantees.
Landlord ↔ Tenant lean methodology
- Overall (STATE)
- 73 Landlord-Friendly
- State Ohio
- 73 Landlord-Friendly · R+6
- County
- — inherits STATE
- City
- — inherits STATE
ZIP-level market 45215
- Rents YoY
- 8.0%
- Active inventory
- 50
- Price-to-rent
- 9.4×
Monthly cashflow live
- Estimated rent
- $1,854 high interval (Pro) →
- Mortgage (P&I)
- −$1,101
- Tax from tax record
- −$227 /mo · $2,726/yr
- Insurance
- −$88
- HOA
- −$0
- Vacancy / Maint / Mgmt
- −$389
- Net cashflow
- $49
Break-even live
Sensitivity live
| Price | -10% $168 | -5% $109 | +0% $49 | +5% $-10 | +10% $-70 |
|---|---|---|---|---|---|
| Rent | -10% $-97 | -5% $-24 | +0% $49 | +5% $122 | +10% $196 |
| Rate | -1.0pp $155 | -0.5pp $103 | base $49 | +0.5pp $-5 | +1.0pp $-61 |
UW: 25.0% down · 7.5% · 30yr · 1.5% tax · 5.0% vac · 8.0% maint · 8.0% mgmt
Financing live
Cash to close
- Down payment
- $52,500
- Closing costs
- $6,300
- Reserves months
- —
- Total cash needed
- —
Loan-product check · same deal, 3 products live
Conventional
25% down · 7.5% · 30yr
- Down + closing
- —
- Monthly P&I
- —
- Monthly cashflow
- —
- DSCR
- —
- Eligible?
- —
Personal DTI + credit; lowest rate.
DSCR
20% down · 8.5% · 30yr
- Down + closing
- —
- Monthly P&I
- —
- Monthly cashflow
- —
- DSCR
- —
- Eligible?
- —
No personal income docs; deal must DSCR.
Hard money
10% down · 12.0% · 12mo
- Down + closing
- —
- Monthly P&I
- —
- Monthly cashflow
- —
- DSCR
- —
- Eligible?
- —
Short-term bridge; refi at stabilization.
Rent comps 7 comps
| Address | Beds | Baths | Sqft | Rent | $/sqft | DOM | Units | Dist |
|---|---|---|---|---|---|---|---|---|
| 10645 Springfield Pike Cincinnati, OH | 1.0–2.0 | 1.0–2.0 | 886 | $1,590 | $1.79 | 4d | 13 | 0.93mi |
| 1410 Springfield Pike Cincinnati, OH | 2.0 | 2.0 | 1390 | $1,785 | $1.28 | 0d | 3 | 0.93mi |
| 10637 Springfield Pike Cincinnati, OH | 1.0–3.0 | 1.0–2.0 | 1042 | $2,250 | $2.16 | 0d | 49 | 1.02mi |
| 738 Adams St Apt 1 Cincinnati, OH | 2.0 | 1.0 | 750 | $1,095 | $1.46 | 45d | 1 | 1.07mi |
| 51 Bishopsgate Dr Cincinnati, OH | 1.0–2.0 | 1.0–2.0 | 845 | $1,885 | $2.23 | 3d | 13 | 1.09mi |
| 911 Prairie Ave Cincinnati, OH | 4.0 | 1.0 | 1243 | $1,995 | $1.60 | 9d | 1 | 1.10mi |
| 10562 Toulon Dr Cincinnati, OH | 3.0 | 1.5 | 1390 | $2,300 | $1.65 | 6d | 1 | 1.17mi |
Listing history 3 events
-
2026-06-21days on market $210,000 Active 3 DOM
-
2026-06-19remarks 695-char remark
-
2026-06-19$210,000 Active 1 DOM
ⓘ Source: listings_history table (triggers on properties + properties_extension) + one-shot
backfill from property_details.listing_events for pre-trigger history.
Tax reassessment forecast OH · Partial reset (capped growth)
- Current annual tax
- $2,726 · $227/mo
- Projected year-2 tax
- $3,001 · $250/mo
- Expected delta
- +$275/yr (+$23/mo · 10.1%)
ⓘ Screening estimate from a state-policy table — verify with the county assessor before closing.
Climate risk First Street
- Flood 1/10 Low FEMA zone X (unshaded) · 0% chance over 30 yrs
- Wildfire 1/10 Low
- Heat 4/10 Moderate 7 d/yr ≥103°F today · 19 d/yr by 30 yrs out
- Wind 2/10 Low 100% chance of damaging wind over 30 yrs
- Air quality 4/10 Moderate 4 unhealthy d/yr today · 7 by 30 yrs out
Nearby sold comps map
Loading sold comps map…
Walkable amenities ~0.75 mi
Loading nearby amenities…
Taxation est. · year 1
- Rental income
- $22,253
- − Mortgage interest
- −$11,763
- − Property taxes
- −$2,726
- − Insurance
- −$1,050
- − Repairs & maintenance
- −$1,780
- − Management
- −$1,780
- − Depreciation
- −$6,109
- Taxable loss
- −$2,955
- Est. tax savings @ 24.0%
- +$709
- After-tax cash flow
- $1,298/yr
For passive investors: Depreciation is non-cash, so a rental often shows a tax loss while cash-flowing — sheltering income. Rental losses are passive: they offset passive income freely, and up to $25,000/yr can offset ordinary (W-2) income if you actively participate and your MAGI is under $100k (phasing out to $0 by $150k); unused losses carry forward. On sale, claimed depreciation is recaptured at up to 25%, and gains may owe capital-gains tax (a 1031 exchange can defer both). Figures are a year-1 estimate at your 24.0% rate — not tax advice; consult a CPA.
Schools (NCES district)
- District
- Princeton City
- NCES district ID
- 3904467
- Math proficiency
- 34% ▼ -18.00%
- Reading proficiency
- 43% ▼ -8.00%
- Median HH income
- $53,182
- Composite
- 33.52/100
- National rank
- #5436
- State rank
- #542 of 656 in OH
Livability — Woodlawn
- Score
- 76/100
- State rank
- #238
- US rank
- #3792
Category grades
Schools grade is shown separately in the Schools card above.
Census & demographics
- Census place
- Woodlawn, OH
- County
- Hamilton County · 701,295 people
- Metro
- Cincinnati, OH-KY-IN
- Population (ZIP)
- 30,586
- Household income
- $69,372
- Rent vs Own
- Severe rent burden
- 1529.0
Population outlook (Hamilton County) Hauer SSP2
- Today (2025)
- 826,054 people
- By 2030
- 830,947 · +0.6%
- By 2040
- 832,319 · +0.8%
- By 2050
- 822,428 · -0.4%
- By 2075
- 788,688 · -4.5%
- By 2100
- 710,674 · -14.0%
Race, ethnicity, and origin ACS 2023
- Neighborhood character
- Majority White (63%)
- Race & ethnicity
- White 63% Black 26% Two or more races 6% Hispanic / Latino 3% Asian 2%
- Common ancestry
- Italian 3% Slovak 2% Lithuanian 1%
- Foreign-born
- 4% · Canada
- Languages at home
- 95% English-only · Spanish 2% Other Indo-European 1% French/Haitian/Cajun 1%
Political lean MEDSL · Hamilton
- 2024 margin
- D (+14.9) · D 57.0% · R 42.1%
- 2008→2024 swing
- +7.9pp toward D · 2008: 7.0pp · 2024: 14.9pp
- All cycles
- 2024: D+14.9 2020: D+15.9 2016: D+9.5 2012: D+4.9 2008: D+7.0
Not yet ingested
- Civics
- —
Market trends
- HPI YoY
- ▼ -263.50%
- Current HPI
- 217.3319
- Rent YoY
- ▲ 8.02%
- Metro
- Cincinnati, OH-KY-IN
- State GDP YoY
- ▲ 1.98%
- F500 in state
- 48
Industry mix (Fortune 500 HQ in OH)
| Industry | F500 HQs | Revenue |
|---|---|---|
| Insurance | 3 | $145B |
|
||
| Industrial Machinery | 3 | $49B |
|
||
| Financial Services | 3 | $24B |
|
||
| Consumer Goods | 2 | $93B |
|
||
| Aerospace / Defense | 2 | $47B |
|
||
| Utilities | 2 | $33B |
|
||
Price history
+556.2% since first listed15 events — show timeline
- 2026-06-18 Listed $210,000 Cincy MLS
- 2020-08-11 Sold (Public Records) $134,000 Public Records
- 2020-07-30 Sold (MLS) $134,000 Cincy MLS
- 2020-06-30 Contingent — Cincy MLS
- 2020-06-28 Listed $139,900 Cincy MLS
- 2016-05-26 Sold (MLS) $25,000 Cincy MLS
- 2016-05-02 Contingent — Cincy MLS
- 2016-04-01 Relisted — Cincy MLS
- 2016-03-26 Contingent — Cincy MLS
- 2016-03-15 Listed $30,000 Cincy MLS
- 2000-06-15 Sold (Public Records) $89,900 Public Records
- 2000-05-24 Sold (MLS) $89,900 Cincy MLS
- 2000-04-26 Listed $89,900 Cincy MLS
- 1986-09-10 Sold (Public Records) $44,000 Public Records
- 1978-11-01 Sold (Public Records) $32,000 Public Records
Property tax history
+4.7%/yrLatest (2025): $2,726 · +13.9% YoY. Source: county tax records.
Cash-flow waterfall
monthlySold comps — $/sqft
last 12 mo · ≤1 miLoading sold comps…