2205 Kentucky St · Racine, WI
Flood risk 1/10 · Minimal
- FEMA flood zone
- X (unshaded)
- Chance of flooding over 30 yrs
- 0.0%
- Est. flood insurance / yr
- $507 – $1,088
Fire risk 1/10 · Minimal
- Est. fire insurance / yr
- $636 – $1,182
Heat risk 2/10 · Minimal
- Hot days now (above 96°F)
- 7 days/yr
- Hot days in 30 yrs
- 14 days/yr
Wind risk 2/10 · Minimal
- Chance of severe wind over 30 yrs
- —
Air-quality risk 3/10 · Minor
- Unhealthy air days now
- 3 days/yr
- Unhealthy air days in 30 yrs
- 3 days/yr
Risk factors via First Street. Map © Google.
Why this score? — see what drove the B- grade
The composite is a weighted blend of 9 inputs, each scored 0–100. Each bar is that input's sub-score; the figure is the points it added to the 100-point composite (weight × sub-score).
- Cash flow +30.0/30.0
- 1% rule +10.0/10.0
- DSCR +10.0/10.0
- ARV discount +7.5/15.0
- Livability +4.0/5.0
- Rent growth +2.5/5.0
- Condition / age +2.5/5.0
- Schools +1.5/10.0
- Appreciation +0.0/10.0
$86,000
🖨 Deal sheet 📄 Offer letter ✓ Due diligence
Listing remarks
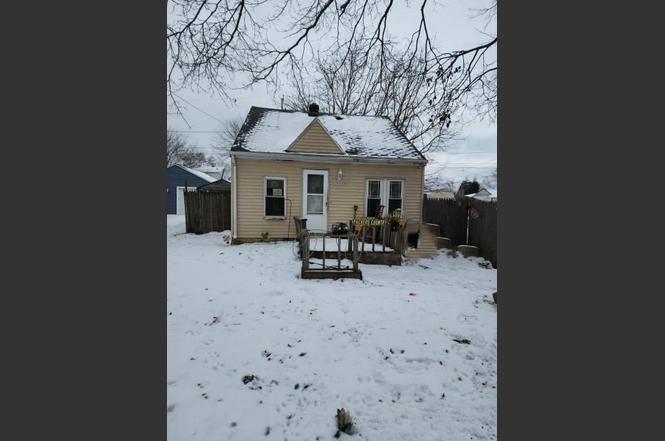
Opportunity in Racine! This 3-bedroom, 1-bath home with a detached garage and backyard shed offers strong potential for investors or buyers looking to renovate and add value. The property shows deferred maintenance and an outdated interior, presenting a great opportunity to reimagine and restore the space. Conveniently located near shopping and dining along Durand Ave, Racine Zoo, and Lake Michigan parks and trails. If property was built prior to 1978, Lead Based Paint potentially exists.
Key facts
- Near dining
- Near racine zoo
- Near shopping
Tags
Property features AI
Exterior
- Parking: Detached carport for one car (1 garage/carport space total)
- Utilities: Municipal water; Municipal sewer; Private septic system
- Home design: Single-family home; 1.5-story design; Located in a city (Racine)
- Construction: Year built: public/assessor record
- Exterior features: Wood exterior; Garden shed; Sidewalks
Interior
- Kitchen: Includes appliances (unspecified/other)
- Bedrooms: Master bedroom on main level, about 12 x 16; Second bedroom on main level, about 10 x 12; Third bedroom on upper level, about 10 x 12
- Bathrooms: One full bathroom
- Heating & cooling: Central air; Natural gas heating
- Interior features: Living room (main level) approximately 11 x 13; No basement (slab); Main-level kitchen approximately 10 x 9
Neighborhood map
What this means for you Summary
Snapshot
- This is a 3-bed/1.0-bath single-family listed at $86k.
Deal economics
- At list price, monthly cash flow is $438 ($5k/yr) — positive.
- The deal already cash-flows at list — no discount required.
- Meets the 1% rule at list price ($1k rent vs $86k).
- Recommended offer: $81k (6.0% below list) — sets the bar for market timing.
- Cap rate 12.4% vs local median 4.0% in Racine — top-decile yield for the area; either an underpriced asset or a hidden risk that comps aren't pricing in. Stress-test before assuming the spread holds.
Location & tenants
- Location reads 80/100 on livability (#58 in WI, #1,622 nationally) — a professional / high-income tenant draw. Strengths: commute A+, cost of living A+, housing A+; Watch: employment D.
- Racine Unified School District (urban): math 12% / reading 20% proficiency, ranked #335 of 342 in WI (top 98%) — low school quality limits family demand, transient renter base, plan for 1-2y turnover.
- Zoned schools: Schulte Elementary (math 12% / reading 22%, grade F, #885 of 1,041 statewide, top 86%, 313 students, 55% FRL); Case High (math 16% / reading 33%, grade F, #287 of 483 statewide, top 71%, 1,884 students, 51% FRL) — zoned schools at 53% FRL track the district average.
- Market conditions: 45 active listings in the ZIP; 9 comparable units currently listed for rent nearby; rentals at typical pace (median 21d on market — plan ~3-4 weeks tenant-placement turnaround); 505 units permitted in Racine County in 2024 (287 in 5+ unit buildings).
Forward outlook
- Local home prices are declining (-3.0%/yr); year-one equity from $595 of loan paydown is wiped out by about $3k of value loss. Plan a longer hold.
- Racine County population projected to shrink 7% by 2050 — rents likely to lag national; underwrite the cash flow, not the appreciation.
- At projected returns (-3.0% appreciation + 3.0% rent growth), your $24k cash investment doubles in ~6 years — after that, you're playing with house money.
Negotiation context
- It's been on market 72 days — a 6% lower offer ($81k) is reasonable based on typical stale-listing flexibility.
- 2 sale attempts with the ask held roughly flat each time — persistent listings suggest the price (not the market) is what's stuck; bring a comps-based counter.
- Current owner paid $55k; list at $86k implies a 56% gain — meaningful room to come down on a strong offer.
Risks & watch-outs
- Watch-outs: built in 1942 — expect roof / HVAC / electrical / plumbing capex.
Questions for the listing agent
- It's been on market 72 days. Have you received any prior offers? Is the seller open to a 6% concession, seller financing, or rate buy-down credit?
- Built in 1942 — when were the roof, HVAC, electrical panel, plumbing, and water heater last replaced?
- Why hasn't it sold? Are there any deal-killer items the seller is aware of (foundation, flood, title, zoning, code violations)?
- Is there a deadline driving the sale (1031 exchange, divorce, estate, relocation)? That informs how much negotiation room exists.
- Schools are D-rated, which usually means shorter tenancies and higher turnover. Who's the typical renter profile here, and what's been the actual vacancy rate?
- What's the average days-on-market for RENTAL listings here right now (not sales)? A rising rental-DOM trend means longer vacancies and softer asking-rent achievability than the comps imply.
- What's the recent tenant-quality profile in this submarket — average credit score on applications, eviction rate, late-payment / NSF rate, and stable-employment percentage? A property-management company in the area should have these aggregated.
- How much new for-sale + rental construction is in the pipeline within 1–3 miles? Heavy new supply typically softens prices + rents 12–24 months out; constrained supply supports both.
Investment metrics
- 1% rule
- 1.52% ✓
- Cap rate
- 12.41%
- Cash-on-cash
- 21.83%
- DSCR
- 1.97
- GRM
- 5.5
CMA / ARV
- ARV (on-the-fly)
- $201,291
- Comps found
- 12
Show comp detail 12 sales within ~0.75 mi
| Address | Dist | Beds/Ba | Sqft | Sold | Price | $/sf | Match |
|---|---|---|---|---|---|---|---|
| 2430 Orchard St | 0.17mi | 2/1.0 (-1) | 900 (+2%) | 2mo | $210,000 | $233 | 81 |
| 2405 Russet St | 0.17mi | 2/1.0 (-1) | 900 (+2%) | 4mo | $175,000 | $194 | 80 |
| 4212 Republic Ave | 0.37mi | 3/1.0 | 894 (+2%) | 1mo | $210,000 | $235 | 79 |
| 2121 Ohio St | 0.32mi | 2/1.0 (-1) | 901 (+2%) | 6mo | $196,000 | $218 | 71 |
| 4100 Victory Ave | 0.56mi | 2/1.0 (-1) | 876 (-0%) | 3mo | $202,000 | $231 | 66 |
| 2918 Arthur Ave | 0.59mi | 2/1.0 (-1) | 875 (-0%) | 6mo | $169,900 | $194 | 62 |
| 4200 Maryland Ave | 0.67mi | 3/1.0 | 909 (+3%) | 2mo | $145,000 | $160 | 61 |
| 2033 Cleveland Ave | 0.40mi | 2/1.0 (-1) | 804 (-8%) | 8mo | $166,000 | $206 | 56 |
| 1942 Hayes Ave | 0.59mi | 2/2.0 (-1) | 949 (+8%) | 1mo | $220,000 | $232 | 49 |
| 3316 Durand Ave | 0.65mi | 2/1.5 (-1) | 981 (+12%) | 1mo | $225,000 | $229 | 42 |
| 1628 Echo Ln | 0.74mi | 3/1.0 | 1,001 (+14%) | 0mo | $204,000 | $204 | 42 |
| 1504 Oregon St | 0.74mi | 2/1.0 (-1) | 803 (-9%) | 7mo | $242,500 | $302 | 40 |
Match score weights: distance 35% · size 25% · config 20% · recency 20%. Top-matched comps best support the ARV.
Projected returns pro-forma
-3.0% appreciation · 3.0% rent growth · sell at horizon
- IRR
- 14.5%
- Equity multiple
- 1.58×
- Total profit
- $13,987
- Equity at exit
- $12,823
- IRR
- 23.3%
- Equity multiple
- 3.00×
- Total profit
- $48,189
- Equity at exit
- $7,436
Cash invested: $24,080 (down + closing). Projections, not guarantees.
Landlord ↔ Tenant lean methodology
- Overall (STATE)
- 73 Landlord-Friendly
- State Wisconsin
- 73 Landlord-Friendly · R+2
- County
- — inherits STATE
- City
- — inherits STATE
ZIP-level market 53405
- Active inventory
- 45
- Price-to-rent
- 5.5×
Monthly cashflow live
- Estimated rent
- $1,307 high interval (Pro) →
- Mortgage (P&I)
- −$451
- Tax est. 1.5%
- −$108 /mo · $1,290/yr
- Insurance
- −$36
- HOA
- −$0
- Vacancy / Maint / Mgmt
- −$274
- Net cashflow
- $438
Break-even live
UW: 25.0% down · 7.5% · 30yr · 1.5% tax · 5.0% vac · 8.0% maint · 8.0% mgmt
Financing live
Cash to close
- Down payment
- $21,500
- Closing costs
- $2,580
- Reserves months
- —
- Total cash needed
- —
Loan-product check · same deal, 3 products live
Conventional
25% down · 7.5% · 30yr
- Down + closing
- —
- Monthly P&I
- —
- Monthly cashflow
- —
- DSCR
- —
- Eligible?
- —
Personal DTI + credit; lowest rate.
DSCR
20% down · 8.5% · 30yr
- Down + closing
- —
- Monthly P&I
- —
- Monthly cashflow
- —
- DSCR
- —
- Eligible?
- —
No personal income docs; deal must DSCR.
Hard money
10% down · 12.0% · 12mo
- Down + closing
- —
- Monthly P&I
- —
- Monthly cashflow
- —
- DSCR
- —
- Eligible?
- —
Short-term bridge; refi at stabilization.
Rent comps 9 comps
| Address | Beds | Baths | Sqft | Rent | $/sqft | DOM | Units | Dist |
|---|---|---|---|---|---|---|---|---|
| 1851 Roosevelt Ave Unit 7 Racine, WI | 2.0 | 1.0 | 875 | $1,150 | $1.31 | 21d | 1 | 0.67mi |
| 3313 Daisy Ln Unit 4 Racine, WI | 2.0 | 1.0 | 1025 | $1,150 | $1.12 | 21d | 1 | 0.71mi |
| 5021 Byrd Ave Unit 103 Racine, WI | 2.0 | 1.0 | 875 | $1,015 | $1.16 | 21d | 1 | 0.72mi |
| 5021 Byrd Ave Unit 205 Racine, WI | 2.0 | 1.0 | 875 | $1,100 | $1.26 | 21d | 1 | 0.72mi |
| 5021 Byrd Ave Unit 210 Racine, WI | 2.0 | 1.0 | 875 | $1,050 | $1.20 | 21d | 1 | 0.72mi |
| 1802 Grange Ave Unit 101 Racine, WI | 2.0 | 1.0 | 1000 | $1,400 | $1.40 | 21d | 1 | 0.97mi |
| 5612 Castle Ct Racine, WI | 2.0 | 1.0 | 825 | $965 | $1.17 | 13d | 1 | 0.98mi |
| 8419 Corliss Ave Sturtevant, WI | 1.0–2.0 | 1.0–2.0 | 962 | $1,875 | $1.95 | 13d | 1 | 1.03mi |
| 5945 Joanne Dr Unit 101 Mt Pleasant, WI | 2.0 | 1.0 | 800 | $1,100 | $1.38 | 21d | 1 | 1.28mi |
Listing history 18 events
-
2026-06-19days on market $86,000 Active 72 DOM
-
2026-06-18days on market $86,000 Active 71 DOM
-
2026-06-17days on market $86,000 Active 70 DOM
-
2026-06-16days on market $86,000 Active 69 DOM
-
2026-06-15days on market $86,000 Active 68 DOM
-
2026-06-14days on market $86,000 Active 66 DOM
-
2026-06-13days on market $86,000 Active 65 DOM
-
2026-06-10days on market $86,000 Active 63 DOM
-
2026-06-09days on market $86,000 Active 62 DOM
-
2026-06-08days on market $86,000 Active 61 DOM
-
2026-06-07days on market $86,000 Active 60 DOM
-
2026-06-05days on market $86,000 Active 57 DOM
-
2026-06-03status $86,000 Active 56 DOM
-
2026-05-11status Pending
-
2026-04-02status Active
-
2026-03-26status Pending
-
2026-03-09$86,000 Active
-
2010-11-16soldstatus $55,000
ⓘ Source: listings_history table (triggers on properties + properties_extension) + one-shot
backfill from property_details.listing_events for pre-trigger history.
Climate risk First Street
- Flood 1/10 Low FEMA zone X (unshaded) · 0% chance over 30 yrs
- Wildfire 1/10 Low
- Heat 2/10 Low 7 d/yr ≥96°F today · 14 d/yr by 30 yrs out
- Wind 2/10 Low
- Air quality 3/10 Moderate 3 unhealthy d/yr today · 3 by 30 yrs out
Nearby sold comps map
Loading sold comps map…
Walkable amenities ~0.75 mi
Loading nearby amenities…
Taxation est. · year 1
- Rental income
- $15,682
- − Mortgage interest
- −$4,817
- − Property taxes
- −$1,290
- − Insurance
- −$430
- − Repairs & maintenance
- −$1,255
- − Management
- −$1,255
- − Depreciation
- −$2,502
- Taxable income
- $4,134
- Est. tax owed @ 24.0%
- −$992
- After-tax cash flow
- $4,265/yr
For passive investors: Depreciation is non-cash, so a rental often shows a tax loss while cash-flowing — sheltering income. Rental losses are passive: they offset passive income freely, and up to $25,000/yr can offset ordinary (W-2) income if you actively participate and your MAGI is under $100k (phasing out to $0 by $150k); unused losses carry forward. On sale, claimed depreciation is recaptured at up to 25%, and gains may owe capital-gains tax (a 1031 exchange can defer both). Figures are a year-1 estimate at your 24.0% rate — not tax advice; consult a CPA.
Schools (NCES district)
- District
- Racine Unified School District
- NCES district ID
- 5512360
- Math proficiency
- 12% ▼ -7.00%
- Reading proficiency
- 20% ▬ 0.00%
- Median HH income
- $50,716
- Composite
- 14.64/100
- National rank
- #9405
- State rank
- #335 of 342 in WI
Livability — Racine
- Score
- 80/100
- State rank
- #58
- US rank
- #1622
Category grades
Schools grade is shown separately in the Schools card above.
Census & demographics
- Census place
- Racine, WI
- County
- Racine County · 146,693 people
- City population
- 67,505
- Metro
- Racine, WI
- Population (ZIP)
- 26,793
- Household income
- $69,242
- Rent vs Own
- Severe rent burden
- 430.0
Population outlook (Racine County) Hauer SSP2
- Today (2025)
- 195,281 people
- By 2030
- 193,725 · -0.8%
- By 2040
- 188,159 · -3.6%
- By 2050
- 181,323 · -7.1%
- By 2075
- 174,342 · -10.7%
- By 2100
- 166,870 · -14.5%
Race, ethnicity, and origin ACS 2023
- Neighborhood character
- Diverse neighborhood (Simpson 0.56)
- Race & ethnicity
- White 63% Hispanic / Latino 17% Two or more races 15% Black 12% Asian 1%
- Hispanic origin (detail)
- Mexican 15% Puerto Rican 1%
- Common ancestry
- Romanian 7% Portuguese 4% Lithuanian 2%
- Foreign-born
- 4% · Canada
- Languages at home
- 91% English-only · Spanish 7% German/W. Germanic 1%
Political lean MEDSL · Racine
- 2024 margin
- Lean R (+6.2) · D 46.3% · R 52.5% · Other 1.2%
- 2008→2024 swing
- -13.6pp toward R · 2008: 7.4pp · 2024: -6.2pp
- All cycles
- 2024: R+6.2 2020: R+4.1 2016: R+4.4 2012: D+3.6 2008: D+7.4
Not yet ingested
- Civics
- —
Market trends
- HPI YoY
- ▼ -220.43%
- Current HPI
- 189.5192
- Rent YoY
- —
- Metro
- Racine, WI
- State GDP YoY
- ▲ 2.10%
- F500 in state
- 20
Industry mix (Fortune 500 HQ in WI)
| Industry | F500 HQs | Revenue |
|---|---|---|
| Industrial Machinery | 4 | $23B |
|
||
| Industrial Technology | 2 | $36B |
|
||
| Insurance | 1 | $36B |
|
||
| Professional Services | 1 | $19B |
|
||
| Utilities | 1 | $9B |
|
||
| Consumer Goods | 1 | $3B |
|
||
Price history
+56.4% since first listed5 events — show timeline
- 2026-05-11 Pending — METROMLS
- 2026-04-02 Relisted — METROMLS
- 2026-03-26 Pending — METROMLS
- 2026-03-09 Listed $86,000 METROMLS
- 2010-11-16 Sold (Public Records) $55,000 Public Records
Property tax history
+5.6%/yrLatest (2025): $4,430 · +14.0% YoY. Source: county tax records.
Cash-flow waterfall
monthlySold comps — $/sqft
last 12 mo · ≤1 miLoading sold comps…