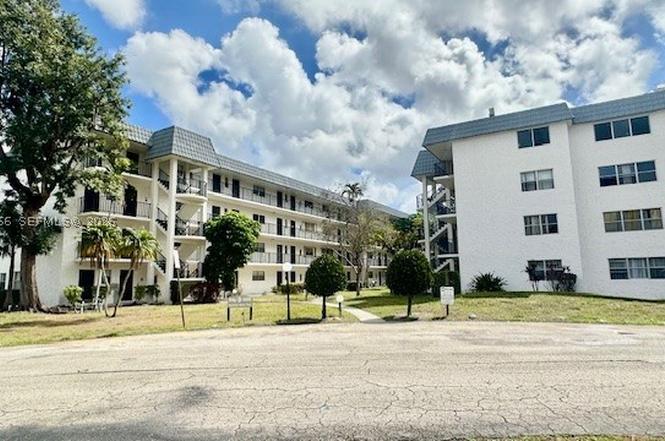
3330 Spanish Moss Ter #311 · Lauderhill, FL
Flood risk No data
- FEMA flood zone
- —
- Chance of flooding over 30 yrs
- —
- Est. flood insurance / yr
- —
Fire risk No data
- Est. fire insurance / yr
- —
Heat risk No data
- Hot days now (above threshold)
- —
- Hot days in 30 yrs
- —
Wind risk No data
- Chance of severe wind over 30 yrs
- —
Air-quality risk No data
- Unhealthy air days now
- —
- Unhealthy air days in 30 yrs
- —
Risk factors via First Street. Map © Google.
Why this score? — see what drove the D+ grade
The composite is a weighted blend of 9 inputs, each scored 0–100. Each bar is that input's sub-score; the figure is the points it added to the 100-point composite (weight × sub-score).
- Cash flow +15.0/30.0
- 1% rule +10.0/10.0
- ARV discount +7.5/15.0
- DSCR +4.6/10.0
- Schools +4.1/10.0
- Livability +4.0/5.0
- Condition / age +2.5/5.0
- Rent growth +2.2/5.0
- Appreciation +0.0/10.0
$84,900
🖨 Deal sheet (PDF) 📄 Offer letter ✓ Due diligence
Listing remarks
Spacious 3rd-Floor Condo with Updated Kitchen – Priced to Sell! Don’t miss your chance to own this condo featuring a updated kitchen and generous living space. Enjoy resort-style amenities including a pool, serene lake views, and 24/7 guarded entry. Ideally located near Sawgrass Mall, major highways, shopping, dining, schools, and houses of worship. HOA covers basic cable, water, sewer, trash, lawn care, exterior maintenance (including roof), and more. 40-year recertification completed per association. Owner financing available – a great opportunity for qualified buyers! Easy to show – schedule your visit today!
Key facts
- Near sawgrass mall
- Guarded entry
- Serene lake views
Tags
Property features AI
Finance
- Other: Association fee listed as monthly
- Financial info: Pets allowed with restrictions or conditions
- HOA & community: Monthly association fee; Association fee covers common areas, cable TV, insurance, structural maintenance, parking, roof, sewer, trash, and water; Association amenities include clubhouse, laundry, pool, and elevators
Exterior
- Parking: 1 covered garage space; Guest parking available; One additional parking space
- Security: Smoke detectors
- Utilities: Public water; Public sewer; Electric service
- Home design: Attached property; 4-story building; Entry located on level 3
- Construction: Block construction; Resale property
- Exterior features: Association pool
Interior
- Kitchen: Dishwasher; Electric range; Microwave; Refrigerator
- Bedrooms: Bedroom located on main level
- Flooring: Tile
- Bathrooms: 2 full bathrooms
- Heating & cooling: Central heating; Central air conditioning
- Interior features: First-floor entry; Bedroom on main level; Tile flooring
- Laundry & utility: Common area laundry; Electric water heater
Neighborhood map
What this means for you Summary
Snapshot
- This is a 2-bed/2.0-bath condo listed at $85k.
Deal economics
- At list price, monthly cash flow is $26 ($311/yr) — positive.
- The deal already cash-flows at list — no discount required.
- Meets the 1% rule at list price ($2k rent vs $85k).
- Recommended offer: $77k (9.0% below list) — sets the bar for market timing.
- Cap rate 6.7% vs local median 4.3% in Lauderhill — top-decile yield for the area; either an underpriced asset or a hidden risk that comps aren't pricing in. Stress-test before assuming the spread holds.
Location & tenants
- Location reads 79/100 on livability (#139 in FL, #2,059 nationally) — a middle-class / working-renter tenant base. Strengths: commute A+, cost of living A+, housing A+; Watch: schools D, employment D, amenities F.
- Broward (suburban): math 42% / reading 53% proficiency, ranked #46 of 73 in FL (top 63%) — families likely to look elsewhere, expect single-tenant / working-renter base with shorter leases.
- Market conditions: Rents soft (-1.4%/yr); 821 active listings in the ZIP; 40 comparable units currently listed for rent nearby; rentals at typical pace (median 18d on market — plan ~3-4 weeks tenant-placement turnaround); 2,111 units permitted in Broward County in 2024 (1,265 in 5+ unit buildings).
- This rent runs 38% of the median local income ($58k/yr) — at the standard rent-burdened threshold; future hikes will face affordability resistance.
Forward outlook
- Local home prices are declining (-3.0%/yr); year-one equity from $587 of loan paydown is wiped out by about $3k of value loss. Plan a longer hold.
- Broward County population projected at +34% by 2050 — long-run rental-demand tailwind backs the buy-and-hold thesis.
Negotiation context
- It's been on market 113 days — a 9% lower offer ($77k) is reasonable based on typical stale-listing flexibility.
- 9 sale attempts since 5y ago; this cycle's ask has dropped $40k (32%) from the opening price — seller is motivated, your offer sets the floor, not the list.
Risks & watch-outs
- Watch-outs: HOA is 43% of rent.
Questions for the listing agent
- It's been on market 113 days. Have you received any prior offers? Is the seller open to a 9% concession, seller financing, or rate buy-down credit?
- Built in 1973 — when were the roof, HVAC, electrical panel, plumbing, and water heater last replaced?
- What does the HOA fee cover, when was the last increase, and are there any pending special assessments or reserve-fund shortfalls?
- Any open or pending special assessments — roof, HVAC, plumbing, elevator, façade? What's the per-unit balance and payoff schedule, and is the seller paying it off at close or rolling it to the buyer?
- Why hasn't it sold? Are there any deal-killer items the seller is aware of (foundation, flood, title, zoning, code violations)?
- Is there a deadline driving the sale (1031 exchange, divorce, estate, relocation)? That informs how much negotiation room exists.
- Schools are D-rated, which usually means shorter tenancies and higher turnover. Who's the typical renter profile here, and what's been the actual vacancy rate?
- The area grade is low — what's the realistic commute time and amenity access for the typical tenant pool here? Any planned neighborhood developments (good or bad) we should know about?
- What's the average days-on-market for RENTAL listings here right now (not sales)? A rising rental-DOM trend means longer vacancies and softer asking-rent achievability than the comps imply.
- What's the recent tenant-quality profile in this submarket — average credit score on applications, eviction rate, late-payment / NSF rate, and stable-employment percentage? A property-management company in the area should have these aggregated.
- How much new apartment / multifamily construction is in the pipeline within 1–3 miles? Heavy new supply (>2% of stock underway) typically softens rents 12–24 months out; light construction supports rent growth.
Investment metrics
- 1% rule
- 2.21% ✓
- Cap rate
- 6.66%
- Cash-on-cash
- 1.31%
- DSCR
- 1.06
- GRM
- 3.8
CMA / ARV
No comps found within radius.
Projected returns pro-forma
-3.0% appreciation · 0.0% rent growth · sell at horizon
- IRR
- -22.2%
- Equity multiple
- 0.28×
- Total profit
- $-17,036
- Equity at exit
- $12,659
- IRR
- -71.2%
- Equity multiple
- -0.33×
- Total profit
- $-31,642
- Equity at exit
- $7,341
Cash invested: $23,772 (down + closing). Projections, not guarantees.
Landlord ↔ Tenant lean methodology
- Overall (STATE)
- 87 Strongly Landlord-Friendly
- State Florida
- 87 Strongly Landlord-Friendly · R+3
- County
- — inherits STATE
- City
- — inherits STATE
ZIP-level market 33319
- Rents YoY
- -1.4%
- Active inventory
- 821
- Price-to-rent
- 3.8×
Monthly cashflow live
- Estimated rent
- $1,873 high interval (Pro) →
- Mortgage (P&I)
- −$445
- Tax from tax record
- −$174 /mo · $2,087/yr
- Insurance
- −$35
- HOA
- −$799
- Vacancy / Maint / Mgmt
- −$393
- Net cashflow
- $26
Break-even live
Sensitivity live
| Price | -10% $74 | -5% $50 | +0% $26 | +5% $2 | +10% $-22 |
|---|---|---|---|---|---|
| Rent | -10% $-122 | -5% $-48 | +0% $26 | +5% $100 | +10% $174 |
| Rate | -1.0pp $69 | -0.5pp $47 | base $26 | +0.5pp $4 | +1.0pp $-18 |
UW: 25.0% down · 7.5% · 30yr · 1.5% tax · 5.0% vac · 8.0% maint · 8.0% mgmt
Financing live
Cash to close
- Down payment
- $21,225
- Closing costs
- $2,547
- Reserves months
- —
- Total cash needed
- —
Loan-product check · same deal, 3 products live
Conventional
25% down · 7.5% · 30yr
- Down + closing
- —
- Monthly P&I
- —
- Monthly cashflow
- —
- DSCR
- —
- Eligible?
- —
Personal DTI + credit; lowest rate.
DSCR
20% down · 8.5% · 30yr
- Down + closing
- —
- Monthly P&I
- —
- Monthly cashflow
- —
- DSCR
- —
- Eligible?
- —
No personal income docs; deal must DSCR.
Hard money
10% down · 12.0% · 12mo
- Down + closing
- —
- Monthly P&I
- —
- Monthly cashflow
- —
- DSCR
- —
- Eligible?
- —
Short-term bridge; refi at stabilization.
Rent comps 40 comps
| Address | Beds | Baths | Sqft | Rent | $/sqft | DOM | Units | Dist |
|---|---|---|---|---|---|---|---|---|
| 3360 Spanish Moss Ter #305 Lauderhill, FL | 3.0 | 2.0 | 1400 | $2,500 | $1.79 | 25d | 1 | 0.03mi |
| 3360 Spanish Moss Ter #408 Lauderhill, FL | 2.0 | 2.0 | 1200 | $1,850 | $1.54 | 14d | 1 | 0.03mi |
| 3360 Spanish Moss Ter #313 Lauderhill, FL | 2.0 | 2.0 | 1200 | $1,699 | $1.42 | 25d | 1 | 0.03mi |
| 3300 Spanish Moss Ter #302 Lauderhill, FL | 2.0 | 2.0 | 1200 | $1,950 | $1.62 | 14d | 1 | 0.07mi |
| 3300 Spanish Moss Ter Lauderhill, FL | 2.0 | 2.0 | 1200 | $1,900 | $1.58 | 25d | 1 | 0.07mi |
| 3280 Spanish Moss Ter #103 Lauderhill, FL | 2.0 | 2.0 | 1200 | $1,850 | $1.54 | 25d | 1 | 0.12mi |
| 3660 Inverrary Dr Lauderhill, FL | 1.0 | 1.0–1.5 | 725 | $1,799 | $2.48 | 8d | 3 | 0.12mi |
| 3660 Inverrary Dr Lauderhill, FL | 1.0 | 1.0–1.5 | 725 | $1,799 | $2.48 | 18d | 2 | 0.12mi |
| 3670 Inverrary Dr Lauderhill, FL | 1.0 | 1.0–1.5 | 650 | $1,450 | $2.23 | 15d | 2 | 0.13mi |
| 3670 Inverrary Dr Lauderhill, FL | 1.0 | 1.0–1.5 | 650 | $1,600 | $2.46 | 8d | 3 | 0.13mi |
| 3670 Inverrary Dr Unit 1F Lauderhill, FL | 1.0 | 1.5 | 880 | $1,450 | $1.65 | 20d | 1 | 0.13mi |
| 3301 Spanish Moss Ter Lauderhill, FL | 2.0 | 2.0 | 1090 | $1,900 | $1.74 | 18d | 3 | 0.15mi |
| 3680 Inverrary Dr Unit 1V Lauderhill, FL | 2.0 | 2.0 | 1150 | $2,100 | $1.83 | 14d | 1 | 0.19mi |
| 3680 Inverrary Dr Unit 1V Lauderhill, FL | 2.0 | 2.0 | 1150 | $2,100 | $1.83 | 13d | 1 | 0.19mi |
| 3571 Inverrary Dr #403 Lauderhill, FL | 2.0 | 2.0 | 1070 | $1,600 | $1.50 | 21d | 1 | 0.25mi |
| 3571 Inverrary Dr #305 Lauderhill, FL | 2.0 | 2.0 | 904 | $1,650 | $1.83 | 25d | 1 | 0.25mi |
| 3571 Inverrary Dr #403 Lauderhill, FL | 2.0 | 2.0 | 1070 | $1,600 | $1.50 | 2d | 1 | 0.25mi |
| 3774 Inverrary Blvd Lauderhill, FL | 1.0 | 1.5 | 726 | $1,638 | $2.26 | 25d | 2 | 0.26mi |
| 3774 Inverrary Blvd Lauderhill, FL | 1.0 | 1.5 | 726 | $1,638 | $2.26 | 2d | 2 | 0.26mi |
| 3774 Inverrary Blvd Unit 105P Lauderhill, FL | 1.0 | 1.5 | 726 | $1,675 | $2.31 | 3d | 1 | 0.26mi |
| 3650 Inverrary Dr Lauderhill, FL | 1.0 | 1.0–1.5 | 610 | $1,570 | $2.57 | 3d | 3 | 0.28mi |
| 3650 Inverrary Dr Lauderhill, FL | 1.0 | 1.0–1.5 | 610 | $1,570 | $2.57 | 14d | 3 | 0.28mi |
| 3650 Inverrary Dr Lauderhill, FL | 1.0 | 1.5 | 800 | $1,535 | $1.92 | 20d | 2 | 0.28mi |
| 6475 W Oakland Park Blvd Lauderhill, FL | 1.0 | 1.5 | 800 | $1,600 | $2.00 | 25d | 1 | 0.33mi |
| 3710 Inverrary Dr Unit 2S Lauderhill, FL | 1.0 | 1.5 | 1000 | $2,099 | $2.10 | 5d | 1 | 0.33mi |
| 3710 Inverrary Dr Lauderhill, FL | 1.0 | 1.5 | 900 | $1,674 | $1.86 | 15d | 2 | 0.33mi |
| 2915 NW 60th Ave Sunrise, FL | 2.0 | 2.0 | 1010 | $2,100 | $2.08 | 25d | 1 | 0.34mi |
| 3760 Inverrary Dr Lauderhill, FL | 2.0 | 1.0–2.0 | 800 | $1,900 | $2.38 | 6d | 3 | 0.35mi |
| 6575 W Oakland Park Blvd #218 Lauderhill, FL | 2.0 | 2.0 | 1110 | $2,000 | $1.80 | 25d | 1 | 0.37mi |
| 6575 W Oakland Park Blvd #214 Lauderhill, FL | 2.0 | 2.0 | 1000 | $1,900 | $1.90 | 14d | 1 | 0.37mi |
| 3750 Inverrary Dr Lauderhill, FL | 1.0–2.0 | 1.5–2.0 | 975 | $1,990 | $2.04 | 25d | 3 | 0.39mi |
| 3720 Inverrary Dr Lauderhill, FL | 3.0 | 1.0–2.0 | 940 | $1,950 | $2.07 | 11d | 5 | 0.41mi |
| 6010 S Falls Circle Dr #206 Lauderhill, FL | 2.0 | 2.0 | 1093 | $2,350 | $2.15 | 25d | 1 | 0.45mi |
| 6100 S Falls Circle Dr #204 Lauderhill, FL | 2.0 | 2.0 | 1189 | $1,800 | $1.51 | 18d | 1 | 0.46mi |
| 2759 NW 58th Ter Lauderhill, FL | 3.0 | 2.0 | 1200 | $2,750 | $2.29 | 25d | 1 | 0.47mi |
| 3740 Inverrary Dr Lauderhill, FL | 1.0 | 1.5 | 800 | $1,500 | $1.87 | 19d | 3 | 0.48mi |
| 5648 NW 28th St Unit 5648 Lauderhill, FL | 3.0 | 2.0 | 1200 | $2,400 | $2.00 | 25d | 1 | 0.50mi |
| 6701 W Oakland Park Blvd Fort Lauderdale, FL | 1.0–2.0 | 1.0–2.0 | 1000 | $2,389 | $2.39 | 3d | 9 | 0.50mi |
| 5648 NW 28th St Lauderhill, FL | 3.0 | 2.0 | 1200 | $2,400 | $2.00 | 8d | 1 | 0.50mi |
| 3730 Inverrary Dr Unit 1D Lauderhill, FL | 1.0 | 1.5 | 800 | $1,600 | $2.00 | 25d | 1 | 0.51mi |
HOA detail condo
- Monthly dues
- $799 · $9,588/yr
- Likely covers
- watersewertrashcablelandscapingexterior maint.poolsecurity
- Assessments
- None detected in remarks — confirm with the listing agent.
Listing history 43 events
-
2026-06-13statusdays on market $84,900 Pending 113 DOM
-
2026-06-09days on market $84,900 Active 110 DOM
-
2026-06-07days on market $84,900 Active 108 DOM
-
2026-06-04days on market $84,900 Active 105 DOM
-
2026-06-03days on market $84,900 Active 104 DOM
-
2026-06-02days on market $84,900 Active 103 DOM
-
2026-06-01days on market $84,900 Active 102 DOM
-
2026-05-31days on market $84,900 Active 101 DOM
-
2026-05-15price $84,900
-
2026-05-08status Active
-
2026-04-09status Pending
-
2026-03-24price $99,900
-
2026-03-24price $99,000
-
2026-03-06price $119,900
-
2026-01-19$125,000 Active
-
2024-11-23historical
-
2024-09-30price $110,000
-
2024-07-10price $115,000
-
2024-07-10$117,000 Active
-
2024-07-10historical
-
2024-07-03price $120,000
-
2024-05-01$128,999 Active
-
2024-05-01historical
-
2024-04-09price $130,000
-
2024-03-13price $140,000
-
2023-12-18$145,000 Active
-
2023-06-01historical
-
2023-03-13$147,000 Active
-
2022-07-15soldstatus $147,000
-
2022-07-14soldstatus $143,000 Closed
-
2022-06-03status Pending
-
2022-05-12historical Active Under Contract
-
2022-04-26status Active
-
2022-04-13status Pending
-
2022-04-12historical Active Under Contract
-
2022-04-06$143,000 Active
-
2021-10-25soldstatus $100,000
-
2021-10-20soldstatus $100,000 Closed
-
2021-09-21historical Active Under Contract
-
2021-09-08$110,000 Active
-
2017-05-11soldstatus $46,000
-
2003-08-26soldstatus $74,000
-
2000-07-14soldstatus $41,500
ⓘ Source: listings_history table (triggers on properties + properties_extension) + one-shot
backfill from property_details.listing_events for pre-trigger history.
Tax reassessment forecast FL · Resets to sale price
- Current annual tax
- $2,087 · $174/mo
- Projected year-2 tax
- $2,087 · $174/mo
- Expected delta
- $0/yr ($0/mo · 0.0%)
ⓘ Screening estimate from a state-policy table — verify with the county assessor before closing.
Nearby sold comps map
Loading sold comps map…
Walkable amenities ~0.75 mi
Loading nearby amenities…
Taxation est. · year 1
- Rental income
- $22,472
- − Mortgage interest
- −$4,756
- − Property taxes
- −$2,087
- − Insurance
- −$424
- − Repairs & maintenance
- −$1,798
- − Management
- −$1,798
- − HOA
- −$9,588
- − Depreciation
- −$2,470
- Taxable loss
- −$449
- Est. tax savings @ 24.0%
- +$108
- After-tax cash flow
- $418/yr
For passive investors: Depreciation is non-cash, so a rental often shows a tax loss while cash-flowing — sheltering income. Rental losses are passive: they offset passive income freely, and up to $25,000/yr can offset ordinary (W-2) income if you actively participate and your MAGI is under $100k (phasing out to $0 by $150k); unused losses carry forward. On sale, claimed depreciation is recaptured at up to 25%, and gains may owe capital-gains tax (a 1031 exchange can defer both). Figures are a year-1 estimate at your 24.0% rate — not tax advice; consult a CPA.
Schools (NCES district)
- District
- Broward
- NCES district ID
- 1200180
- Math proficiency
- 42% ▼ -18.00%
- Reading proficiency
- 53% ▼ -5.00%
- Median HH income
- $52,139
- Composite
- 40.88/100
- National rank
- #3621
- State rank
- #46 of 73 in FL
Livability — Lauderhill
- Score
- 79/100
- State rank
- #139
- US rank
- #2059
Category grades
Schools grade is shown separately in the Schools card above.
Census & demographics
- Census place
- Lauderhill, FL
- County
- Broward County · 1,963,430 people
- City population
- 62,807
- Metro
- Miami-Fort Lauderdale-Pompano Beach, FL
- Population (ZIP)
- 54,450
- Household income
- $58,388
- Rent vs Own
- Severe rent burden
- 2809.0
Population outlook (Broward County) Hauer SSP2
- Today (2025)
- 2,207,033 people
- By 2030
- 2,360,704 · +7.0%
- By 2040
- 2,661,208 · +20.6%
- By 2050
- 2,946,698 · +33.5%
- By 2075
- 3,602,273 · +63.2%
- By 2100
- 3,970,984 · +79.9%
Race, ethnicity, and origin ACS 2023
- Neighborhood character
- Diverse neighborhood (Simpson 0.58)
- Race & ethnicity
- Black 61% Hispanic / Latino 17% White 15% Two or more races 11% Asian 4%
- Hispanic origin (detail)
- Puerto Rican 4% Cuban 2% Dominican 1%
- Common ancestry
- Hispanic 13% Romanian 1% Italian 1%
- Foreign-born
- 46% · Canada, Jamaica, Vietnam
- Languages at home
- 64% English-only · Spanish 15% French/Haitian/Cajun 15% Other Indo-European 2%
Political lean MEDSL · Broward
- 2024 margin
- D (+17.0) · D 58.0% · R 41.0%
- 2008→2024 swing
- -17.8pp toward R · 2008: 34.7pp · 2024: 17.0pp
- All cycles
- 2024: D+17.0 2020: D+29.8 2016: D+35.0 2012: D+34.9 2008: D+34.7
Not yet ingested
- Civics
- —
Market trends
- HPI YoY
- ▼ -202.84%
- Current HPI
- 328.4307
- Rent YoY
- ▼ -1.38%
- Metro
- Miami-Fort Lauderdale-Pompano Beach, FL
- State GDP YoY
- ▲ 3.28%
- F500 in state
- 36
Industry mix (Fortune 500 HQ in FL)
| Industry | F500 HQs | Revenue |
|---|---|---|
| Industrial Technology | 2 | $29B |
|
||
| Insurance | 2 | $17B |
|
||
| Retail | 1 | $60B |
|
||
| Technology Distribution | 1 | $58B |
|
||
| Homebuilding | 1 | $35B |
|
||
| Technology Manufacturing | 1 | $35B |
|
||
Price history
+104.6% since first listed35 events — show timeline
- 2026-05-15 Price Changed $84,900 MARMLS
- 2026-05-08 Relisted — MARMLS
- 2026-04-09 Pending — MARMLS
- 2026-03-24 Price Changed $99,900 MARMLS
- 2026-03-24 Price Changed $99,000 MARMLS
- 2026-03-06 Price Changed $119,900 MARMLS
- 2026-01-19 Listed $125,000 MARMLS
- 2024-11-23 Listing Removed — MARMLS
- 2024-09-30 Price Changed $110,000 MARMLS
- 2024-07-10 Price Changed $115,000 MARMLS
- 2024-07-10 Listing Removed — MARMLS
- 2024-07-10 Listed $117,000 MARMLS
- 2024-07-03 Price Changed $120,000 MARMLS
- 2024-05-01 Listing Removed — MARMLS
- 2024-05-01 Listed $128,999 MARMLS
- 2024-04-09 Price Changed $130,000 MARMLS
- 2024-03-13 Price Changed $140,000 MARMLS
- 2023-12-18 Listed $145,000 MARMLS
- 2023-06-01 Listing Removed — Beaches MLS
- 2023-03-13 Listed $147,000 Beaches MLS
- 2022-07-15 Sold (Public Records) $147,000 Public Records
- 2022-07-14 Sold (MLS) $143,000 MARMLS
- 2022-06-03 Pending — MARMLS
- 2022-05-12 Contingent — MARMLS
- 2022-04-26 Relisted — MARMLS
- 2022-04-13 Pending — MARMLS
- 2022-04-12 Contingent — MARMLS
- 2022-04-06 Listed $143,000 MARMLS
- 2021-10-25 Sold (Public Records) $100,000 Public Records
- 2021-10-20 Sold (MLS) $100,000 MARMLS
- 2021-09-21 Contingent — MARMLS
- 2021-09-08 Listed $110,000 MARMLS
- 2017-05-11 Sold (Public Records) $46,000 Public Records
- 2003-08-26 Sold (Public Records) $74,000 Public Records
- 2000-07-14 Sold (Public Records) $41,500 Public Records
Property tax history
+5.3%/yrLatest (2025): $2,087 · -16.7% YoY. Source: county tax records.
Cash-flow waterfall
monthlySold comps — $/sqft
last 12 mo · ≤1 miLoading sold comps…