11 N Quarter Rd · Westhampton, NY
Flood risk 1/10 · Minimal
- FEMA flood zone
- X (unshaded)
- Chance of flooding over 30 yrs
- 0.0%
- Est. flood insurance / yr
- $473 – $860
Fire risk 1/10 · Minimal
- Est. fire insurance / yr
- $691 – $1,283
Heat risk 4/10 · Minor
- Hot days now (above 90°F)
- 7 days/yr
- Hot days in 30 yrs
- 18 days/yr
Wind risk 8/10 · Major
- Chance of severe wind over 30 yrs
- 80.0%
Air-quality risk 4/10 · Minor
- Unhealthy air days now
- 4 days/yr
- Unhealthy air days in 30 yrs
- 5 days/yr
Risk factors via First Street. Map © Google.
Why this score? — see what drove the B- grade
The composite is a weighted blend of 9 inputs, each scored 0–100. Each bar is that input's sub-score; the figure is the points it added to the 100-point composite (weight × sub-score).
- Cash flow +26.8/30.0
- Appreciation +9.4/10.0
- DSCR +9.2/10.0
- Schools +6.6/10.0
- 1% rule +5.9/10.0
- Livability +3.0/5.0
- Rent growth +2.5/5.0
- Condition / age +2.5/5.0
- ARV discount +0.0/15.0
$1,995,000
🖨 Deal sheet 📄 Offer letter ✓ Due diligence
Listing remarks MLS
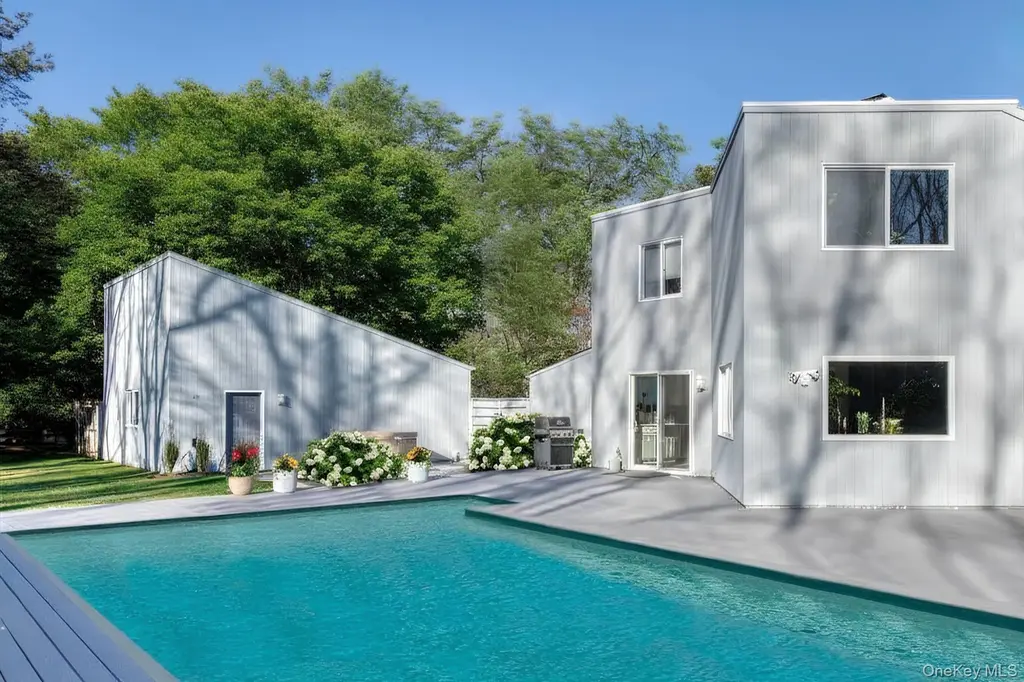
Located just minutes from Westhampton beach Village, this home is the perfect place for entertaining all Summer or Year-long. So whether you are looking to soak up the sun on the large private deck overlooking the pool and hot tub, catch a shooting star while relaxing poolside, enjoy an evening dip in the spa or catch your breath at night by the cozy relaxing fireplace this Hamptons home is ready and waiting to be yours., Additional information: Appearance:Good,Business Located At:,Rental Income:,Separate Hotwater Heater:Yes
Key facts
- Hot tub
- Pool house
- Finished lower level
Tags
Property features AI
Exterior
- Parking: Detached garage; 2-car garage; Driveway parking; Carport: none
- Utilities: Septic tank; Utilities: see remarks
- Home design: Single-family residence
- Construction: Frame construction
- Exterior features: Full yard fencing; Private in-ground saltwater pool with spa combination
Interior
- Kitchen: Stainless steel appliances
- Bedrooms: Includes a bedroom on the first floor
- Bathrooms: 4 full bathrooms
- Heating & cooling: Oil heating; Central air conditioning
- Interior features: First-floor bedroom; Cathedral ceilings; Open floor plan; Full basement
- Laundry & utility: Basement utilities (full basement present)
Neighborhood map
What this means for you Summary
Snapshot
- This is a 4-bed/3.0-bath single-family listed at $2.00M.
Deal economics
- At list price, monthly cash flow is $5k ($65k/yr) — positive.
- The deal already cash-flows at list — no discount required.
- Meets the 1% rule at list price ($22k rent vs $2.00M).
- Recommended offer: $1.94M (3.0% below list) — sets the bar for market timing.
Location & tenants
- Location reads 60/100 on livability (#969 in NY) — a middle-class / working-renter tenant base. Strengths: crime A+, employment A+; Watch: housing C-, amenities F, commute F.
- Westhampton Beach Union Free School District (suburban): math 72% / reading 75% proficiency, ranked #81 of 590 in NY (top 14%) — strong family-tenant draw, lease renewals of 3-5y typical.
- Zoned schools: Westhampton Beach Elementary School (math 67% / reading 67%, grade B+, #525 of 2,108 statewide, top 27%, 356 students, 43% FRL); Westhampton Middle School (math 61% / reading 63%, grade B+, #136 of 729 statewide, top 20%, 434 students, 26% FRL); Westhampton Beach Senior High School (math 90% / reading 96%, grade A+, #147 of 1,100 statewide, top 14%, 964 students, 24% FRL).
- Market conditions: 63 active listings in the ZIP; 8 comparable units currently listed for rent nearby; rentals at typical pace (median 17d on market — plan ~3-4 weeks tenant-placement turnaround); high-income renter base; 1,366 units permitted in Suffolk County in 2024 (216 in 5+ unit buildings).
- At $21,817/mo this rent would consume 173% of the median local household income ($151k/yr) — very limited rent-growth headroom before tenants either downsize or default.
Forward outlook
- In year one you build about $190k of equity ($14k loan paydown + $176k appreciation (8.8% local appreciation)).
- Suffolk County population projected to shrink 5% by 2050 — rents likely to lag national; underwrite the cash flow, not the appreciation.
- At projected returns (8.8% appreciation + 3.0% rent growth), your $559k cash investment doubles in ~3 years — after that, you're playing with house money.
- By year 2, paydown + projected appreciation supports a ~$304k cash-out refi (75% LTV) — recoverable capital for the next deal without selling this one.
Negotiation context
- It's been on market 42 days — a 3% lower offer ($1.94M) is reasonable based on typical stale-listing flexibility.
- 8 sale attempts since 14y ago with the ask held roughly flat each time — persistent listings suggest the price (not the market) is what's stuck; bring a comps-based counter.
- Current owner paid $975k; list at $2.00M implies a 105% gain — meaningful room to come down on a strong offer.
Risks & watch-outs
- Climate carrying-cost: severe wind risk, 80% chance of damaging wind over 30y — expect insurance premiums to compound above CPI over the hold.
Questions for the listing agent
- It's been on market 42 days. Have you received any prior offers? Is the seller open to a 3% concession, seller financing, or rate buy-down credit?
- Is there a deadline driving the sale (1031 exchange, divorce, estate, relocation)? That informs how much negotiation room exists.
- Schools are D-rated, which usually means shorter tenancies and higher turnover. Who's the typical renter profile here, and what's been the actual vacancy rate?
- What's the average days-on-market for RENTAL listings here right now (not sales)? A rising rental-DOM trend means longer vacancies and softer asking-rent achievability than the comps imply.
- What's the recent tenant-quality profile in this submarket — average credit score on applications, eviction rate, late-payment / NSF rate, and stable-employment percentage? A property-management company in the area should have these aggregated.
- How much new for-sale + rental construction is in the pipeline within 1–3 miles? Heavy new supply typically softens prices + rents 12–24 months out; constrained supply supports both.
Investment metrics
- 1% rule
- 1.09% ✓
- Cap rate
- 9.56%
- Cash-on-cash
- 11.67%
- DSCR
- 1.52
- GRM
- 7.6
CMA / ARV
- ARV (median comp)
- $1,640,608
- List price
- $1,995,000
- Delta
- 21.60%
- Verdict
- OVERPRICED
- Comps
- 20 within 1.0 mi
Show comp detail 12 sales within ~0.75 mi
| Address | Dist | Beds/Ba | Sqft | Sold | Price | $/sf | Match |
|---|---|---|---|---|---|---|---|
| 1 Summit Blvd | 0.29mi | 5/3.5 (+1) | 2,400 (+2%) | 7mo | $1,625,000 | $677 | 69 |
| 18 North Quarter Rd | 0.06mi | 4/3.0 | 2,100 (-10%) | 15mo | $1,450,000 | $690 | 68 |
| 12 Summit Blvd | 0.29mi | 3/2.0 (-1) | 2,200 (-6%) | 10mo | $901,000 | $410 | 60 |
| 138A Montauk Hwy | 0.26mi | 4/2.5 | 1,995 (-15%) | 2mo | $1,300,000 | $652 | 59 |
| 57 Jagger Ln | 0.62mi | 4/3.0 | 2,366 (+1%) | 12mo | $1,350,000 | $571 | 59 |
| 84 Montauk Hwy | 0.36mi | 4/4.0 | 2,100 (-10%) | 7mo | $1,686,000 | $803 | 56 |
| 79 Jagger Ln | 0.39mi | 3/2.0 (-1) | 2,041 (-13%) | 0mo | $1,760,000 | $862 | 51 |
| 21 Windwood Ct | 0.41mi | 4/2.5 | 2,006 (-14%) | 5mo | $1,350,000 | $673 | 51 |
| 2 Fiddler Crab Trl | 0.62mi | 4/3.0 | 2,325 (-1%) | 24mo | $1,850,000 | $796 | 50 |
| 15 Windwood Ct | 0.45mi | 3/3.0 (-1) | 2,072 (-12%) | 6mo | $1,485,000 | $717 | 50 |
| 18 Windwood | 0.37mi | 3/1.5 (-1) | 2,500 (+7%) | 18mo | $1,140,000 | $456 | 45 |
| 29 Hollow Ln | 0.33mi | 4/2.5 | 2,660 (+14%) | 21mo | $1,200,000 | $451 | 42 |
Match score weights: distance 35% · size 25% · config 20% · recency 20%. Top-matched comps best support the ARV.
Projected returns pro-forma
8.82% appreciation · 3.0% rent growth · sell at horizon
- IRR
- 30.6%
- Equity multiple
- 3.28×
- Total profit
- $1,273,611
- Equity at exit
- $1,629,070
- IRR
- 26.9%
- Equity multiple
- 7.17×
- Total profit
- $3,446,326
- Equity at exit
- $3,348,299
Cash invested: $558,600 (down + closing). Projections, not guarantees.
Landlord ↔ Tenant lean methodology
- Overall (STATE)
- 15 Strongly Tenant-Friendly
- State New York
- 15 Strongly Tenant-Friendly · D+10
- County
- — inherits STATE
- City
- — inherits STATE
ZIP-level market 11977
- Home prices YoY
- 2.3%
- Active inventory
- 63
- Price-to-rent
- 7.6×
Monthly cashflow live
- Estimated rent
- $21,817 medium interval (Pro) →
- Mortgage (P&I)
- −$10,462
- Tax from tax record
- −$509 /mo · $6,105/yr
- Insurance
- −$831
- HOA
- −$0
- Vacancy / Maint / Mgmt
- −$4,582
- Net cashflow
- $5,434
Break-even live
UW: 25.0% down · 7.5% · 30yr · 1.5% tax · 5.0% vac · 8.0% maint · 8.0% mgmt
Financing live
Cash to close
- Down payment
- $498,750
- Closing costs
- $59,850
- Reserves months
- —
- Total cash needed
- —
Loan-product check · same deal, 3 products live
Conventional
25% down · 7.5% · 30yr
- Down + closing
- —
- Monthly P&I
- —
- Monthly cashflow
- —
- DSCR
- —
- Eligible?
- —
Personal DTI + credit; lowest rate.
DSCR
20% down · 8.5% · 30yr
- Down + closing
- —
- Monthly P&I
- —
- Monthly cashflow
- —
- DSCR
- —
- Eligible?
- —
No personal income docs; deal must DSCR.
Hard money
10% down · 12.0% · 12mo
- Down + closing
- —
- Monthly P&I
- —
- Monthly cashflow
- —
- DSCR
- —
- Eligible?
- —
Short-term bridge; refi at stabilization.
Rent comps 8 comps
| Address | Beds | Baths | Sqft | Rent | $/sqft | DOM | Units | Dist |
|---|---|---|---|---|---|---|---|---|
| 25 N Quarter Rd Westhampton, NY | 4.0 | 3.0 | 2000 | $30,000 | $15.00 | 16d | 1 | 0.20mi |
| 134A Montauk Hwy Westhampton, NY | 4.0 | 3.5 | 2478 | $15,000 | $6.05 | 1d | 1 | 0.22mi |
| 13 Buttercup Ln Westhampton, NY | 3.0 | 4.5 | 3278 | $25,000 | $7.63 | 5d | 1 | 0.23mi |
| 70 Tanners Neck Ln Westhampton, NY | 4.0 | 3.5 | 2100 | $20,000 | $9.52 | 43d | 1 | 0.38mi |
| 70 Jagger Ln Westhampton, NY | 3.0 | 2.0 | 1850 | $22,500 | $12.16 | 1d | 1 | 0.44mi |
| 7 Sea Breeze Ave Westhampton, NY | 5.0 | 3.5 | 2723 | $28,000 | $10.28 | 11d | 1 | 0.63mi |
| 26 Lakeside Ln Westhampton, NY | 5.0 | 4.5 | 2727 | $30,000 | $11.00 | 24d | 1 | 1.15mi |
| 18 Lakeside Ln Westhampton, NY | 4.0 | 2.5 | 2422 | $25,000 | $10.32 | 43d | 1 | 1.17mi |
Listing history 36 events
-
2026-06-18days on market $1,995,000 Active 42 DOM
-
2026-06-17days on market $1,995,000 Active 41 DOM
-
2026-06-16days on market $1,995,000 Active 40 DOM
-
2026-06-15days on market $1,995,000 Active 39 DOM
-
2026-06-13days on market $1,995,000 Active 37 DOM
-
2026-06-09days on market $1,995,000 Active 33 DOM
-
2026-06-08days on market $1,995,000 Active 32 DOM
-
2026-06-07days on market $1,995,000 Active 31 DOM
-
2026-06-04days on market $1,995,000 Active 28 DOM
-
2026-06-03days on market $1,995,000 Active 27 DOM
-
2026-06-02days on market $1,995,000 Active 26 DOM
-
2026-06-01days on market $1,995,000 Active 25 DOM
-
2026-05-31days on market $1,995,000 Active 24 DOM
-
2026-05-07$1,995,000 Active 857-char remark
-
2020-08-28soldstatus $975,000
-
2020-08-10soldstatus $975,000 Closed 530-char remark
Show marketing remark (530 chars)
Located just minutes from Westhampton beach Village, this home is the perfect place for entertaining all Summer or Year-long. So whether you are looking to soak up the sun on the large private deck overlooking the pool and hot tub, catch a shooting star while relaxing poolside, enjoy an evening dip in the spa or catch your breath at night by the cozy relaxing fireplace this Hamptons home is ready and waiting to be yours., Additional information: Appearance:Good,Business Located At:,Rental Income:,Separate Hotwater Heater:Yes
-
2020-05-31$955,000 Active 530-char remark
Show marketing remark (530 chars)
Located just minutes from Westhampton beach Village, this home is the perfect place for entertaining all Summer or Year-long. So whether you are looking to soak up the sun on the large private deck overlooking the pool and hot tub, catch a shooting star while relaxing poolside, enjoy an evening dip in the spa or catch your breath at night by the cozy relaxing fireplace this Hamptons home is ready and waiting to be yours., Additional information: Appearance:Good,Business Located At:,Rental Income:,Separate Hotwater Heater:Yes
-
2020-03-07historical
-
2020-01-11$980,000 New
-
2016-08-30soldstatus $690,000
-
2016-08-12soldstatus $690,000
-
2016-08-12soldstatus $690,000 Closed
-
2016-07-12status Under Contract
-
2016-05-11price $700,000
-
2016-04-19price $750,000
-
2016-04-06price $775,000
-
2016-03-02$799,000 New
-
2016-03-02$700,000
-
2015-09-17historical
-
2014-07-21$849,000
-
2014-04-24historical
-
2013-10-23historical
-
2013-06-22$929,000
-
2012-10-22$949,000
-
1998-11-10soldstatus $325,000
-
1991-08-21soldstatus $240,000
ⓘ Source: listings_history table (triggers on properties + properties_extension) + one-shot
backfill from property_details.listing_events for pre-trigger history.
Tax reassessment forecast NY · Partial reset (capped growth)
- Current annual tax
- $6,105 · $509/mo
- Projected year-2 tax
- $19,910 · $1,659/mo
- Expected delta
- +$13,805/yr (+$1,150/mo · 226.1%)
ⓘ Screening estimate from a state-policy table — verify with the county assessor before closing.
Climate risk First Street
- Flood 1/10 Low FEMA zone X (unshaded) · 0% chance over 30 yrs
- Wildfire 1/10 Low
- Heat 4/10 Moderate 7 d/yr ≥90°F today · 18 d/yr by 30 yrs out
- Wind 8/10 Severe 80% chance of damaging wind over 30 yrs
- Air quality 4/10 Moderate 4 unhealthy d/yr today · 5 by 30 yrs out
Nearby sold comps map
Loading sold comps map…
Walkable amenities ~0.75 mi
Loading nearby amenities…
Taxation est. · year 1
- Rental income
- $261,806
- − Mortgage interest
- −$111,751
- − Property taxes
- −$6,105
- − Insurance
- −$9,975
- − Repairs & maintenance
- −$20,945
- − Management
- −$20,945
- − Depreciation
- −$58,036
- Taxable income
- $34,050
- Est. tax owed @ 24.0%
- −$8,172
- After-tax cash flow
- $57,031/yr
For passive investors: Depreciation is non-cash, so a rental often shows a tax loss while cash-flowing — sheltering income. Rental losses are passive: they offset passive income freely, and up to $25,000/yr can offset ordinary (W-2) income if you actively participate and your MAGI is under $100k (phasing out to $0 by $150k); unused losses carry forward. On sale, claimed depreciation is recaptured at up to 25%, and gains may owe capital-gains tax (a 1031 exchange can defer both). Figures are a year-1 estimate at your 24.0% rate — not tax advice; consult a CPA.
Schools (NCES district)
- District
- Westhampton Beach Union Free School District
- NCES district ID
- 3631020
- Math proficiency
- 72% ▼ -5.00%
- Reading proficiency
- 75% ▲ 3.00%
- Median HH income
- $88,137
- Composite
- 65.91/100
- National rank
- #444
- State rank
- #81 of 590 in NY
Livability — Westhampton
- Score
- 60/100
- State rank
- #969
- US rank
- #18972
Category grades
Schools grade is shown separately in the Schools card above.
Census & demographics
- Census place
- Westhampton, NY
- County
- Suffolk County · 679,920 people
- City population
- 2,843
- Metro
- New York-Newark-Jersey City, NY-NJ-PA
- Population (ZIP)
- 2,843
- Household income
- $151,375
- Rent vs Own
- Severe rent burden
- 14.0
Population outlook (Suffolk County) Hauer SSP2
- Today (2025)
- 1,505,262 people
- By 2030
- 1,498,318 · -0.5%
- By 2040
- 1,471,101 · -2.3%
- By 2050
- 1,424,848 · -5.3%
- By 2075
- 1,337,157 · -11.2%
- By 2100
- 1,217,720 · -19.1%
Race, ethnicity, and origin ACS 2023
- Neighborhood character
- Predominantly White (89%)
- Race & ethnicity
- White 89% Hispanic / Latino 5% Asian 3% Two or more races 2%
- Hispanic origin (detail)
- Common ancestry
- Scotch-Irish 3% Romanian 3% Subsaharan African 1%
- Foreign-born
- 11% · Canada, South Korea
- Languages at home
- 89% English-only · Spanish 5% Other Indo-European 4% Korean 2%
Political lean MEDSL · Suffolk
- 2024 margin
- Lean R (+10.0) · D 45.0% · R 55.0%
- 2008→2024 swing
- -16.0pp toward R · 2008: 6.0pp · 2024: -10.0pp
- All cycles
- 2024: R+10.0 2020: R+0.0 2016: R+8.2 2012: D+2.9 2008: D+6.0
Not yet ingested
- Civics
- —
Market trends
- HPI YoY
- ▲ 8.82%
- Current HPI
- 391.8868
- Rent YoY
- —
- Metro
- New York-Newark-Jersey City, NY-NJ-PA
- State GDP YoY
- ▲ 2.60%
- F500 in state
- 92
Industry mix (Fortune 500 HQ in NY)
| Industry | F500 HQs | Revenue |
|---|---|---|
| Financial Services | 10 | $950B |
|
||
| Consumer Goods | 9 | $162B |
|
||
| Insurance | 4 | $225B |
|
||
| Telecommunications | 2 | $144B |
|
||
| Pharmaceuticals | 2 | $112B |
|
||
| Media / Entertainment | 2 | $69B |
|
||
Price history
+731.2% since first listed23 events — show timeline
- 2026-05-07 Listed $1,995,000 OneKey® MLS as Distributed by MLS Grid
- 2020-08-28 Sold (Public Records) $975,000 Public Records
- 2020-08-10 Sold (MLS) $975,000 OneKey® MLS as Distributed by MLS Grid
- 2020-05-31 Listed $955,000 OneKey® MLS as Distributed by MLS Grid
- 2020-03-07 Listing Removed — OneKey® MLS as Distributed by MLS Grid
- 2020-01-11 Listed $980,000 OneKey® MLS as Distributed by MLS Grid
- 2016-08-30 Sold (Public Records) $690,000 Public Records
- 2016-08-12 Sold (MLS) $690,000 OneKey® MLS as Distributed by MLS Grid
- 2016-08-12 Sold (MLS) $690,000 MLSLI
- 2016-07-12 Pending — MLSLI
- 2016-05-11 Price Changed $700,000 MLSLI
- 2016-04-19 Price Changed $750,000 MLSLI
- 2016-04-06 Price Changed $775,000 MLSLI
- 2016-03-02 Listed $799,000 MLSLI
- 2016-03-02 Listed $700,000 OneKey® MLS as Distributed by MLS Grid
- 2015-09-17 Listing Removed — OneKey® MLS as Distributed by MLS Grid
- 2014-07-21 Listed $849,000 OneKey® MLS as Distributed by MLS Grid
- 2014-04-24 Listing Removed — OneKey® MLS as Distributed by MLS Grid
- 2013-10-23 Listing Removed — OneKey® MLS as Distributed by MLS Grid
- 2013-06-22 Listed $929,000 OneKey® MLS as Distributed by MLS Grid
- 2012-10-22 Listed $949,000 OneKey® MLS as Distributed by MLS Grid
- 1998-11-10 Sold (Public Records) $325,000 Public Records
- 1991-08-21 Sold (Public Records) $240,000 Public Records
Property tax history
-0.1%/yrLatest (2024): $6,105 · +0.0% YoY. Source: county tax records.
Cash-flow waterfall
monthlySold comps — $/sqft
last 12 mo · ≤1 miLoading sold comps…