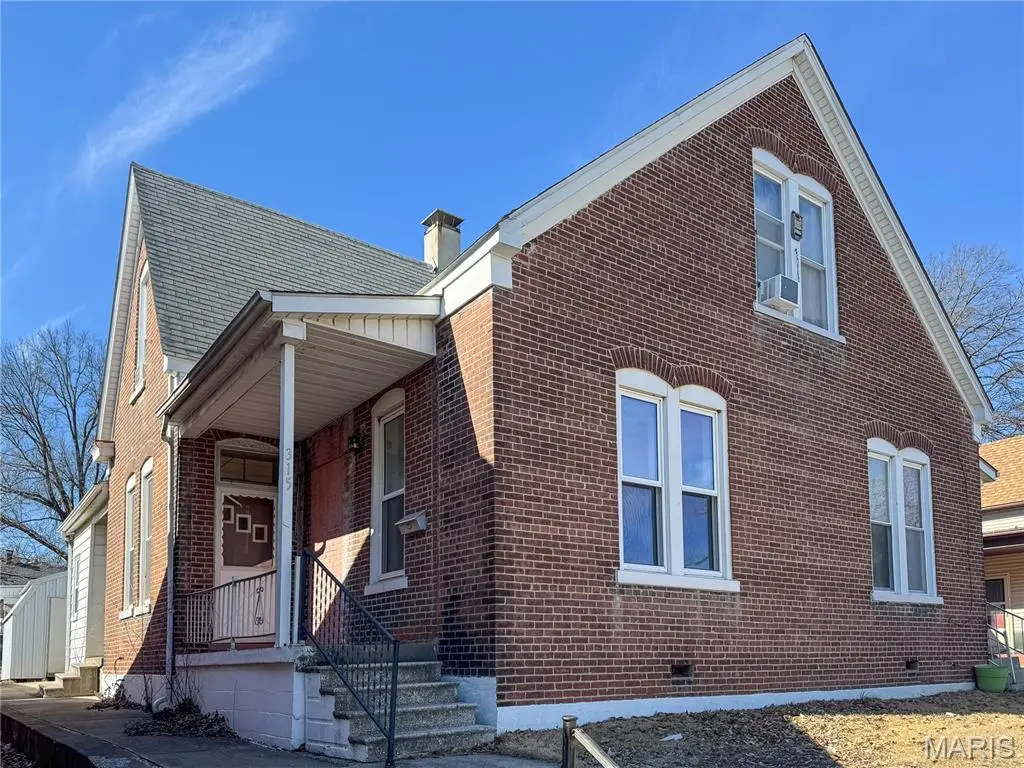
315 N 4th St · Belleville, IL
Flood risk 1/10 · Minimal
- FEMA flood zone
- —
- Chance of flooding over 30 yrs
- 0.0%
- Est. flood insurance / yr
- —
Fire risk 1/10 · Minimal
- Est. fire insurance / yr
- $804 – $1,492
Heat risk 5/10 · Moderate
- Hot days now (above 107°F)
- 7 days/yr
- Hot days in 30 yrs
- 21 days/yr
Wind risk 2/10 · Minimal
- Chance of severe wind over 30 yrs
- 1.0%
Air-quality risk 4/10 · Minor
- Unhealthy air days now
- 3 days/yr
- Unhealthy air days in 30 yrs
- 6 days/yr
Risk factors via First Street. Map © Google.
Why this score? — see what drove the C+ grade
The composite is a weighted blend of 9 inputs, each scored 0–100. Each bar is that input's sub-score; the figure is the points it added to the 100-point composite (weight × sub-score).
- Cash flow +18.5/30.0
- ARV discount +15.0/15.0
- 1% rule +7.3/10.0
- DSCR +5.8/10.0
- Rent growth +5.0/5.0
- Livability +3.9/5.0
- Condition / age +2.5/5.0
- Schools +2.2/10.0
- Appreciation +0.0/10.0
$120,000
🖨 Deal sheet 📄 Offer letter ✓ Due diligence
Listing remarks
Amazing investment opportunity! This duplex features two 1 bedroom, 1 bathroom units, offering strong income potential. One unit is already occupied by a long-term tenant paying $900 per month, providing immediate cash flow. Water, sewer, and trash are billed together, simplifying utility management. Ideal for investors or owner-occupants looking to offset expenses. Convenient layout with functional living spaces in both units. Unit 315 is vacant, please do not disturb tenant in unit 317. Buyer to verify all information including square footage, utilities, and lease details. Agent owned.
Key facts
- 2 parking spots
- Built 1897
- Listed 54 days
Property features AI
Exterior
- Parking: Carport with 2 spaces
- Utilities: Public water; Electricity available; Natural gas available
- Home design: Residential income property; 2–4 unit building (2 total units); One and one-half stories; Single building
- Construction: Brick construction
- Exterior features: Front porch
Interior
- Kitchen: Oven; Refrigerator
- Bedrooms: Two 1-bedroom units
- Bathrooms: Each unit has 1 bathroom
- Heating & cooling: Forced air heating; Central air conditioning
- Interior features: Oven; Refrigerator; Central Air; Forced Air heating
Neighborhood map
What this means for you Summary
Snapshot
- This is a 4-bed/4.0-bath single-family listed at $120k.
Deal economics
- At list price, monthly cash flow is $115 ($1k/yr) — positive.
- The deal already cash-flows at list — no discount required.
- Meets the 1% rule at list price ($1k rent vs $120k).
- Recommended offer: $116k (3.0% below list) — sets the bar for market timing.
- Cap rate 7.4% vs local median 5.6% in Belleville — top-decile yield for the area; either an underpriced asset or a hidden risk that comps aren't pricing in. Stress-test before assuming the spread holds.
Location & tenants
- Location reads 78/100 on livability (#142 in IL, #2,604 nationally) — a middle-class / working-renter tenant base. Strengths: commute A+, cost of living A+, housing A+; Watch: crime F, amenities D-.
- Belleville Twp Hsd 201 (suburban): math 21% / reading 28% proficiency, ranked #308 of 620 in IL (top 50%) — low school quality limits family demand, transient renter base, plan for 1-2y turnover.
- Zoned schools: Belleville High School-East (math 23% / reading 30%, grade F, #241 of 693 statewide, top 35%, 2,568 students, 0% FRL).
- Market conditions: Rents rising fast (+14.5%/yr); 148 active listings in the ZIP; 4 comparable units currently listed for rent nearby; rentals at typical pace (median 18d on market — plan ~3-4 weeks tenant-placement turnaround); 783 units permitted in St. Clair County in 2024 (378 in 5+ unit buildings).
Forward outlook
- Local home prices are declining (-3.0%/yr); year-one equity from $830 of loan paydown is wiped out by about $4k of value loss. Plan a longer hold.
- St. Clair County population projected at -23% by 2050 — secular population decline; favor cash flow + early exit over multi-decade hold.
- At projected returns (-3.0% appreciation + 8.0% rent growth), your $34k cash investment doubles in ~9 years — after that, you're playing with house money.
Negotiation context
- It's been on market 54 days — a 3% lower offer ($116k) is reasonable based on typical stale-listing flexibility.
- 7 sale attempts since 2y ago with the ask held roughly flat each time — persistent listings suggest the price (not the market) is what's stuck; bring a comps-based counter.
- Current owner paid $81k; 48% above their basis — modest negotiation headroom, anchor on the comps not their cost.
Risks & watch-outs
- Watch-outs: property tax is 3.7% of price; built in 1897 — expect roof / HVAC / electrical / plumbing capex.
- Climate carrying-cost: extreme-heat days projected 7→21/yr by 2055 (HVAC capex compounding) — expect insurance premiums to compound above CPI over the hold.
Questions for the listing agent
- It's been on market 54 days. Have you received any prior offers? Is the seller open to a 3% concession, seller financing, or rate buy-down credit?
- Built in 1897 — when were the roof, HVAC, electrical panel, plumbing, and water heater last replaced?
- Property tax is high relative to price — has the assessment been appealed recently, and will the sale trigger a re-assessment?
- Is there a deadline driving the sale (1031 exchange, divorce, estate, relocation)? That informs how much negotiation room exists.
- Crime grade is F in this area — have there been break-ins, vandalism, or insurance claims at this property in the last 3 years? What carrier currently insures it and at what premium?
- What's the average days-on-market for RENTAL listings here right now (not sales)? A rising rental-DOM trend means longer vacancies and softer asking-rent achievability than the comps imply.
- What's the recent tenant-quality profile in this submarket — average credit score on applications, eviction rate, late-payment / NSF rate, and stable-employment percentage? A property-management company in the area should have these aggregated.
- How much new for-sale + rental construction is in the pipeline within 1–3 miles? Heavy new supply typically softens prices + rents 12–24 months out; constrained supply supports both.
Investment metrics
- 1% rule
- 1.23% ✓
- Cap rate
- 7.45%
- Cash-on-cash
- 4.12%
- DSCR
- 1.18
- GRM
- 6.8
CMA / ARV
- ARV (on-the-fly)
- $144,160
- Comps found
- 12
Show comp detail 12 sales within ~0.75 mi
| Address | Dist | Beds/Ba | Sqft | Sold | Price | $/sf | Match |
|---|---|---|---|---|---|---|---|
| 508 W C St | 0.08mi | 3/1.5 (-1) | 1,674 (-7%) | 1mo | $125,000 | $75 | 69 |
| 8 Kircher Pl | 0.61mi | 3/1.5 (-1) | 1,763 (-2%) | 2mo | $185,000 | $105 | 51 |
| 503 N 3rd St | 0.16mi | 5/1.0 (+1) | 2,036 (+13%) | 5mo | $119,900 | $59 | 50 |
| 1305 Raab Ave | 0.74mi | 3/2.0 (-1) | 1,775 (-2%) | 4mo | $180,000 | $101 | 47 |
| 221 Lebanon Ave | 0.52mi | 4/2.0 | 2,000 (+11%) | 4mo | $159,900 | $80 | 46 |
| 931 N First St St | 0.54mi | 3/2.0 (-1) | 1,968 (+9%) | 3mo | $187,500 | $95 | 44 |
| 209 N 14th St | 0.48mi | 3/2.0 (-1) | 2,040 (+13%) | 1mo | $40,000 | $20 | 42 |
| 300 S Jackson St | 0.67mi | 3/2.0 (-1) | 1,675 (-7%) | 5mo | $175,000 | $104 | 40 |
| 604 N 17th St | 0.68mi | 3/2.0 (-1) | 1,925 (+7%) | 7mo | $146,000 | $76 | 38 |
| 221 N Church St | 0.55mi | 3/1.5 (-1) | 1,582 (-12%) | 1mo | $70,000 | $44 | 38 |
| 508 Centreville Ave | 0.61mi | 5/2.0 (+1) | 1,548 (-14%) | 2mo | $185,000 | $120 | 34 |
| 611 Centreville Ave | 0.66mi | 3/2.0 (-1) | 1,538 (-15%) | 1mo | $121,000 | $79 | 31 |
Match score weights: distance 35% · size 25% · config 20% · recency 20%. Top-matched comps best support the ARV.
Projected returns pro-forma
-3.0% appreciation · 8.0% rent growth · sell at horizon
- IRR
- -3.1%
- Equity multiple
- 0.88×
- Total profit
- $-4,158
- Equity at exit
- $17,892
- IRR
- 12.3%
- Equity multiple
- 2.25×
- Total profit
- $41,915
- Equity at exit
- $10,375
Cash invested: $33,600 (down + closing). Projections, not guarantees.
Landlord ↔ Tenant lean methodology
- Overall (STATE)
- 43 Moderately Tenant-Leaning
- State Illinois
- 43 Moderately Tenant-Leaning · D+7
- County
- — inherits STATE
- City
- — inherits STATE
ZIP-level market 62220
- Home prices YoY
- -26.4%
- Rents YoY
- 14.5%
- Active inventory
- 148
- Price-to-rent
- 6.8×
Monthly cashflow live
- Estimated rent
- $1,474 medium interval (Pro) →
- Mortgage (P&I)
- −$629
- Tax from tax record
- −$370 /mo · $4,434/yr
- Insurance
- −$50
- HOA
- −$0
- Vacancy / Maint / Mgmt
- −$309
- Net cashflow
- $115
Break-even live
UW: 25.0% down · 7.5% · 30yr · 1.5% tax · 5.0% vac · 8.0% maint · 8.0% mgmt
Financing live
Cash to close
- Down payment
- $30,000
- Closing costs
- $3,600
- Reserves months
- —
- Total cash needed
- —
Loan-product check · same deal, 3 products live
Conventional
25% down · 7.5% · 30yr
- Down + closing
- —
- Monthly P&I
- —
- Monthly cashflow
- —
- DSCR
- —
- Eligible?
- —
Personal DTI + credit; lowest rate.
DSCR
20% down · 8.5% · 30yr
- Down + closing
- —
- Monthly P&I
- —
- Monthly cashflow
- —
- DSCR
- —
- Eligible?
- —
No personal income docs; deal must DSCR.
Hard money
10% down · 12.0% · 12mo
- Down + closing
- —
- Monthly P&I
- —
- Monthly cashflow
- —
- DSCR
- —
- Eligible?
- —
Short-term bridge; refi at stabilization.
Rent comps 4 comps
| Address | Beds | Baths | Sqft | Rent | $/sqft | DOM | Units | Dist |
|---|---|---|---|---|---|---|---|---|
| 618 W Monroe St Belleville, IL | 3.0 | 1.0 | 1500 | $1,050 | $0.70 | 23d | 1 | 0.57mi |
| 109 S 13th St Belleville, IL | 3.0 | 1.5 | 1800 | $1,325 | $0.74 | 17d | 1 | 0.59mi |
| 1107 Bristow St Belleville, IL | 3.0 | 1.0 | 1238 | $1,500 | $1.21 | 12d | 1 | 0.83mi |
| 1205 3rd Ave Belleville, IL | 4.0 | 2.0 | 1512 | $1,800 | $1.19 | 17d | 1 | 0.95mi |
Listing history 18 events
-
2026-05-11status Pending
-
2026-03-19$120,000 Active
-
2026-03-18historical $120,000
-
2025-12-19historical $825
-
2025-12-07$825
-
2024-11-04historical $825
-
2024-11-02historical $825
-
2024-10-27$825
-
2024-10-23$825
-
2024-10-23historical $825
-
2024-10-17historical $825
-
2024-10-17$825
-
2024-09-26$825
-
2024-09-26historical $825
-
2024-09-23$825
-
2023-08-29soldstatus $81,000
-
1997-04-01soldstatus $55,000
-
1997-04-01soldstatus $55,000
ⓘ Source: listings_history table (triggers on properties + properties_extension) + one-shot
backfill from property_details.listing_events for pre-trigger history.
Tax reassessment forecast IL · Partial reset (capped growth)
- Current annual tax
- $4,434 · $370/mo
- Projected year-2 tax
- $4,434 · $370/mo
- Expected delta
- $0/yr ($0/mo · 0.0%)
ⓘ Screening estimate from a state-policy table — verify with the county assessor before closing.
Climate risk First Street
- Flood 1/10 Low 0% chance over 30 yrs
- Wildfire 1/10 Low
- Heat 5/10 Major 7 d/yr ≥107°F today · 21 d/yr by 30 yrs out
- Wind 2/10 Low 100% chance of damaging wind over 30 yrs
- Air quality 4/10 Moderate 3 unhealthy d/yr today · 6 by 30 yrs out
Nearby sold comps map
Loading sold comps map…
Walkable amenities ~0.75 mi
Loading nearby amenities…
Taxation est. · year 1
- Rental income
- $17,682
- − Mortgage interest
- −$6,722
- − Property taxes
- −$4,434
- − Insurance
- −$600
- − Repairs & maintenance
- −$1,415
- − Management
- −$1,415
- − Depreciation
- −$3,491
- Taxable loss
- −$394
- Est. tax savings @ 24.0%
- +$95
- After-tax cash flow
- $1,478/yr
For passive investors: Depreciation is non-cash, so a rental often shows a tax loss while cash-flowing — sheltering income. Rental losses are passive: they offset passive income freely, and up to $25,000/yr can offset ordinary (W-2) income if you actively participate and your MAGI is under $100k (phasing out to $0 by $150k); unused losses carry forward. On sale, claimed depreciation is recaptured at up to 25%, and gains may owe capital-gains tax (a 1031 exchange can defer both). Figures are a year-1 estimate at your 24.0% rate — not tax advice; consult a CPA.
Schools (NCES district)
- District
- Belleville Twp Hsd 201
- NCES district ID
- 1705640
- Math proficiency
- 21% ▼ -8.00%
- Reading proficiency
- 28% ▼ -3.00%
- Median HH income
- $58,064
- Composite
- 22.39/100
- National rank
- #8115
- State rank
- #308 of 620 in IL
Livability — Belleville
- Score
- 78/100
- State rank
- #142
- US rank
- #2604
Category grades
Schools grade is shown separately in the Schools card above.
Census & demographics
- Census place
- Belleville, IL
- County
- Saint Clair County · 169,691 people
- City population
- 47,407
- Metro
- St. Louis, MO-IL
- Population (ZIP)
- 19,152
- Household income
- $65,952
- Rent vs Own
- Severe rent burden
- 923.0
Population outlook (St. Clair County) Hauer SSP2
- Today (2025)
- 250,366 people
- By 2030
- 240,511 · -3.9%
- By 2040
- 217,391 · -13.2%
- By 2050
- 192,699 · -23.0%
- By 2075
- 140,637 · -43.8%
- By 2100
- 100,499 · -59.9%
Race, ethnicity, and origin ACS 2023
- Neighborhood character
- Predominantly White (67%)
- Race & ethnicity
- White 67% Black 22% Two or more races 6% Hispanic / Latino 3% Asian 1%
- Common ancestry
- Lithuanian 2% Slovak 2% Romanian 2%
- Foreign-born
- 4% · Canada
- Languages at home
- 95% English-only · Arabic 2% Spanish 1% Other Indo-European 1%
Political lean MEDSL · St. Clair
- 2024 margin
- Lean D (+7.9) · D 53.0% · R 45.1% · Other 1.8%
- 2008→2024 swing
- -14.6pp toward R · 2008: 22.4pp · 2024: 7.9pp
- All cycles
- 2024: D+7.9 2020: D+8.7 2016: D+5.6 2012: D+14.5 2008: D+22.4
Not yet ingested
- Civics
- —
Market trends
- HPI YoY
- ▼ -52.27%
- Current HPI
- 145.9237
- Rent YoY
- ▲ 14.47%
- Metro
- St. Louis, MO-IL
- State GDP YoY
- ▲ 1.59%
- F500 in state
- 60
Industry mix (Fortune 500 HQ in IL)
| Industry | F500 HQs | Revenue |
|---|---|---|
| Insurance | 4 | $201B |
|
||
| Consumer Goods | 4 | $87B |
|
||
| Industrial Machinery | 3 | $64B |
|
||
| Healthcare | 2 | $55B |
|
||
| Retail / Pharmacy | 1 | $148B |
|
||
| Agriculture / Food | 1 | $86B |
|
||
Price history
+118.2% since first listed18 events — show timeline
- 2026-05-11 Pending — MARIS as Distributed by MLS Grid
- 2026-03-19 Listed $120,000 MARIS as Distributed by MLS Grid
- 2026-03-18 Coming Soon $120,000 MARIS as Distributed by MLS Grid
- 2025-12-19 Rental Removed $825 RENTALBEAST
- 2025-12-07 Listed for Rent $825 RENTALBEAST
- 2024-11-04 Rental Removed $825 LEASESTAR
- 2024-11-02 Rental Removed $825 RENTALBEAST
- 2024-10-27 Listed for Rent $825 LEASESTAR
- 2024-10-23 Listed for Rent $825 RENTALBEAST
- 2024-10-23 Rental Removed $825 LEASESTAR
- 2024-10-17 Rental Removed $825 RENTALBEAST
- 2024-10-17 Listed for Rent $825 LEASESTAR
- 2024-09-26 Listed for Rent $825 RENTALBEAST
- 2024-09-26 Rental Removed $825 LEASESTAR
- 2024-09-23 Listed for Rent $825 LEASESTAR
- 2023-08-29 Sold (Public Records) $81,000 Public Records
- 1997-04-01 Sold (Public Records) $55,000 Public Records
- 1997-04-01 Sold (Public Records) $55,000 Public Records
Property tax history
+7.9%/yrLatest (2024): $4,434 · -5.2% YoY. Source: county tax records.
Cash-flow waterfall
monthlySold comps — $/sqft
last 12 mo · ≤1 miLoading sold comps…