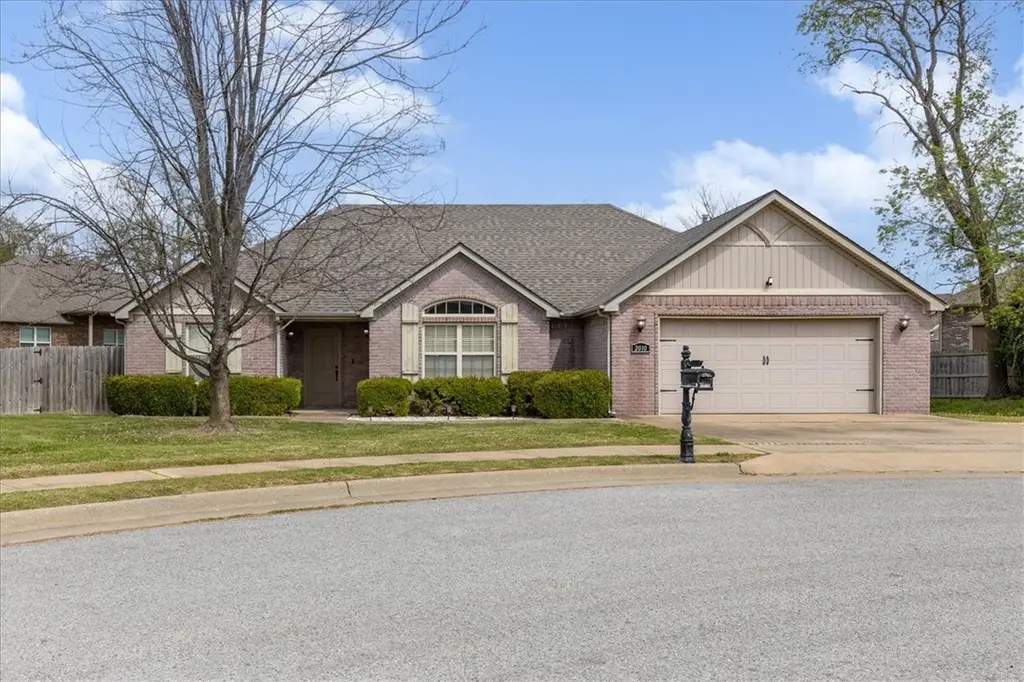
2010 Greenwood Cv · Pea Ridge, AR
Flood risk 1/10 · Minimal
- FEMA flood zone
- X (unshaded)
- Chance of flooding over 30 yrs
- 0.0%
- Est. flood insurance / yr
- $507 – $1,088
Fire risk 5/10 · Moderate
- Est. fire insurance / yr
- $1,499 – $2,785
Heat risk 5/10 · Moderate
- Hot days now (above 105°F)
- 7 days/yr
- Hot days in 30 yrs
- 22 days/yr
Wind risk 2/10 · Minimal
- Chance of severe wind over 30 yrs
- 3.0%
Air-quality risk 2/10 · Minimal
- Unhealthy air days now
- 1 days/yr
- Unhealthy air days in 30 yrs
- 1 days/yr
Risk factors via First Street. Map © Google.
Why this score? — see what drove the D- grade
The composite is a weighted blend of 9 inputs, each scored 0–100. Each bar is that input's sub-score; the figure is the points it added to the 100-point composite (weight × sub-score).
- ARV discount +11.8/15.0
- Appreciation +8.7/10.0
- Cash flow +5.9/30.0
- Schools +3.7/10.0
- Livability +3.4/5.0
- Rent growth +2.5/5.0
- Condition / age +2.5/5.0
- 1% rule +0.5/10.0
- DSCR +0.3/10.0
$335,000
🖨 Deal sheet 📄 Offer letter ✓ Due diligence
Listing remarks MLS
Beautiful details in this hidden Gem better than all the new construction. 3 large bedrooms with detailed ceilings throughout. Formal dining room is a great flex room with an alcove with lighting. Covered back porch, privacy fenced backyard . 30-acre lot at the end of a cul-de-sac. Part of the up-and-coming Pea Ridge community. Wood look title floors. Separate laundry room. Primary suite has huge walk-in closet, walk-in shower and jetted tub. When you view notice the ceilings.
Key facts
- Fenced back yard
- Primary suite
- Walk-in shower
Tags
Neighborhood map
What this means for you Summary
Snapshot
- This is a 3-bed/2.0-bath single-family listed at $335k.
Deal economics
- At list price, monthly cash flow is $-654 ($-8k/yr) — negative.
- To cash-flow at today's rent, offer at most $219k (34.5% below list).
- To meet the 1% rule (rent ≥ 1% of price), the offer needs to be $185k (44.8% below list).
- Recommended offer: $185k (44.8% below list) — sets the bar for 1% rule.
Location & tenants
- Location reads 67/100 on livability (#98 in AR) — a middle-class / working-renter tenant base. Strengths: employment A+, housing A+, cost of living A-; Watch: amenities F, commute F.
- Pea Ridge School District (suburban): math 43% / reading 42% proficiency, ranked #43 of 238 in AR (top 18%) — families likely to look elsewhere, expect single-tenant / working-renter base with shorter leases.
- Market conditions: 423 active listings in the ZIP; 35 comparable units currently listed for rent nearby; rentals at typical pace (median 23d on market — plan ~3-4 weeks tenant-placement turnaround); 43% of comp listings sitting > 30 days — soft ceiling on asking rent; solid renter incomes; 4,359 units permitted in Benton County in 2024 (402 in 5+ unit buildings).
Forward outlook
- In year one you build about $27k of equity ($2k loan paydown + $25k appreciation (7.5% local appreciation)).
- Benton County population projected at +56% by 2050 — long-run rental-demand tailwind backs the buy-and-hold thesis.
- By year 2, paydown + projected appreciation supports a ~$44k cash-out refi (75% LTV) — recoverable capital for the next deal without selling this one.
Negotiation context
- It's been on market 100 days — a 9% lower offer ($305k) is reasonable based on typical stale-listing flexibility.
- 2 sale attempts since 10y ago with the ask held roughly flat each time — persistent listings suggest the price (not the market) is what's stuck; bring a comps-based counter.
- Current owner paid $110k; list at $335k implies a 205% gain — meaningful room to come down on a strong offer.
Risks & watch-outs
- Climate carrying-cost: moderate wildfire risk; extreme-heat days projected 7→22/yr by 2055 (HVAC capex compounding) — expect insurance premiums to compound above CPI over the hold.
Questions for the listing agent
- What do current leases actually rent for vs. the listed asking? Can we see a recent rent roll and the last 12 months of T-12 income?
- It's been on market 100 days. Have you received any prior offers? Is the seller open to a 45% concession, seller financing, or rate buy-down credit?
- Why hasn't it sold? Are there any deal-killer items the seller is aware of (foundation, flood, title, zoning, code violations)?
- Is there a deadline driving the sale (1031 exchange, divorce, estate, relocation)? That informs how much negotiation room exists.
- The area grade is low — what's the realistic commute time and amenity access for the typical tenant pool here? Any planned neighborhood developments (good or bad) we should know about?
- What's the average days-on-market for RENTAL listings here right now (not sales)? A rising rental-DOM trend means longer vacancies and softer asking-rent achievability than the comps imply.
- What's the recent tenant-quality profile in this submarket — average credit score on applications, eviction rate, late-payment / NSF rate, and stable-employment percentage? A property-management company in the area should have these aggregated.
- How much new for-sale + rental construction is in the pipeline within 1–3 miles? Heavy new supply typically softens prices + rents 12–24 months out; constrained supply supports both.
Investment metrics
- 1% rule
- 0.55% ✗
- Cap rate
- 3.95%
- Cash-on-cash
- -8.37%
- DSCR
- 0.63
- GRM
- 15.1
CMA / ARV
- ARV (median comp)
- $370,645
- List price
- $335,000
- Delta
- -9.62%
- Verdict
- FAIR
- Comps
- 20 within 1.0 mi
Show comp detail 12 sales within ~0.75 mi
| Address | Dist | Beds/Ba | Sqft | Sold | Price | $/sf | Match |
|---|---|---|---|---|---|---|---|
| 1933 & 1911 Hazelton Rd | 0.10mi | 3/1.5 | 1,638 (-5%) | 3mo | $511,000 | $312 | 82 |
| 2420 England Ln | 0.61mi | 3/2.0 | 1,730 (-0%) | 2mo | $345,000 | $199 | 70 |
| 1101 Tracey Ln | 0.20mi | 4/2.0 (+1) | 1,934 (+12%) | 5mo | $359,000 | $186 | 62 |
| 2224 Crane Ave | 0.70mi | 3/2.0 | 1,792 (+4%) | 1mo | $389,250 | $217 | 60 |
| 500 Jackson Ln | 0.38mi | 4/2.0 (+1) | 1,563 (-10%) | 4mo | $335,000 | $214 | 58 |
| 205 Ross Salvage Rd | 0.74mi | 4/2.0 (+1) | 1,717 (-1%) | 1mo | $350,000 | $204 | 58 |
| 1412 Hutchinson St | 0.59mi | 3/2.0 | 1,580 (-9%) | 4mo | $289,500 | $183 | 54 |
| 2234 Crane Ave | 0.72mi | 4/2.0 (+1) | 1,815 (+5%) | 0mo | $394,500 | $217 | 53 |
| 2221 Crane Ave | 0.66mi | 3/2.5 | 1,946 (+12%) | 0mo | $399,900 | $205 | 46 |
| 1909 Hale Ln | 0.70mi | 3/2.5 | 1,946 (+12%) | 1mo | $401,500 | $206 | 44 |
| 2225 Crane Ave | 0.67mi | 4/2.5 (+1) | 1,976 (+14%) | 1mo | $399,900 | $202 | 38 |
| 1913 Hale Ln | 0.72mi | 4/2.5 (+1) | 1,976 (+14%) | 5mo | $401,400 | $203 | 32 |
Match score weights: distance 35% · size 25% · config 20% · recency 20%. Top-matched comps best support the ARV.
Projected returns pro-forma
7.48% appreciation · 3.0% rent growth · sell at horizon
- IRR
- 12.4%
- Equity multiple
- 1.91×
- Total profit
- $85,142
- Equity at exit
- $242,680
- IRR
- 12.9%
- Equity multiple
- 3.96×
- Total profit
- $277,748
- Equity at exit
- $470,852
Cash invested: $93,800 (down + closing). Projections, not guarantees.
Landlord ↔ Tenant lean methodology
- Overall (STATE)
- 92 Strongly Landlord-Friendly
- State Arkansas
- 92 Strongly Landlord-Friendly · R+14
- County
- — inherits STATE
- City
- — inherits STATE
ZIP-level market 72751
- Home prices YoY
- 2.2%
- Active inventory
- 423
- Price-to-rent
- 15.1×
Monthly cashflow live
- Estimated rent
- $1,850 high interval (Pro) →
- Mortgage (P&I)
- −$1,757
- Tax from tax record
- −$219 /mo · $2,631/yr
- Insurance
- −$140
- HOA
- −$0
- Vacancy / Maint / Mgmt
- −$389
- Net cashflow
- $-654
Break-even live
UW: 25.0% down · 7.5% · 30yr · 1.5% tax · 5.0% vac · 8.0% maint · 8.0% mgmt
Financing live
Cash to close
- Down payment
- $83,750
- Closing costs
- $10,050
- Reserves months
- —
- Total cash needed
- —
Loan-product check · same deal, 3 products live
Conventional
25% down · 7.5% · 30yr
- Down + closing
- —
- Monthly P&I
- —
- Monthly cashflow
- —
- DSCR
- —
- Eligible?
- —
Personal DTI + credit; lowest rate.
DSCR
20% down · 8.5% · 30yr
- Down + closing
- —
- Monthly P&I
- —
- Monthly cashflow
- —
- DSCR
- —
- Eligible?
- —
No personal income docs; deal must DSCR.
Hard money
10% down · 12.0% · 12mo
- Down + closing
- —
- Monthly P&I
- —
- Monthly cashflow
- —
- DSCR
- —
- Eligible?
- —
Short-term bridge; refi at stabilization.
Rent comps 35 comps
| Address | Beds | Baths | Sqft | Rent | $/sqft | DOM | Units | Dist |
|---|---|---|---|---|---|---|---|---|
| 1006 Seaborn Way Pea Ridge, AR | 3.0 | 2.5 | 1750 | $1,650 | $0.94 | 43d | 1 | 0.09mi |
| 1002 Seaborn Way Pea Ridge, AR | 3.0 | 2.0 | 1750 | $1,650 | $0.94 | 43d | 1 | 0.11mi |
| 942 Seaborn Way Pea Ridge, AR | 3.0 | 2.5 | 1750 | $1,650 | $0.94 | 43d | 1 | 0.12mi |
| 940 Seaborn Way Pea Ridge, AR | 3.0 | 2.5 | 1750 | $1,650 | $0.94 | 43d | 1 | 0.13mi |
| 938 Seaborn Way Pea Ridge, AR | 3.0 | 2.5 | 1750 | $1,650 | $0.94 | 43d | 1 | 0.14mi |
| 938 Seaborn Way Pea Ridge, AR | 3.0 | 2.5 | 1750 | $1,650 | $0.94 | 23d | 1 | 0.14mi |
| 1036 Tracey Ln Pea Ridge, AR | 4.0 | 2.0 | 1911 | $2,075 | $1.09 | 23d | 1 | 0.21mi |
| 1812 Seay Cir Pea Ridge, AR | 4.0 | 2.5 | 1854 | $1,900 | $1.02 | 44d | 1 | 0.23mi |
| 801 Lewis St Pea Ridge, AR | 3.0 | 2.0 | 1744 | $2,000 | $1.15 | 13d | 1 | 0.40mi |
| 536 Lewis St Pea Ridge, AR | 3.0 | 2.0 | 1649 | $1,995 | $1.21 | 21d | 1 | 0.48mi |
| 1393 Hutchinson St Pea Ridge, AR | 3.0 | 2.0 | 1580 | $1,675 | $1.06 | 43d | 1 | 0.54mi |
| 2415 England Ln Pea Ridge, AR | 3.0 | 2.0 | 1678 | $2,600 | $1.55 | 14d | 1 | 0.63mi |
| 1910 Hahn St Pea Ridge, AR | 3.0 | 2.0 | 1555 | $1,900 | $1.22 | 43d | 1 | 0.71mi |
| 2301 Langford St Pea Ridge, AR | 3.0 | 2.0 | 1637 | $1,800 | $1.10 | 21d | 1 | 0.72mi |
| 1723 Booker Cir Pea Ridge, AR | 3.0 | 2.0 | 1056 | $1,650 | $1.56 | 23d | 1 | 0.84mi |
| 112 Alder St Pea Ridge, AR | 3.0 | 2.0 | 1350 | $1,625 | $1.20 | 44d | 1 | 0.84mi |
| 1735 Booker Cir Pea Ridge, AR | 3.0 | 2.0 | 1056 | $1,525 | $1.44 | 21d | 1 | 0.86mi |
| 1400 Hickery St Pea Ridge, AR | 3.0 | 2.0 | 1400 | $1,700 | $1.21 | 21d | 1 | 0.86mi |
| 1801 Booker Cir Pea Ridge, AR | 3.0 | 2.0 | 1056 | $1,525 | $1.44 | 43d | 1 | 0.87mi |
| 1914 Booker Cir Pea Ridge, AR | 2.0 | 2.0 | 1052 | $1,525 | $1.45 | 21d | 1 | 0.87mi |
| 1803 Booker Cir Pea Ridge, AR | 3.0 | 2.0 | 1056 | $1,525 | $1.44 | 14d | 1 | 0.89mi |
| 1711 Cuppett Cir Pea Ridge, AR | 3.0 | 2.5 | 1604 | $1,750 | $1.09 | 23d | 1 | 0.89mi |
| 1703 Booker Cir Pea Ridge, AR | 3.0 | 2.0 | 1056 | $1,525 | $1.44 | 14d | 1 | 0.90mi |
| 1713 Cuppett Cir Pea Ridge, AR | 3.0 | 2.5 | 1503 | $1,650 | $1.10 | 23d | 1 | 0.90mi |
| 308 Alder St Pea Ridge, AR | 3.0 | 2.0 | 1425 | $1,625 | $1.14 | 23d | 1 | 0.94mi |
| 308 Alder St Pea Ridge, AR | 3.0 | 2.0 | 1425 | $1,625 | $1.14 | 43d | 1 | 0.94mi |
| 581 W Pickens Rd Pea Ridge, AR | 3.0 | 2.5 | 1500 | $1,600 | $1.07 | 43d | 1 | 1.02mi |
| 575 W Pickens Rd Pea Ridge, AR | 3.0 | 2.5 | 1500 | $1,600 | $1.07 | 43d | 1 | 1.02mi |
| 547 W Pickens Rd Pea Ridge, AR | 3.0 | 2.5 | 1500 | $1,600 | $1.07 | 14d | 1 | 1.04mi |
| 533 W Pickens Rd Pea Ridge, AR | 3.0 | 2.5 | 1500 | $1,600 | $1.07 | 14d | 1 | 1.05mi |
| 521 W Pickens Rd Pea Ridge, AR | 3.0 | 2.5 | 1500 | $1,600 | $1.07 | 14d | 1 | 1.06mi |
| 585 Lynn Dr Pea Ridge, AR | 3.0 | 2.0 | 1804 | $1,650 | $0.91 | 43d | 1 | 1.09mi |
| 2720 Gorman St Pea Ridge, AR | 3.0 | 2.0 | 1480 | $1,695 | $1.15 | 14d | 1 | 1.35mi |
| 2813 Reynolds St Pea Ridge, AR | 3.0 | 2.0 | 1422 | $1,795 | $1.26 | 14d | 1 | 1.41mi |
| 2608 Chittick St Pea Ridge, AR | 4.0 | 2.0 | 1630 | $1,795 | $1.10 | 43d | 1 | 1.50mi |
Listing history 17 events
-
2026-06-17days on market $335,000 Active 100 DOM
-
2026-06-16days on market $335,000 Active 99 DOM
-
2026-06-15days on market $335,000 Active 98 DOM
-
2026-06-14days on market $335,000 Active 96 DOM
-
2026-06-13days on market $335,000 Active 95 DOM
-
2026-06-10days on market $335,000 Active 93 DOM
-
2026-06-09days on market $335,000 Active 92 DOM
-
2026-06-08days on market $335,000 Active 91 DOM
-
2026-06-07days on market $335,000 Active 90 DOM
-
2026-06-03days on market $335,000 Active 86 DOM
-
2026-06-02days on market $335,000 Active 85 DOM
-
2026-06-01days on market $335,000 Active 84 DOM
-
2026-05-31days on market $335,000 Active 83 DOM
-
2026-05-31days on market $335,000 Active 82 DOM
-
2026-03-09$335,000 Active 481-char remark
Show marketing remark (481 chars)
Beautiful details in this hidden Gem better than all the new construction. 3 large bedrooms with detailed ceilings throughout. Formal dining room is a great flex room with an alcove with lighting. Covered back porch, privacy fenced backyard . 30-acre lot at the end of a cul-de-sac. Part of the up-and-coming Pea Ridge community. Wood look title floors. Separate laundry room. Primary suite has huge walk-in closet, walk-in shower and jetted tub. When you view notice the ceilings.
-
2016-02-19soldstatus $110,000 83-char remark
Show marketing remark (83 chars)
Bank owned property, SOLD AS IS. Great for investors, won't go FHA or conventional.
-
2016-01-08$103,200 83-char remark
Show marketing remark (83 chars)
Bank owned property, SOLD AS IS. Great for investors, won't go FHA or conventional.
ⓘ Source: listings_history table (triggers on properties + properties_extension) + one-shot
backfill from property_details.listing_events for pre-trigger history.
Tax reassessment forecast AR · Resets to sale price
- Current annual tax
- $2,631 · $219/mo
- Projected year-2 tax
- $2,631 · $219/mo
- Expected delta
- $0/yr ($0/mo · 0.0%)
ⓘ Screening estimate from a state-policy table — verify with the county assessor before closing.
Climate risk First Street
- Flood 1/10 Low FEMA zone X (unshaded) · 0% chance over 30 yrs
- Wildfire 5/10 Major
- Heat 5/10 Major 7 d/yr ≥105°F today · 22 d/yr by 30 yrs out
- Wind 2/10 Low 3% chance of damaging wind over 30 yrs
- Air quality 2/10 Low 1 unhealthy d/yr today · 1 by 30 yrs out
Nearby sold comps map
Loading sold comps map…
Walkable amenities ~0.75 mi
Loading nearby amenities…
Taxation est. · year 1
- Rental income
- $22,204
- − Mortgage interest
- −$18,765
- − Property taxes
- −$2,631
- − Insurance
- −$1,675
- − Repairs & maintenance
- −$1,776
- − Management
- −$1,776
- − Depreciation
- −$9,745
- Taxable loss
- −$14,166
- Est. tax savings @ 24.0%
- +$3,400
- After-tax cash flow
- $-4,447/yr
For passive investors: Depreciation is non-cash, so a rental often shows a tax loss while cash-flowing — sheltering income. Rental losses are passive: they offset passive income freely, and up to $25,000/yr can offset ordinary (W-2) income if you actively participate and your MAGI is under $100k (phasing out to $0 by $150k); unused losses carry forward. On sale, claimed depreciation is recaptured at up to 25%, and gains may owe capital-gains tax (a 1031 exchange can defer both). Figures are a year-1 estimate at your 24.0% rate — not tax advice; consult a CPA.
Schools (NCES district)
- District
- Pea Ridge School District
- NCES district ID
- 0503030
- Math proficiency
- 43% ▼ -3.00%
- Reading proficiency
- 42% ▼ -8.00%
- Median HH income
- $53,156
- Composite
- 36.88/100
- National rank
- #4546
- State rank
- #43 of 238 in AR
Livability — Pea Ridge
- Score
- 67/100
- State rank
- #98
- US rank
- #10429
Category grades
Schools grade is shown separately in the Schools card above.
Census & demographics
- Census place
- Pea Ridge, AR
- County
- Benton County · 259,241 people
- City population
- 9,997
- Metro
- Fayetteville-Springdale-Rogers, AR
- Population (ZIP)
- 9,997
- Household income
- $95,299
- Rent vs Own
- Severe rent burden
- 83.0
Population outlook (Benton County) Hauer SSP2
- Today (2025)
- 318,683 people
- By 2030
- 353,481 · +10.9%
- By 2040
- 425,280 · +33.4%
- By 2050
- 497,239 · +56.0%
- By 2075
- 662,114 · +107.8%
- By 2100
- 776,431 · +143.6%
Race, ethnicity, and origin ACS 2023
- Neighborhood character
- Predominantly White (72%)
- Race & ethnicity
- White 72% Two or more races 17% Hispanic / Latino 7% Black 3%
- Hispanic origin (detail)
- Mexican 5%
- Common ancestry
- Slovak 4% Scottish 2% Lithuanian 2%
- Foreign-born
- 7% · Canada, Vietnam
- Languages at home
- 97% English-only · Spanish 2% Vietnamese 1%
Political lean MEDSL · Benton
- 2024 margin
- Strong R (+27.0) · D 35.2% · R 62.1% · Other 2.7%
- 2008→2024 swing
- +9.6pp toward D · 2008: -36.5pp · 2024: -27.0pp
- All cycles
- 2024: R+27.0 2020: R+26.4 2016: R+34.9 2012: R+40.4 2008: R+36.5
Not yet ingested
- Civics
- —
Market trends
- HPI YoY
- ▲ 7.48%
- Current HPI
- 352.7133
- Rent YoY
- —
- Metro
- Fayetteville-Springdale-Rogers, AR
- State GDP YoY
- ▲ 3.80%
- F500 in state
- 10
Industry mix (Fortune 500 HQ in AR)
| Industry | F500 HQs | Revenue |
|---|---|---|
| Retail | 1 | $681B |
|
||
| Food / Agriculture | 1 | $53B |
|
||
| Retail / Energy | 1 | $22B |
|
||
| Transportation / Logistics | 1 | $12B |
|
||
| Energy | 1 | $4B |
|
||
Price history
+224.6% since first listed3 events — show timeline
- 2026-03-09 Listed $335,000 NWARMLS
- 2016-02-19 Sold (MLS) $110,000 NWARMLS
- 2016-01-08 Listed $103,200 NWARMLS
Property tax history
+6.2%/yrLatest (2025): $2,631 · +10.7% YoY. Source: county tax records.
Cash-flow waterfall
monthlySold comps — $/sqft
last 12 mo · ≤1 miLoading sold comps…