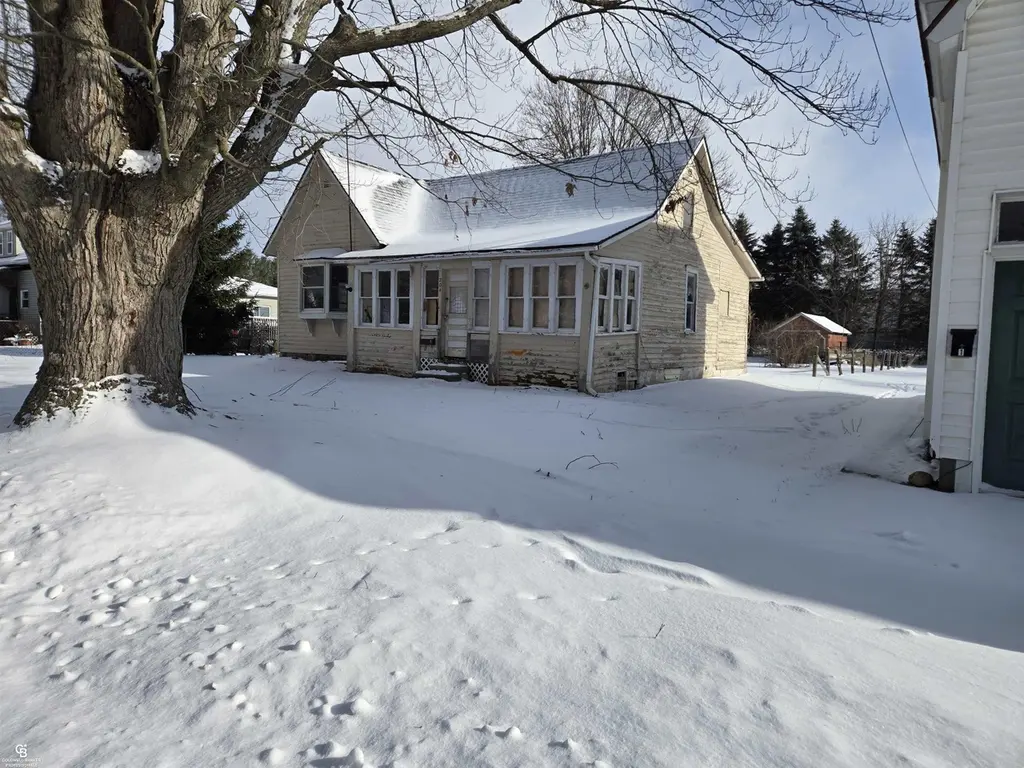
204 Mary St · Yale, MI
Flood risk 1/10 · Minimal
- FEMA flood zone
- X (unshaded)
- Chance of flooding over 30 yrs
- 0.0%
- Est. flood insurance / yr
- $507 – $1,088
Fire risk 1/10 · Minimal
- Est. fire insurance / yr
- $784 – $1,456
Heat risk 2/10 · Minimal
- Hot days now (above 95°F)
- 7 days/yr
- Hot days in 30 yrs
- 14 days/yr
Wind risk 1/10 · Minimal
- Chance of severe wind over 30 yrs
- —
Air-quality risk 3/10 · Minor
- Unhealthy air days now
- 2 days/yr
- Unhealthy air days in 30 yrs
- 4 days/yr
Risk factors via First Street. Map © Google.
Why this score? — see what drove the B grade
The composite is a weighted blend of 9 inputs, each scored 0–100. Each bar is that input's sub-score; the figure is the points it added to the 100-point composite (weight × sub-score).
- Cash flow +30.0/30.0
- 1% rule +10.0/10.0
- DSCR +10.0/10.0
- ARV discount +7.5/15.0
- Schools +4.4/10.0
- Livability +3.3/5.0
- Rent growth +2.5/5.0
- Condition / age +2.5/5.0
- Appreciation +0.0/10.0
$59,000
🖨 Deal sheet 📄 Offer letter ✓ Due diligence
Listing remarks MLS
Small ranch with much potential. Home has an extra deep lot. Does need some work, but is priced accordingly. Has enclosed front porch. Located on a nice tree-lined street. With a some work, could be a nice home.
Key facts
- Extra deep lot
- Tree-lined street
- Enclosed front porch
Tags
Neighborhood map
What this means for you Summary
Snapshot
- This is a 2-bed/1.0-bath single-family listed at $59k.
Deal economics
- At list price, monthly cash flow is $406 ($5k/yr) — positive.
- The deal already cash-flows at list — no discount required.
- Meets the 1% rule at list price ($1k rent vs $59k).
- Recommended offer: $52k (12.0% below list) — sets the bar for market timing.
Location & tenants
- Location reads 66/100 on livability (#432 in MI) — a middle-class / working-renter tenant base. Strengths: cost of living A+, housing A+, schools B; Watch: amenities F, commute F, employment F.
- Yale Public Schools (rural): math 40% / reading 62% proficiency, ranked #92 of 540 in MI (top 17%) — acceptable for families but not a draw, mixed tenant base, ~2y average lease.
- Market conditions: 47 active listings in the ZIP; 5 comparable units currently listed for rent nearby; rentals leasing fast (median 2d on market — plan ~1-2 weeks tenant-placement turnaround); 232 units permitted in St. Clair County in 2024 (0 in 5+ unit buildings).
Forward outlook
- Local home prices are declining (-3.0%/yr); year-one equity from $408 of loan paydown is wiped out by about $2k of value loss. Plan a longer hold.
- St. Clair County population projected at -20% by 2050 — secular population decline; favor cash flow + early exit over multi-decade hold.
- At projected returns (-3.0% appreciation + 3.0% rent growth), your $17k cash investment doubles in ~5 years — after that, you're playing with house money.
Negotiation context
- It's been on market 133 days — a 12% lower offer ($52k) is reasonable based on typical stale-listing flexibility.
- 2 sale attempts; this cycle's ask has dropped $10k (14%) from the opening price — seller is motivated, your offer sets the floor, not the list.
Risks & watch-outs
- Watch-outs: built in 1910 — expect roof / HVAC / electrical / plumbing capex.
Questions for the listing agent
- It's been on market 133 days. Have you received any prior offers? Is the seller open to a 12% concession, seller financing, or rate buy-down credit?
- Built in 1910 — when were the roof, HVAC, electrical panel, plumbing, and water heater last replaced?
- Why hasn't it sold? Are there any deal-killer items the seller is aware of (foundation, flood, title, zoning, code violations)?
- Is there a deadline driving the sale (1031 exchange, divorce, estate, relocation)? That informs how much negotiation room exists.
- Schools are B-rated — typically a magnet for longer-tenancy family renters. What's the average tenant stay here, and is there a school-zone premium baked into asking?
- What's the average days-on-market for RENTAL listings here right now (not sales)? A rising rental-DOM trend means longer vacancies and softer asking-rent achievability than the comps imply.
- What's the recent tenant-quality profile in this submarket — average credit score on applications, eviction rate, late-payment / NSF rate, and stable-employment percentage? A property-management company in the area should have these aggregated.
- How much new for-sale + rental construction is in the pipeline within 1–3 miles? Heavy new supply typically softens prices + rents 12–24 months out; constrained supply supports both.
Investment metrics
- 1% rule
- 1.69% ✓
- Cap rate
- 14.55%
- Cash-on-cash
- 29.49%
- DSCR
- 2.31
- GRM
- 4.9
CMA / ARV
- ARV (median comp)
- $145,772
- List price
- $59,000
- Delta
- -59.53%
- Verdict
- UNDERPRICED
- Comps
- 20 within 1.0 mi
Show comp detail 8 sales within ~0.75 mi
| Address | Dist | Beds/Ba | Sqft | Sold | Price | $/sf | Match |
|---|---|---|---|---|---|---|---|
| 2 Spring St | 0.09mi | 3/1.0 (+1) | 1,000 (+10%) | 9mo | $120,000 | $120 | 67 |
| 207 Jones St | 0.31mi | 3/1.0 (+1) | 908 (-0%) | 18mo | $140,000 | $154 | 65 |
| 208 Arthur St | 0.47mi | 3/1.0 (+1) | 927 (+2%) | 6mo | $120,000 | $129 | 65 |
| 12 Clarence St | 0.27mi | 3/1.0 (+1) | 844 (-7%) | 12mo | $118,000 | $140 | 61 |
| 303 N Kennefic St | 0.58mi | 3/1.0 (+1) | 933 (+2%) | 8mo | $165,000 | $177 | 57 |
| 101 Morrell St | 0.46mi | 2/1.0 | 1,008 (+11%) | 8mo | $140,000 | $139 | 54 |
| 205 Guy St | 0.38mi | 2/1.0 | 832 (-9%) | 23mo | $150,000 | $180 | 49 |
| 5 Livingston St | 0.39mi | 2/1.0 | 785 (-14%) | 18mo | $136,000 | $173 | 44 |
Match score weights: distance 35% · size 25% · config 20% · recency 20%. Top-matched comps best support the ARV.
Projected returns pro-forma
-3.0% appreciation · 3.0% rent growth · sell at horizon
- IRR
- 24.0%
- Equity multiple
- 1.99×
- Total profit
- $16,295
- Equity at exit
- $8,797
- IRR
- 31.8%
- Equity multiple
- 3.87×
- Total profit
- $47,483
- Equity at exit
- $5,101
Cash invested: $16,520 (down + closing). Projections, not guarantees.
Landlord ↔ Tenant lean methodology
- Overall (STATE)
- 62 Landlord-Friendly
- State Michigan
- 62 Landlord-Friendly · EVEN
- County
- — inherits STATE
- City
- — inherits STATE
ZIP-level market 48097
- Home prices YoY
- -17.5%
- Active inventory
- 47
- Price-to-rent
- 4.9×
Monthly cashflow live
- Estimated rent
- $1,000 high interval (Pro) →
- Mortgage (P&I)
- −$309
- Tax from tax record
- −$50 /mo · $600/yr
- Insurance
- −$25
- HOA
- −$0
- Vacancy / Maint / Mgmt
- −$210
- Net cashflow
- $406
Break-even live
UW: 25.0% down · 7.5% · 30yr · 1.5% tax · 5.0% vac · 8.0% maint · 8.0% mgmt
Financing live
Cash to close
- Down payment
- $14,750
- Closing costs
- $1,770
- Reserves months
- —
- Total cash needed
- —
Loan-product check · same deal, 3 products live
Conventional
25% down · 7.5% · 30yr
- Down + closing
- —
- Monthly P&I
- —
- Monthly cashflow
- —
- DSCR
- —
- Eligible?
- —
Personal DTI + credit; lowest rate.
DSCR
20% down · 8.5% · 30yr
- Down + closing
- —
- Monthly P&I
- —
- Monthly cashflow
- —
- DSCR
- —
- Eligible?
- —
No personal income docs; deal must DSCR.
Hard money
10% down · 12.0% · 12mo
- Down + closing
- —
- Monthly P&I
- —
- Monthly cashflow
- —
- DSCR
- —
- Eligible?
- —
Short-term bridge; refi at stabilization.
Rent comps 5 comps
| Address | Beds | Baths | Sqft | Rent | $/sqft | DOM | Units | Dist |
|---|---|---|---|---|---|---|---|---|
| 420 North St Unit 21 Yale, MI | 1.0 | 1.0 | 850 | $1,100 | $1.29 | 1d | 1 | 0.28mi |
| 208 2nd St Unit 7 Yale, MI | 1.0 | 1.0 | 600 | $790 | $1.32 | 1d | 1 | 0.67mi |
| 204 2nd St Apt 8 Yale, MI | 1.0 | 1.0 | 600 | $950 | $1.58 | 1d | 1 | 0.69mi |
| 204 2nd St Unit 6 Yale, MI | 1.0 | 1.0 | 600 | $790 | $1.32 | 43d | 1 | 0.70mi |
| 204 2nd St Unit 7 Yale, MI | 1.0 | 1.0 | 600 | $790 | $1.32 | 1d | 1 | 0.71mi |
Listing history 17 events
-
2026-06-18days on market $59,000 Active 133 DOM
-
2026-06-17days on market $59,000 Active 132 DOM
-
2026-06-16days on market $59,000 Active 131 DOM
-
2026-06-15days on market $59,000 Active 130 DOM
-
2026-06-13days on market $59,000 Active 128 DOM
-
2026-06-09days on market $59,000 Active 124 DOM
-
2026-06-08days on market $59,000 Active 123 DOM
-
2026-06-07days on market $59,000 Active 122 DOM
-
2026-06-04days on market $59,000 Active 119 DOM
-
2026-06-03days on market $59,000 Active 118 DOM
-
2026-06-02days on market $59,000 Active 117 DOM
-
2026-06-01days on market $59,000 Active 116 DOM
-
2026-05-31days on market $59,000 Active 115 DOM
-
2026-05-12price $59,000 211-char remark
Show marketing remark (211 chars)
Small ranch with much potential. Home has an extra deep lot. Does need some work, but is priced accordingly. Has enclosed front porch. Located on a nice tree-lined street. With a some work, could be a nice home.
-
2026-05-12price $59,000 211-char remark
Show marketing remark (211 chars)
Small ranch with much potential. Home has an extra deep lot. Does need some work, but is priced accordingly. Has enclosed front porch. Located on a nice tree-lined street. With a some work, could be a nice home.
-
2026-02-05$69,000 Active 211-char remark
Show marketing remark (211 chars)
Small ranch with much potential. Home has an extra deep lot. Does need some work, but is priced accordingly. Has enclosed front porch. Located on a nice tree-lined street. With a some work, could be a nice home.
-
2026-02-05$69,000 Active 211-char remark
Show marketing remark (211 chars)
Small ranch with much potential. Home has an extra deep lot. Does need some work, but is priced accordingly. Has enclosed front porch. Located on a nice tree-lined street. With a some work, could be a nice home.
ⓘ Source: listings_history table (triggers on properties + properties_extension) + one-shot
backfill from property_details.listing_events for pre-trigger history.
Tax reassessment forecast MI · Partial reset (capped growth)
- Current annual tax
- $600 · $50/mo
- Projected year-2 tax
- $754 · $63/mo
- Expected delta
- +$154/yr (+$13/mo · 25.7%)
ⓘ Screening estimate from a state-policy table — verify with the county assessor before closing.
Climate risk First Street
- Flood 1/10 Low FEMA zone X (unshaded) · 0% chance over 30 yrs
- Wildfire 1/10 Low
- Heat 2/10 Low 7 d/yr ≥95°F today · 14 d/yr by 30 yrs out
- Wind 1/10 Low
- Air quality 3/10 Moderate 2 unhealthy d/yr today · 4 by 30 yrs out
Nearby sold comps map
Loading sold comps map…
Walkable amenities ~0.75 mi
Loading nearby amenities…
Taxation est. · year 1
- Rental income
- $11,999
- − Mortgage interest
- −$3,305
- − Property taxes
- −$600
- − Insurance
- −$295
- − Repairs & maintenance
- −$960
- − Management
- −$960
- − Depreciation
- −$1,716
- Taxable income
- $4,163
- Est. tax owed @ 24.0%
- −$999
- After-tax cash flow
- $3,872/yr
For passive investors: Depreciation is non-cash, so a rental often shows a tax loss while cash-flowing — sheltering income. Rental losses are passive: they offset passive income freely, and up to $25,000/yr can offset ordinary (W-2) income if you actively participate and your MAGI is under $100k (phasing out to $0 by $150k); unused losses carry forward. On sale, claimed depreciation is recaptured at up to 25%, and gains may owe capital-gains tax (a 1031 exchange can defer both). Figures are a year-1 estimate at your 24.0% rate — not tax advice; consult a CPA.
Schools (NCES district)
- District
- Yale Public Schools
- NCES district ID
- 2636600
- Math proficiency
- 40% ▼ -11.00%
- Reading proficiency
- 62% ▼ -8.00%
- Median HH income
- $53,116
- Composite
- 43.83/100
- National rank
- #2926
- State rank
- #92 of 540 in MI
Livability — Yale
- Score
- 66/100
- State rank
- #432
- US rank
- #12026
Category grades
Schools grade is shown separately in the Schools card above.
Census & demographics
- Census place
- Yale, MI
- County
- Saint Clair County · 44,760 people
- City population
- 5,418
- Metro
- Detroit-Warren-Dearborn, MI
- Population (ZIP)
- 5,418
- Household income
- $63,659
- Rent vs Own
- Severe rent burden
- 94.0
Population outlook (St. Clair County) Hauer SSP2
- Today (2025)
- 154,587 people
- By 2030
- 150,031 · -2.9%
- By 2040
- 138,177 · -10.6%
- By 2050
- 124,390 · -19.5%
- By 2075
- 95,825 · -38.0%
- By 2100
- 68,672 · -55.6%
Race, ethnicity, and origin ACS 2023
- Neighborhood character
- Predominantly White (95%)
- Race & ethnicity
- White 95% Two or more races 3% Hispanic / Latino 3%
- Common ancestry
- Romanian 9% Slovak 4% Lithuanian 3%
- Foreign-born
- 1% · Canada
- Languages at home
- 98% English-only · Spanish 1%
Political lean MEDSL · St. Clair
- 2024 margin
- Solid R (+34.6) · D 32.0% · R 66.6% · Other 1.4%
- 2008→2024 swing
- -37.3pp toward R · 2008: 2.6pp · 2024: -34.6pp
- All cycles
- 2024: R+34.6 2020: R+30.2 2016: R+31.4 2012: R+7.1 2008: D+2.6
Not yet ingested
- Civics
- —
Market trends
- HPI YoY
- ▼ -52.26%
- Current HPI
- 246.4218
- Rent YoY
- —
- Metro
- Detroit-Warren-Dearborn, MI
- State GDP YoY
- ▲ 1.37%
- F500 in state
- 28
Industry mix (Fortune 500 HQ in MI)
| Industry | F500 HQs | Revenue |
|---|---|---|
| Automotive Parts | 3 | $48B |
|
||
| Automotive | 2 | $372B |
|
||
| Chemicals | 1 | $45B |
|
||
| Automotive Retail | 1 | $29B |
|
||
| Healthcare / Medical Devices | 1 | $23B |
|
||
| Automotive Technology | 1 | $20B |
|
||
Price history
-14.5% since first listed4 events — show timeline
- 2026-05-12 Price Changed $59,000 MiRealSource-MiMLS
- 2026-05-12 Price Changed $59,000 REALCOMP
- 2026-02-05 Listed $69,000 REALCOMP
- 2026-02-05 Listed $69,000 MiRealSource-MiMLS
Property tax history
-3.4%/yrLatest (2025): $600 · -52.1% YoY. Source: county tax records.
Cash-flow waterfall
monthlySold comps — $/sqft
last 12 mo · ≤1 miLoading sold comps…