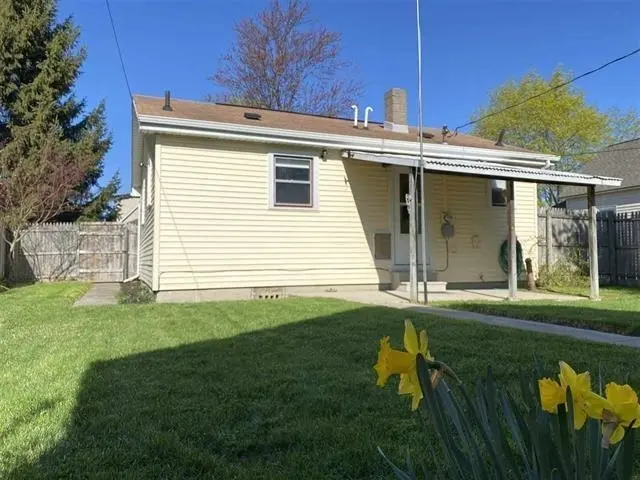
2017 Marsac St · Bay City, MI
Flood risk 3/10 · Minor
- FEMA flood zone
- X (unshaded)
- Chance of flooding over 30 yrs
- 0.2%
- Est. flood insurance / yr
- $473 – $860
Fire risk 1/10 · Minimal
- Est. fire insurance / yr
- $784 – $1,456
Heat risk 3/10 · Minor
- Hot days now (above 97°F)
- 7 days/yr
- Hot days in 30 yrs
- 14 days/yr
Wind risk 1/10 · Minimal
- Chance of severe wind over 30 yrs
- —
Air-quality risk 2/10 · Minimal
- Unhealthy air days now
- 1 days/yr
- Unhealthy air days in 30 yrs
- 2 days/yr
Risk factors via First Street. Map © Google.
Why this score? — see what drove the C- grade
The composite is a weighted blend of 9 inputs, each scored 0–100. Each bar is that input's sub-score; the figure is the points it added to the 100-point composite (weight × sub-score).
- Cash flow +24.7/30.0
- DSCR +8.0/10.0
- 1% rule +6.3/10.0
- Livability +3.4/5.0
- Schools +2.8/10.0
- Rent growth +2.5/5.0
- Condition / age +2.5/5.0
- ARV discount +0.0/15.0
- Appreciation +0.0/10.0
$79,000
🖨 Deal sheet 📄 Offer letter ✓ Due diligence
Listing remarks MLS
Pristine one bedroom home, completely updated with fresh paint, carpet/flooring and light fixtures throughout. Brand new stove, refrigerator and thermostat. 16 x 16 living room, 12 x 10 bedroom. Updated bath features jetted tub! 12 inches of insulation will keep heating cost very low. Also includes washer and dryer! Fully fenced yard, covered patio and generous 18 x 24 garage with door opener, electric and room for workshop. . Hurry on this one! Why rent? Great starter or investment opportunity.
Key facts
- Updated bath
- Fenced yard
- Covered patio
Tags
Property features AI
Finance
- Other: Property type: Residential; Lot acreage approximately 0.13 acres (50 frontage)
Exterior
- Parking: Detached garage with electricity (1 car)
- Utilities: Public water; Public sanitary sewer; Natural gas service; Gas water heater; Forced air heating
- Home design: Residential single-story home; Built in 1945; Entry and main living on the first floor; Facing east (side of street: E)
- Construction: Vinyl siding construction; Crawl space foundation; Built in 1945
- Exterior features: Vinyl siding; Road frontage
Interior
- Kitchen: Range/oven; Refrigerator; Vinyl floor in the kitchen (13 x 8)
- Bedrooms: Primary bedroom on the first floor (12 x 10) with carpet
- Flooring: Carpet in bedroom and living room; Vinyl in kitchen
- Bathrooms: One full bathroom on the first floor
- Heating & cooling: Forced air heating; Natural gas fuel; Gas water heater
- Interior features: Carpeted living areas
Neighborhood map
What this means for you Summary
Snapshot
- This is a 1-bed/1.0-bath single-family listed at $79k.
Deal economics
- At list price, monthly cash flow is $165 ($2k/yr) — positive.
- The deal already cash-flows at list — no discount required.
- Meets the 1% rule at list price ($892 rent vs $79k).
- Cap rate 8.8% vs local median 5.5% in Bay City — top-decile yield for the area; either an underpriced asset or a hidden risk that comps aren't pricing in. Stress-test before assuming the spread holds.
Location & tenants
- Location reads 68/100 on livability (#360 in MI) — a middle-class / working-renter tenant base. Strengths: cost of living A+, housing A+, health & safety A+; Watch: schools D+, amenities D, crime F.
- Bay City School District (urban): math 27% / reading 40% proficiency, ranked #317 of 540 in MI (top 59%) — families likely to look elsewhere, expect single-tenant / working-renter base with shorter leases.
- Market conditions: 148 active listings in the ZIP; 1 comparable units currently listed for rent nearby; 39 units permitted in Bay County in 2024 (0 in 5+ unit buildings).
Forward outlook
- Local home prices are declining (-3.0%/yr); year-one equity from $546 of loan paydown is wiped out by about $2k of value loss. Plan a longer hold.
- Bay County population projected at -21% by 2050 — secular population decline; favor cash flow + early exit over multi-decade hold.
Negotiation context
- Only 10 days on market — expect competitive offers; lowballing is unlikely to land.
- 4 sale attempts since 8y ago with the ask held roughly flat each time — persistent listings suggest the price (not the market) is what's stuck; bring a comps-based counter.
- Current owner paid $50k; list at $79k implies a 58% gain — meaningful room to come down on a strong offer.
Risks & watch-outs
- Watch-outs: built in 1945 — expect roof / HVAC / electrical / plumbing capex.
Questions for the listing agent
- Built in 1945 — when were the roof, HVAC, electrical panel, plumbing, and water heater last replaced?
- Is there a deadline driving the sale (1031 exchange, divorce, estate, relocation)? That informs how much negotiation room exists.
- Schools are D-rated, which usually means shorter tenancies and higher turnover. Who's the typical renter profile here, and what's been the actual vacancy rate?
- Crime grade is F in this area — have there been break-ins, vandalism, or insurance claims at this property in the last 3 years? What carrier currently insures it and at what premium?
- What's the average days-on-market for RENTAL listings here right now (not sales)? A rising rental-DOM trend means longer vacancies and softer asking-rent achievability than the comps imply.
- What's the recent tenant-quality profile in this submarket — average credit score on applications, eviction rate, late-payment / NSF rate, and stable-employment percentage? A property-management company in the area should have these aggregated.
- How much new for-sale + rental construction is in the pipeline within 1–3 miles? Heavy new supply typically softens prices + rents 12–24 months out; constrained supply supports both.
Investment metrics
- 1% rule
- 1.13% ✓
- Cap rate
- 8.80%
- Cash-on-cash
- 8.97%
- DSCR
- 1.40
- GRM
- 7.4
CMA / ARV
- ARV (on-the-fly)
- $66,150
- Comps found
- 7
Show comp detail 7 sales within ~0.75 mi
| Address | Dist | Beds/Ba | Sqft | Sold | Price | $/sf | Match |
|---|---|---|---|---|---|---|---|
| 105 Braddock St | 0.16mi | 2/1.0 (+1) | 700 (+4%) | 21mo | $64,900 | $93 | 64 |
| 2313 S Jefferson St | 0.53mi | 2/1.0 (+1) | 690 (+2%) | 13mo | $80,000 | $116 | 56 |
| 1414 Marsac St | 0.43mi | 2/1.0 (+1) | 740 (+10%) | 18mo | $47,000 | $64 | 44 |
| 403 Polk St | 0.63mi | 2/1.0 (+1) | 748 (+11%) | 7mo | $69,000 | $92 | 42 |
| 805 Taylor St | 0.54mi | 2/1.0 (+1) | 768 (+14%) | 7mo | $105,500 | $137 | 41 |
| 303 Harrison St | 0.54mi | 2/1.0 (+1) | 724 (+7%) | 20mo | $71,000 | $98 | 41 |
| 1802 Garfield Rd | 0.73mi | 2/1.0 (+1) | 600 (-11%) | 18mo | $109,835 | $183 | 27 |
Match score weights: distance 35% · size 25% · config 20% · recency 20%. Top-matched comps best support the ARV.
Projected returns pro-forma
-3.0% appreciation · 3.0% rent growth · sell at horizon
- IRR
- -2.7%
- Equity multiple
- 0.90×
- Total profit
- $-2,262
- Equity at exit
- $11,779
- IRR
- 7.0%
- Equity multiple
- 1.53×
- Total profit
- $11,628
- Equity at exit
- $6,830
Cash invested: $22,120 (down + closing). Projections, not guarantees.
Landlord ↔ Tenant lean methodology
- Overall (STATE)
- 62 Landlord-Friendly
- State Michigan
- 62 Landlord-Friendly · EVEN
- County
- — inherits STATE
- City
- — inherits STATE
ZIP-level market 48708
- Home prices YoY
- -30.9%
- Active inventory
- 148
- Price-to-rent
- 7.4×
Monthly cashflow live
- Estimated rent
- $892 medium interval (Pro) →
- Mortgage (P&I)
- −$414
- Tax from tax record
- −$92 /mo · $1,105/yr
- Insurance
- −$33
- HOA
- −$0
- Vacancy / Maint / Mgmt
- −$187
- Net cashflow
- $165
Break-even live
UW: 25.0% down · 7.5% · 30yr · 1.5% tax · 5.0% vac · 8.0% maint · 8.0% mgmt
Financing live
Cash to close
- Down payment
- $19,750
- Closing costs
- $2,370
- Reserves months
- —
- Total cash needed
- —
Loan-product check · same deal, 3 products live
Conventional
25% down · 7.5% · 30yr
- Down + closing
- —
- Monthly P&I
- —
- Monthly cashflow
- —
- DSCR
- —
- Eligible?
- —
Personal DTI + credit; lowest rate.
DSCR
20% down · 8.5% · 30yr
- Down + closing
- —
- Monthly P&I
- —
- Monthly cashflow
- —
- DSCR
- —
- Eligible?
- —
No personal income docs; deal must DSCR.
Hard money
10% down · 12.0% · 12mo
- Down + closing
- —
- Monthly P&I
- —
- Monthly cashflow
- —
- DSCR
- —
- Eligible?
- —
Short-term bridge; refi at stabilization.
Rent comps 1 comps
| Address | Beds | Baths | Sqft | Rent | $/sqft | DOM | Units | Dist |
|---|---|---|---|---|---|---|---|---|
| 403 Polk St Bay City, MI | 2.0 | 1.0 | 748 | $1,000 | $1.34 | 44d | 1 | 0.64mi |
Listing history 7 events
-
2026-06-14statusdays on market $79,000 Pending 10 DOM
-
2026-06-12statusdays on market $79,000 Keep Showing-Contgcy Appl 9 DOM
-
2026-06-09days on market $79,000 Active 6 DOM
-
2026-06-08days on market $79,000 Active 5 DOM
-
2026-06-07days on market $79,000 Active 4 DOM
-
2026-06-05remarks 390-char remark
-
2026-06-05$79,000 Active 1 DOM
ⓘ Source: listings_history table (triggers on properties + properties_extension) + one-shot
backfill from property_details.listing_events for pre-trigger history.
Tax reassessment forecast MI · Partial reset (capped growth)
- Current annual tax
- $1,105 · $92/mo
- Projected year-2 tax
- $1,161 · $97/mo
- Expected delta
- +$56/yr (+$5/mo · 5.1%)
ⓘ Screening estimate from a state-policy table — verify with the county assessor before closing.
Climate risk First Street
- Flood 3/10 Moderate FEMA zone X (unshaded) · 20% chance over 30 yrs
- Wildfire 1/10 Low
- Heat 3/10 Moderate 7 d/yr ≥97°F today · 14 d/yr by 30 yrs out
- Wind 1/10 Low
- Air quality 2/10 Low 1 unhealthy d/yr today · 2 by 30 yrs out
Nearby sold comps map
Loading sold comps map…
Walkable amenities ~0.75 mi
Loading nearby amenities…
Taxation est. · year 1
- Rental income
- $10,703
- − Mortgage interest
- −$4,425
- − Property taxes
- −$1,105
- − Insurance
- −$395
- − Repairs & maintenance
- −$856
- − Management
- −$856
- − Depreciation
- −$2,298
- Taxable income
- $767
- Est. tax owed @ 24.0%
- −$184
- After-tax cash flow
- $1,800/yr
For passive investors: Depreciation is non-cash, so a rental often shows a tax loss while cash-flowing — sheltering income. Rental losses are passive: they offset passive income freely, and up to $25,000/yr can offset ordinary (W-2) income if you actively participate and your MAGI is under $100k (phasing out to $0 by $150k); unused losses carry forward. On sale, claimed depreciation is recaptured at up to 25%, and gains may owe capital-gains tax (a 1031 exchange can defer both). Figures are a year-1 estimate at your 24.0% rate — not tax advice; consult a CPA.
Schools (NCES district)
- District
- Bay City School District
- NCES district ID
- 2604260
- Math proficiency
- 27% ▼ -8.00%
- Reading proficiency
- 40% ▼ -4.00%
- Median HH income
- $43,833
- Composite
- 28.47/100
- National rank
- #6743
- State rank
- #317 of 540 in MI
Livability — Bay City
- Score
- 68/100
- State rank
- #360
- US rank
- #8912
Category grades
Schools grade is shown separately in the Schools card above.
Census & demographics
- Census place
- Bay City, MI
- County
- Bay County · 36,975 people
- City population
- 25,635
- Metro
- Bay City, MI
- Population (ZIP)
- 25,635
- Household income
- $50,518
- Rent vs Own
- Severe rent burden
- 528.0
Population outlook (Bay County) Hauer SSP2
- Today (2025)
- 101,476 people
- By 2030
- 98,152 · -3.3%
- By 2040
- 89,711 · -11.6%
- By 2050
- 80,614 · -20.6%
- By 2075
- 60,544 · -40.3%
- By 2100
- 41,603 · -59.0%
Race, ethnicity, and origin ACS 2023
- Neighborhood character
- Predominantly White (81%)
- Race & ethnicity
- White 81% Hispanic / Latino 11% Two or more races 10% Black 3%
- Hispanic origin (detail)
- Mexican 9%
- Common ancestry
- Romanian 17% Lithuanian 7% Slovak 2%
- Foreign-born
- 2% · Canada, South Korea
- Languages at home
- 96% English-only · Spanish 2% German/W. Germanic 1%
Political lean MEDSL · Bay
- 2024 margin
- R (+14.7) · D 42.0% · R 56.7% · Other 1.3%
- 2008→2024 swing
- -30.0pp toward R · 2008: 15.3pp · 2024: -14.7pp
- All cycles
- 2024: R+14.7 2020: R+11.6 2016: R+12.6 2012: D+6.0 2008: D+15.3
Not yet ingested
- Civics
- —
Market trends
- HPI YoY
- ▼ -82.21%
- Current HPI
- 183.5774
- Rent YoY
- —
- Metro
- Bay City, MI
- State GDP YoY
- ▲ 1.37%
- F500 in state
- 28
Industry mix (Fortune 500 HQ in MI)
| Industry | F500 HQs | Revenue |
|---|---|---|
| Automotive Parts | 3 | $48B |
|
||
| Automotive | 2 | $372B |
|
||
| Chemicals | 1 | $45B |
|
||
| Automotive Retail | 1 | $29B |
|
||
| Healthcare / Medical Devices | 1 | $23B |
|
||
| Automotive Technology | 1 | $20B |
|
||
Price history
+164.2% since first listed12 events — show timeline
- 2026-06-03 Listed $79,000 MiRealSource-MiMLS
- 2025-04-16 Listing Removed — MiRealSource-MiMLS
- 2025-04-16 Price Changed $75,000 MiRealSource-MiMLS
- 2025-01-14 Contingent — MiRealSource-MiMLS
- 2025-01-06 Listed $69,000 MiRealSource-MiMLS
- 2021-06-01 Sold (Public Records) $49,900 Public Records
- 2021-05-28 Sold (MLS) $49,900 MiRealSource-MiMLS
- 2021-04-21 Listing Removed — MiRealSource-MiMLS
- 2021-04-19 Listed $49,900 MiRealSource-MiMLS
- 2018-11-15 Sold (Public Records) $24,500 Public Records
- 2018-11-08 Sold (MLS) $24,500 MiRealSource-MiMLS
- 2018-03-05 Listed $29,900 MiRealSource-MiMLS
Property tax history
+4.6%/yrLatest (2025): $1,105 · +3.0% YoY. Source: county tax records.
Cash-flow waterfall
monthlySold comps — $/sqft
last 12 mo · ≤1 miLoading sold comps…