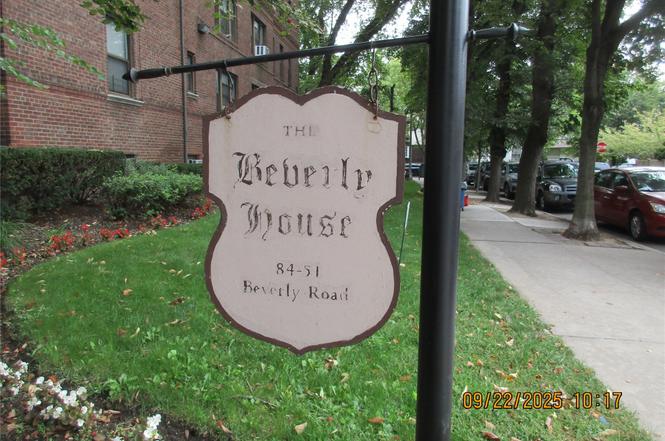
84-51 Beverly Rd Unit 2-S · New York, NY
Flood risk 1/10 · Minimal
- FEMA flood zone
- X (unshaded)
- Chance of flooding over 30 yrs
- 0.0%
- Est. flood insurance / yr
- $507 – $1,088
Fire risk 1/10 · Minimal
- Est. fire insurance / yr
- $691 – $1,283
Heat risk 6/10 · Moderate
- Hot days now (above 99°F)
- 7 days/yr
- Hot days in 30 yrs
- 14 days/yr
Wind risk 6/10 · Moderate
- Chance of severe wind over 30 yrs
- 52.0%
Air-quality risk 4/10 · Minor
- Unhealthy air days now
- 6 days/yr
- Unhealthy air days in 30 yrs
- 6 days/yr
Risk factors via First Street. Map © Google.
Why this score? — see what drove the D grade
The composite is a weighted blend of 9 inputs, each scored 0–100. Each bar is that input's sub-score; the figure is the points it added to the 100-point composite (weight × sub-score).
- Cash flow +13.2/30.0
- ARV discount +7.5/15.0
- Schools +5.0/10.0
- DSCR +4.0/10.0
- Livability +3.8/5.0
- 1% rule +3.7/10.0
- Rent growth +2.8/5.0
- Condition / age +2.5/5.0
- Appreciation +0.0/10.0
$318,000
🖨 Deal sheet (PDF) 📄 Offer letter ✓ Due diligence
Listing remarks
This is your chance of a lifetime to be part of the famous BEVERLY HOUSE family. This pre-war co op has ENORMOUSE rooms - 21' long LR, 20" long bedroom vaulted ceilings etc. This apartment is a blank canvass that you will want to remodel and create your own home. This apartment needs a lot of work - from electric to plumbing. Be ready to imagine what you can make this home. It does not function now. The building has all the amenities and class and style not found anywhere else. Walk to the LIRR, and train. Busses and shopping on the corner. Great neighbors too. Sub leasing allowed. 2 pets welcome. Priced according the work needed.
Key facts
- Built 1941
- Listed 250 days
Property features AI
Finance
- HOA & community: Association: Beverly House; Additional monthly assessment fee of $59.33
Exterior
- Parking: On-street parking
- Utilities: Public sewer; Electricity connected
- Home design: Stock cooperative; Fixer condition; One level; Six total stories
- Construction: Brick construction
- Exterior features: Brick construction; Not waterfront
Interior
- Kitchen: Gas range; Refrigerator
- Bedrooms: Second floor location
- Flooring: Carpet; Wood
- Bathrooms: 1 full bathroom
- Heating & cooling: Steam heating
- Interior features: Cathedral ceilings; Insulated windows; Accessible approach with ramp
- Laundry & utility: Laundry in basement
Neighborhood map
What this means for you Summary
Snapshot
- This is a 2-bed/1.0-bath condo listed at $318k.
Deal economics
- At list price, monthly cash flow is $-7 ($-79/yr) — negative.
- To cash-flow at today's rent, offer at most $317k (0.3% below list).
- To meet the 1% rule (rent ≥ 1% of price), the offer needs to be $277k (12.8% below list).
- Recommended offer: $277k (12.8% below list) — sets the bar for 1% rule.
- Cap rate 6.3% vs local median 2.6% in New York — top-decile yield for the area; either an underpriced asset or a hidden risk that comps aren't pricing in. Stress-test before assuming the spread holds.
Location & tenants
- Location reads 75/100 on livability (#268 in NY, #4,188 nationally) — a middle-class / working-renter tenant base. Strengths: amenities A+, commute A+, health & safety A; Watch: crime F, cost of living F.
- Market conditions: Rents rising (+1.4%/yr); 133 active listings in the ZIP; 40 comparable units currently listed for rent nearby; rentals at typical pace (median 22d on market — plan ~3-4 weeks tenant-placement turnaround); solid renter incomes; 5,302 units permitted in Queens County in 2024 (4,918 in 5+ unit buildings).
- This rent runs 39% of the median local income ($86k/yr) — at the standard rent-burdened threshold; future hikes will face affordability resistance.
Forward outlook
- Local home prices are declining (-3.0%/yr); year-one equity from $2k of loan paydown is wiped out by about $10k of value loss. Plan a longer hold.
- Queens County population projected at +16% by 2050 — long-run rental-demand tailwind backs the buy-and-hold thesis.
Negotiation context
- It's been on market 250 days — a 12% lower offer ($280k) is reasonable based on typical stale-listing flexibility.
- 2 sale attempts; this cycle's ask has dropped $30k (9%) from the opening price — seller is motivated, your offer sets the floor, not the list.
Risks & watch-outs
- Watch-outs: built in 1941 — expect roof / HVAC / electrical / plumbing capex.
- Climate carrying-cost: major wind risk, 52% chance of damaging wind over 30y; extreme-heat days projected 7→14/yr by 2055 (HVAC capex compounding) — expect insurance premiums to compound above CPI over the hold.
Questions for the listing agent
- What do current leases actually rent for vs. the listed asking? Can we see a recent rent roll and the last 12 months of T-12 income?
- It's been on market 250 days. Have you received any prior offers? Is the seller open to a 13% concession, seller financing, or rate buy-down credit?
- Built in 1941 — when were the roof, HVAC, electrical panel, plumbing, and water heater last replaced?
- Any open or pending special assessments — roof, HVAC, plumbing, elevator, façade? What's the per-unit balance and payoff schedule, and is the seller paying it off at close or rolling it to the buyer?
- Why hasn't it sold? Are there any deal-killer items the seller is aware of (foundation, flood, title, zoning, code violations)?
- Is there a deadline driving the sale (1031 exchange, divorce, estate, relocation)? That informs how much negotiation room exists.
- Schools are B-rated — typically a magnet for longer-tenancy family renters. What's the average tenant stay here, and is there a school-zone premium baked into asking?
- Crime grade is F in this area — have there been break-ins, vandalism, or insurance claims at this property in the last 3 years? What carrier currently insures it and at what premium?
- The area grade is low — what's the realistic commute time and amenity access for the typical tenant pool here? Any planned neighborhood developments (good or bad) we should know about?
- What's the average days-on-market for RENTAL listings here right now (not sales)? A rising rental-DOM trend means longer vacancies and softer asking-rent achievability than the comps imply.
- What's the recent tenant-quality profile in this submarket — average credit score on applications, eviction rate, late-payment / NSF rate, and stable-employment percentage? A property-management company in the area should have these aggregated.
- How much new apartment / multifamily construction is in the pipeline within 1–3 miles? Heavy new supply (>2% of stock underway) typically softens rents 12–24 months out; light construction supports rent growth.
Investment metrics
- 1% rule
- 0.87% ✗
- Cap rate
- 6.27%
- Cash-on-cash
- -0.09%
- DSCR
- 1.00
- GRM
- 9.6
CMA / ARV
No comps found within radius.
Projected returns pro-forma
-3.0% appreciation · 1.35% rent growth · sell at horizon
- IRR
- -18.3%
- Equity multiple
- 0.37×
- Total profit
- $-56,437
- Equity at exit
- $47,415
- IRR
- -14.2%
- Equity multiple
- 0.24×
- Total profit
- $-67,497
- Equity at exit
- $27,495
Cash invested: $89,040 (down + closing). Projections, not guarantees.
Landlord ↔ Tenant lean methodology
- Overall (CITY)
- 0 Strongly Tenant-Friendly
- State New York
- 15 Strongly Tenant-Friendly · D+10
- County
- — inherits STATE
- City New York
- 0 Strongly Tenant-Friendly · D+34
ZIP-level market 11415
- Rents YoY
- 1.4%
- Active inventory
- 133
- Price-to-rent
- 9.6×
Monthly cashflow live
- Estimated rent
- $2,773 high interval (Pro) →
- Mortgage (P&I)
- −$1,668
- Tax est. 1.5%
- −$398 /mo · $4,770/yr
- Insurance
- −$132
- HOA
- −$0
- Vacancy / Maint / Mgmt
- −$582
- Net cashflow
- $-7
Break-even live
Sensitivity live
| Price | -10% $213 | -5% $103 | +0% $-7 | +5% $-116 | +10% $-226 |
|---|---|---|---|---|---|
| Rent | -10% $-226 | -5% $-116 | +0% $-7 | +5% $103 | +10% $213 |
| Rate | -1.0pp $154 | -0.5pp $74 | base $-7 | +0.5pp $-89 | +1.0pp $-173 |
UW: 25.0% down · 7.5% · 30yr · 1.5% tax · 5.0% vac · 8.0% maint · 8.0% mgmt
Financing live
Cash to close
- Down payment
- $79,500
- Closing costs
- $9,540
- Reserves months
- —
- Total cash needed
- —
Loan-product check · same deal, 3 products live
Conventional
25% down · 7.5% · 30yr
- Down + closing
- —
- Monthly P&I
- —
- Monthly cashflow
- —
- DSCR
- —
- Eligible?
- —
Personal DTI + credit; lowest rate.
DSCR
20% down · 8.5% · 30yr
- Down + closing
- —
- Monthly P&I
- —
- Monthly cashflow
- —
- DSCR
- —
- Eligible?
- —
No personal income docs; deal must DSCR.
Hard money
10% down · 12.0% · 12mo
- Down + closing
- —
- Monthly P&I
- —
- Monthly cashflow
- —
- DSCR
- —
- Eligible?
- —
Short-term bridge; refi at stabilization.
Rent comps 40 comps
| Address | Beds | Baths | Sqft | Rent | $/sqft | DOM | Units | Dist |
|---|---|---|---|---|---|---|---|---|
| 8329 Talbot St Kew Gardens, NY | 3.0 | 2.0 | 1300 | $2,800 | $2.15 | 25d | 1 | 0.13mi |
| 124-14 Metropolitan Ave Unit 2F Kew Gardens, NY | 2.0 | 1.0 | 850 | $2,900 | $3.41 | 25d | 1 | 0.26mi |
| 8383 118th St Kew Gardens, NY | 1.0–2.0 | 1.0–1.5 | 900 | $3,200 | $3.56 | 25d | 2 | 0.28mi |
| 83-83 118th St Unit 2E Kew Gardens, NY | 2.0 | 1.5 | 1000 | $3,200 | $3.20 | 15d | 1 | 0.28mi |
| 123-40 83rd Ave Unit 8B Queens, NY | 1.0 | 1.0 | 800 | $2,450 | $3.06 | 25d | 1 | 0.28mi |
| 123-40 83rd Ave Unit 2107 Jamaica, NY | 1.0 | 1.0 | 750 | $2,573 | $3.43 | 25d | 1 | 0.28mi |
| 83-60 118th St Unit 4F Kew Gardens, NY | 2.0 | 1.0 | 800 | $2,500 | $3.12 | 25d | 1 | 0.29mi |
| 11624 Grosvenor Ln Unit 11D Richmond Hill, NY | 2.0 | 2.0 | 950 | $3,200 | $3.37 | 25d | 1 | 0.31mi |
| 8371 116th St Unit 7C Richmond Hill, NY | 1.0 | 1.0 | 800 | $2,600 | $3.25 | 0d | 1 | 0.38mi |
| 8371 116th St Jamaica, NY | 1.0 | 1.0 | 688 | $2,725 | $3.96 | 6d | 2 | 0.39mi |
| 12401 Hillside Ave Richmond Hill, NY | 2.0 | 1.0 | 800 | $2,700 | $3.38 | 0d | 1 | 0.40mi |
| 123-16 Hillside Ave Unit 1st Fl Jamaica, NY | 2.0 | 1.0 | 869 | $2,700 | $3.11 | 25d | 1 | 0.42mi |
| 122-08 Hillside Ave Unit 2 Jamaica, NY | 2.0 | 1.0 | 700 | $2,500 | $3.57 | 25d | 1 | 0.43mi |
| 12015 Jamaica Ave Unit 2 Jamaica, NY | 2.0 | 1.0 | 700 | $2,200 | $3.14 | 25d | 1 | 0.52mi |
| 8711 123rd St Richmond Hill, NY | 3.0 | 1.0 | 1000 | $3,000 | $3.00 | 4d | 1 | 0.55mi |
| 87-13 135th St Unit 3 Jamaica, NY | 2.0 | 1.0 | 1400 | $2,850 | $2.04 | 25d | 1 | 0.59mi |
| 13828 Queens Blvd Unit 2E Briarwood, NY | 1.0 | 1.0 | 700 | $2,600 | $3.71 | 8d | 1 | 0.62mi |
| 13828 Queens Blvd Unit 7A Briarwood, NY | 2.0 | 1.0 | 810 | $3,600 | $4.44 | 25d | 1 | 0.62mi |
| 81-18 138th St Unit 3 Jamaica, NY | 3.0 | 2.0 | 1000 | $3,900 | $3.90 | 25d | 1 | 0.66mi |
| 13915 83rd Ave #717 Jamaica, NY | 1.0 | 1.0 | 800 | $2,400 | $3.00 | 5d | 1 | 0.67mi |
| 7540 Austin St Unit 4HR Forest Hills, NY | 1.0 | 1.0 | 841 | $2,600 | $3.09 | 0d | 1 | 0.67mi |
| 13532 Kew Gardens Rd Richmond Hill, NY | 2.0 | 1.0 | 1070 | $2,500 | $2.34 | 25d | 1 | 0.68mi |
| 138-54 Hoover Ave Unit 3R Jamaica, NY | 2.0 | 1.5 | 1200 | $3,100 | $2.58 | 15d | 1 | 0.73mi |
| 141-35 Pershing Cres Unit 1B Jamaica, NY | 1.0 | 1.5 | 1100 | $2,800 | $2.55 | 21d | 1 | 0.78mi |
| 14160 84th Rd Unit 2G Jamaica, NY | 1.0 | 1.0 | 700 | $2,200 | $3.14 | 14d | 1 | 0.80mi |
| 84-03 Lander St Unit 2B Jamaica, NY | 2.0 | 2.0 | 850 | $3,250 | $3.82 | 25d | 1 | 0.83mi |
| 135-26 78th Ave Unit 2FL Flushing, NY | 2.0 | 1.0 | 900 | $2,800 | $3.11 | 3d | 1 | 0.85mi |
| 11007 73rd Rd Forest Hills, NY | 1.0 | 1.0 | 950 | $1,800 | $1.89 | 19d | 1 | 0.87mi |
| 8455 Daniels St Unit 5H Jamaica, NY | 1.0 | 1.0 | 750 | $2,300 | $3.07 | 19d | 1 | 0.90mi |
| 14112 78th Rd Unit 1G Flushing, NY | 1.0 | 1.0 | 700 | $2,200 | $3.14 | 25d | 1 | 0.92mi |
| 150 Greenway Ter Forest Hills, NY | 1.0–2.0 | 1.0 | 937 | $4,300 | $4.59 | 0d | 2 | 0.92mi |
| 150 Greenway Ter Forest Hills, NY | 1.0–2.0 | 1.0 | 937 | $4,300 | $4.59 | 21d | 2 | 0.92mi |
| 11019 72nd Rd Unit 1B Forest Hills, NY | 1.0 | 1.0 | 750 | $3,200 | $4.27 | 14d | 1 | 1.02mi |
| 88-33 144th St Unit 2nd Fl Jamaica, NY | 3.0 | 1.0 | 1100 | $2,600 | $2.36 | 3d | 1 | 1.03mi |
| 7837 Main St Unit 2G Queens, NY | 1.0 | 1.0 | 700 | $2,300 | $3.29 | 25d | 1 | 1.04mi |
| 144-07 Jamaica Ave Unit 3rd Floor Jamaica, NY | 3.0 | 2.0 | 800 | $2,750 | $3.44 | 25d | 1 | 1.06mi |
| 108-25 72nd Ave Unit 6B Flushing, NY | 2.0 | 1.0 | 800 | $3,900 | $4.88 | 0d | 1 | 1.06mi |
| 10825 72nd Ave Forest Hills, NY | 1.0–2.0 | 1.0 | 700 | $3,900 | $5.57 | 5d | 2 | 1.07mi |
| 123-08 95th Ave Unit 2 South Richmond Hill, NY | 2.0 | 1.5 | 1000 | $2,400 | $2.40 | 25d | 1 | 1.08mi |
| 148-16 87th Ave Unit 2 Jamaica, NY | 2.0 | 1.0 | 700 | $2,300 | $3.29 | 18d | 1 | 1.10mi |
HOA detail condo
- Monthly dues
- $0 · $0/yr
- Likely covers
- electric
- Assessments
- None detected in remarks — confirm with the listing agent.
Listing history 9 events
-
2026-06-18statusdays on market $318,000 Pending 250 DOM
-
2026-06-03days on market $318,000 Active 245 DOM
-
2026-06-01days on market $318,000 Active 243 DOM
-
2026-05-31days on market $318,000 Active 242 DOM
-
2026-04-15price $318,000
-
2026-04-07price $319,000
-
2026-04-07status Active
-
2026-03-31historical
-
2025-09-24$348,000 Active
ⓘ Source: listings_history table (triggers on properties + properties_extension) + one-shot
backfill from property_details.listing_events for pre-trigger history.
Climate risk First Street
- Flood 1/10 Low FEMA zone X (unshaded) · 0% chance over 30 yrs
- Wildfire 1/10 Low
- Heat 6/10 Major 7 d/yr ≥99°F today · 14 d/yr by 30 yrs out
- Wind 6/10 Major 52% chance of damaging wind over 30 yrs
- Air quality 4/10 Moderate 6 unhealthy d/yr today · 6 by 30 yrs out
Nearby sold comps map
Loading sold comps map…
Walkable amenities ~0.75 mi
Loading nearby amenities…
Taxation est. · year 1
- Rental income
- $33,282
- − Mortgage interest
- −$17,813
- − Property taxes
- −$4,770
- − Insurance
- −$1,590
- − Repairs & maintenance
- −$2,663
- − Management
- −$2,663
- − Depreciation
- −$9,251
- Taxable loss
- −$5,467
- Est. tax savings @ 24.0%
- +$1,312
- After-tax cash flow
- $1,233/yr
For passive investors: Depreciation is non-cash, so a rental often shows a tax loss while cash-flowing — sheltering income. Rental losses are passive: they offset passive income freely, and up to $25,000/yr can offset ordinary (W-2) income if you actively participate and your MAGI is under $100k (phasing out to $0 by $150k); unused losses carry forward. On sale, claimed depreciation is recaptured at up to 25%, and gains may owe capital-gains tax (a 1031 exchange can defer both). Figures are a year-1 estimate at your 24.0% rate — not tax advice; consult a CPA.
Schools (NCES district)
No district data.
Livability — New York
- Score
- 75/100
- State rank
- #268
- US rank
- #4188
Category grades
Schools grade is shown separately in the Schools card above.
Census & demographics
- Census place
- New York, NY
- County
- Queens County · 1,914,869 people
- City population
- 7,731,280
- Metro
- New York-Newark-Jersey City, NY-NJ-PA
- Population (ZIP)
- 21,154
- Household income
- $86,394
- Rent vs Own
- Severe rent burden
- 1615.0
Population outlook (Queens County) Hauer SSP2
- Today (2025)
- 2,546,320 people
- By 2030
- 2,643,059 · +3.8%
- By 2040
- 2,815,563 · +10.6%
- By 2050
- 2,944,423 · +15.6%
- By 2075
- 3,123,338 · +22.7%
- By 2100
- 3,098,688 · +21.7%
Race, ethnicity, and origin ACS 2023
- Neighborhood character
- Highly diverse neighborhood (Simpson 0.71)
- Race & ethnicity
- White 43% Hispanic / Latino 25% Asian 20% Two or more races 11% Black 6%
- Hispanic origin (detail)
- Mexican 3% Puerto Rican 5% Dominican 4%
- Common ancestry
- Scotch-Irish 6% Romanian 5% Scandinavian 1%
- Foreign-born
- 38% · Canada, Jamaica, China
- Languages at home
- 45% English-only · Spanish 18% Other Indo-European 12% Russian/Polish/Slavic 10%
Political lean MEDSL · Queens
- 2024 margin
- Strong D (+24.6) · D 62.3% · R 37.7%
- 2008→2024 swing
- -26.2pp toward R · 2008: 50.8pp · 2024: 24.6pp
- All cycles
- 2024: D+24.6 2020: D+45.2 2016: D+53.4 2012: D+58.5 2008: D+50.8
Not yet ingested
- Civics
- —
Market trends
- HPI YoY
- ▼ -155.23%
- Current HPI
- 184.7643
- Rent YoY
- ▲ 1.35%
- Metro
- New York-Newark-Jersey City, NY-NJ-PA
- State GDP YoY
- ▲ 2.60%
- F500 in state
- 92
Industry mix (Fortune 500 HQ in NY)
| Industry | F500 HQs | Revenue |
|---|---|---|
| Financial Services | 10 | $950B |
|
||
| Consumer Goods | 9 | $162B |
|
||
| Insurance | 4 | $225B |
|
||
| Telecommunications | 2 | $144B |
|
||
| Pharmaceuticals | 2 | $112B |
|
||
| Media / Entertainment | 2 | $69B |
|
||
Price history
-8.6% since first listed5 events — show timeline
- 2026-04-15 Price Changed $318,000 OneKey® MLS as Distributed by MLS Grid
- 2026-04-07 Price Changed $319,000 OneKey® MLS as Distributed by MLS Grid
- 2026-04-07 Relisted — OneKey® MLS as Distributed by MLS Grid
- 2026-03-31 Listing Removed — OneKey® MLS as Distributed by MLS Grid
- 2025-09-24 Listed $348,000 OneKey® MLS as Distributed by MLS Grid
Cash-flow waterfall
monthlySold comps — $/sqft
last 12 mo · ≤1 miLoading sold comps…