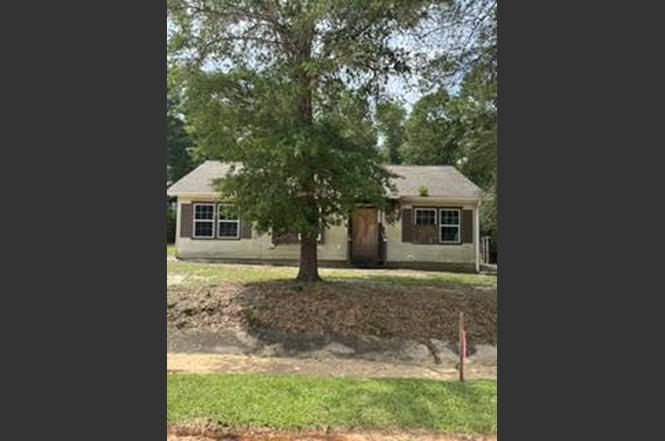
127 W Orange Blossom Ave · DeFuniak Springs, FL
Flood risk 1/10 · Minimal
- FEMA flood zone
- X (unshaded)
- Chance of flooding over 30 yrs
- 0.0%
- Est. flood insurance / yr
- $507 – $1,088
Fire risk 5/10 · Moderate
- Est. fire insurance / yr
- $947 – $1,759
Heat risk 9/10 · Severe
- Hot days now (above 107°F)
- 7 days/yr
- Hot days in 30 yrs
- 20 days/yr
Wind risk 9/10 · Severe
- Chance of severe wind over 30 yrs
- 99.0%
Air-quality risk 1/10 · Minimal
- Unhealthy air days now
- 0 days/yr
- Unhealthy air days in 30 yrs
- 0 days/yr
Risk factors via First Street. Map © Google.
Why this score? — see what drove the A- grade
The composite is a weighted blend of 9 inputs, each scored 0–100. Each bar is that input's sub-score; the figure is the points it added to the 100-point composite (weight × sub-score).
- Cash flow +30.0/30.0
- 1% rule +10.0/10.0
- DSCR +10.0/10.0
- Appreciation +10.0/10.0
- ARV discount +7.5/15.0
- Schools +5.2/10.0
- Livability +3.2/5.0
- Rent growth +2.5/5.0
- Condition / age +2.5/5.0
$59,900
🖨 Deal sheet 📄 Offer letter ✓ Due diligence
Listing remarks MLS
THIS IS A MUST SEE HOME!!! This renovated 3 bedroom 2 bath home features a split bedroom floor plan. The interior of the home has NEW, paint, flooring (carpet in living areas and wood vinyl in wet areas), water heated, stainless steel appliances, light fixtures (including ceiling fans in every bedroom), faucets, kitchen and bathroom counters. Exterior has privacy fence, landscaped yard with new sod, and a large deck for family gatherings. Call today and make an appointment to view this property.
Key facts
- 0.23 acre lot
- Built 2006
Property features AI
Finance
- HOA & community: Subdivision: OAKWOOD HILLS UNIT 1
Exterior
- Utilities: Community water; Septic tank; Electric water heater; Electric power (implied by electric heating/cooling features)
- Home design: Single-story (1 story); Contemporary style; Built in 2006; Foundation: Off grade
- Construction: Foundation off grade
- Exterior features: Cleared, level lot; Dirt/Clay road access
Interior
- Kitchen: Electric water heater (listed under appliances)
- Bedrooms: 3 bedrooms total; Primary bedroom located on the first floor
- Bathrooms: 2 full bathrooms
- Heating & cooling: Central heating; Central air conditioning; Electric heat control
- Interior features: Contemporary layout with 8 total rooms; First-floor living and dining areas; Laundry room on the first floor
- Laundry & utility: First-floor laundry
Neighborhood map
What this means for you Summary
Snapshot
- This is a 3-bed/2.0-bath single-family listed at $60k.
Deal economics
- At list price, monthly cash flow is $1k ($13k/yr) — positive.
- The deal already cash-flows at list — no discount required.
- Meets the 1% rule at list price ($2k rent vs $60k).
- Cap rate 28.0% vs local median 4.8% in DeFuniak Springs — top-decile yield for the area; either an underpriced asset or a hidden risk that comps aren't pricing in. Stress-test before assuming the spread holds.
Location & tenants
- Location reads 64/100 on livability (#694 in FL) — a middle-class / working-renter tenant base. Strengths: cost of living A+, housing A+; Watch: health & safety C-, crime D, amenities F.
- Walton (rural): math 62% / reading 61% proficiency, ranked #10 of 73 in FL (top 14%) — acceptable for families but not a draw, mixed tenant base, ~2y average lease.
- Zoned schools: Mossy Head School (math 72% / reading 57%, grade B, #525 of 2,144 statewide, top 26%, 439 students, 86% FRL); Walton High School (math 52% / reading 53%, grade C-, #154 of 667 statewide, top 24%, 856 students, 65% FRL) — zoned schools average 75% FRL vs 48% district-wide (27 pts higher); higher-poverty schools than district average — tighter screening recommended.
- Market conditions: 422 active listings in the ZIP; 2 comparable units currently listed for rent nearby; 2,883 units permitted in Walton County in 2024 (1,322 in 5+ unit buildings).
- This rent runs 43% of the median local income ($52k/yr) — at the standard rent-burdened threshold; future hikes will face affordability resistance.
Forward outlook
- In year one you build about $6k of equity ($414 loan paydown + $6k appreciation (10.0% local appreciation)).
- Walton County population projected at +46% by 2050 — long-run rental-demand tailwind backs the buy-and-hold thesis.
- At projected returns (10.0% appreciation + 3.0% rent growth), your $17k cash investment doubles in ~1 year — after that, you're playing with house money.
- By year 6, paydown + projected appreciation supports a ~$38k cash-out refi (75% LTV) — recoverable capital for the next deal without selling this one.
Negotiation context
- Only 1 days on market — expect competitive offers; lowballing is unlikely to land.
- 9 sale attempts since 12y ago with the ask held roughly flat each time — persistent listings suggest the price (not the market) is what's stuck; bring a comps-based counter.
Risks & watch-outs
- Climate carrying-cost: severe wind risk, 99% chance of damaging wind over 30y; moderate wildfire risk; extreme-heat days projected 7→20/yr by 2055 (HVAC capex compounding) — expect insurance premiums to compound above CPI over the hold.
Questions for the listing agent
- Is there a deadline driving the sale (1031 exchange, divorce, estate, relocation)? That informs how much negotiation room exists.
- Schools are D-rated, which usually means shorter tenancies and higher turnover. Who's the typical renter profile here, and what's been the actual vacancy rate?
- Crime grade is D in this area — have there been break-ins, vandalism, or insurance claims at this property in the last 3 years? What carrier currently insures it and at what premium?
- What's the average days-on-market for RENTAL listings here right now (not sales)? A rising rental-DOM trend means longer vacancies and softer asking-rent achievability than the comps imply.
- What's the recent tenant-quality profile in this submarket — average credit score on applications, eviction rate, late-payment / NSF rate, and stable-employment percentage? A property-management company in the area should have these aggregated.
- How much new for-sale + rental construction is in the pipeline within 1–3 miles? Heavy new supply typically softens prices + rents 12–24 months out; constrained supply supports both.
Investment metrics
- 1% rule
- 3.09% ✓
- Cap rate
- 27.95%
- Cash-on-cash
- 77.35%
- DSCR
- 4.44
- GRM
- 2.7
CMA / ARV
- ARV (on-the-fly)
- $251,165
- Comps found
- 12
Show comp detail 12 sales within ~0.75 mi
| Address | Dist | Beds/Ba | Sqft | Sold | Price | $/sf | Match |
|---|---|---|---|---|---|---|---|
| 94 W Oleander Ave | 0.21mi | 3/2.0 | 1,363 (+4%) | 6mo | $274,900 | $202 | 80 |
| 470 E Marigold East Ave | 0.31mi | 3/2.0 | 1,363 (+4%) | 2mo | $251,000 | $184 | 78 |
| 43 E Crocus Ave | 0.41mi | 3/2.0 | 1,363 (+4%) | 2mo | $262,000 | $192 | 73 |
| 38 W Crocus Ave | 0.40mi | 3/2.0 | 1,272 (-3%) | 12mo | $206,990 | $163 | 66 |
| 103 E Hyacinth Ave | 0.25mi | 3/2.0 | 1,165 (-11%) | 13mo | $215,000 | $185 | 59 |
| 224 E Iris Ln | 0.48mi | 3/2.0 | 1,165 (-11%) | 1mo | $209,000 | $179 | 58 |
| 344 Marigold Ave | 0.43mi | 3/2.0 | 1,200 (-9%) | 10mo | $229,000 | $191 | 57 |
| 92 E Larkspur Ave | 0.41mi | 3/2.0 | 1,145 (-13%) | 11mo | $224,000 | $196 | 50 |
| 20 Country Blvd | 0.75mi | 3/2.0 | 1,363 (+4%) | 12mo | $270,000 | $198 | 49 |
| 95 E Dogwood Ave | 0.43mi | 3/2.0 | 1,145 (-13%) | 12mo | $219,000 | $191 | 49 |
| 969 Walden Rd | 0.43mi | 2/2.0 (-1) | 1,152 (-12%) | 8mo | $200,990 | $174 | 48 |
| 145 E Dogwood Ave | 0.46mi | 3/2.0 | 1,145 (-13%) | 12mo | $219,000 | $191 | 47 |
Match score weights: distance 35% · size 25% · config 20% · recency 20%. Top-matched comps best support the ARV.
Projected returns pro-forma
10.0% appreciation · 3.0% rent growth · sell at horizon
- IRR
- 87.6%
- Equity multiple
- 7.05×
- Total profit
- $101,488
- Equity at exit
- $53,963
- IRR
- 82.2%
- Equity multiple
- 15.59×
- Total profit
- $244,734
- Equity at exit
- $116,373
Cash invested: $16,772 (down + closing). Projections, not guarantees.
Landlord ↔ Tenant lean methodology
- Overall (STATE)
- 87 Strongly Landlord-Friendly
- State Florida
- 87 Strongly Landlord-Friendly · R+3
- County
- — inherits STATE
- City
- — inherits STATE
ZIP-level market 32433
- Home prices YoY
- 4.2%
- Active inventory
- 422
- Price-to-rent
- 2.7×
Monthly cashflow live
- Estimated rent
- $1,852 medium interval (Pro) →
- Mortgage (P&I)
- −$314
- Tax from tax record
- −$43 /mo · $519/yr
- Insurance
- −$25
- HOA
- −$0
- Vacancy / Maint / Mgmt
- −$389
- Net cashflow
- $1,081
Break-even live
UW: 25.0% down · 7.5% · 30yr · 1.5% tax · 5.0% vac · 8.0% maint · 8.0% mgmt
Financing live
Cash to close
- Down payment
- $14,975
- Closing costs
- $1,797
- Reserves months
- —
- Total cash needed
- —
Loan-product check · same deal, 3 products live
Conventional
25% down · 7.5% · 30yr
- Down + closing
- —
- Monthly P&I
- —
- Monthly cashflow
- —
- DSCR
- —
- Eligible?
- —
Personal DTI + credit; lowest rate.
DSCR
20% down · 8.5% · 30yr
- Down + closing
- —
- Monthly P&I
- —
- Monthly cashflow
- —
- DSCR
- —
- Eligible?
- —
No personal income docs; deal must DSCR.
Hard money
10% down · 12.0% · 12mo
- Down + closing
- —
- Monthly P&I
- —
- Monthly cashflow
- —
- DSCR
- —
- Eligible?
- —
Short-term bridge; refi at stabilization.
Rent comps 2 comps
| Address | Beds | Baths | Sqft | Rent | $/sqft | DOM | Units | Dist |
|---|---|---|---|---|---|---|---|---|
| 150 Hibiscus Ave Defuniak Springs, FL | 3.0 | 2.0 | 1256 | $1,950 | $1.55 | 21d | 1 | 0.26mi |
| 135 Tiger Lily Ln Defuniak Springs, FL | 3.0 | 2.0 | 1114 | $1,795 | $1.61 | 13d | 1 | 0.72mi |
Listing history 2 events
-
2026-06-18remarks 214-char remark
-
2026-06-18$59,900 Active 1 DOM
ⓘ Source: listings_history table (triggers on properties + properties_extension) + one-shot
backfill from property_details.listing_events for pre-trigger history.
Tax reassessment forecast FL · Resets to sale price
- Current annual tax
- $519 · $43/mo
- Projected year-2 tax
- $519 · $43/mo
- Expected delta
- $0/yr ($0/mo · 0.0%)
ⓘ Screening estimate from a state-policy table — verify with the county assessor before closing.
Climate risk First Street
- Flood 1/10 Low FEMA zone X (unshaded) · 0% chance over 30 yrs
- Wildfire 5/10 Major
- Heat 9/10 Extreme 7 d/yr ≥107°F today · 20 d/yr by 30 yrs out
- Wind 9/10 Extreme 99% chance of damaging wind over 30 yrs
- Air quality 1/10 Low 0 unhealthy d/yr today · 0 by 30 yrs out
Nearby sold comps map
Loading sold comps map…
Walkable amenities ~0.75 mi
Loading nearby amenities…
Taxation est. · year 1
- Rental income
- $22,229
- − Mortgage interest
- −$3,355
- − Property taxes
- −$519
- − Insurance
- −$300
- − Repairs & maintenance
- −$1,778
- − Management
- −$1,778
- − Depreciation
- −$1,743
- Taxable income
- $12,756
- Est. tax owed @ 24.0%
- −$3,062
- After-tax cash flow
- $9,912/yr
For passive investors: Depreciation is non-cash, so a rental often shows a tax loss while cash-flowing — sheltering income. Rental losses are passive: they offset passive income freely, and up to $25,000/yr can offset ordinary (W-2) income if you actively participate and your MAGI is under $100k (phasing out to $0 by $150k); unused losses carry forward. On sale, claimed depreciation is recaptured at up to 25%, and gains may owe capital-gains tax (a 1031 exchange can defer both). Figures are a year-1 estimate at your 24.0% rate — not tax advice; consult a CPA.
Schools (NCES district)
- District
- Walton
- NCES district ID
- 1201980
- Math proficiency
- 62% ▼ -4.00%
- Reading proficiency
- 61% ▼ -2.00%
- Median HH income
- $46,794
- Composite
- 52.03/100
- National rank
- #1634
- State rank
- #10 of 73 in FL
Livability — DeFuniak Springs
- Score
- 64/100
- State rank
- #694
- US rank
- #14475
Category grades
Schools grade is shown separately in the Schools card above.
Census & demographics
- County
- Walton County · 70,839 people
- City population
- 19,746
- Metro
- Crestview-Fort Walton Beach-Destin, FL
- Population (ZIP)
- 19,746
- Household income
- $52,199
- Rent vs Own
- Severe rent burden
- 356.0
Population outlook (Walton County) Hauer SSP2
- Today (2025)
- 80,014 people
- By 2030
- 88,120 · +10.1%
- By 2040
- 103,537 · +29.4%
- By 2050
- 117,034 · +46.3%
- By 2075
- 143,901 · +79.8%
- By 2100
- 155,138 · +93.9%
Race, ethnicity, and origin ACS 2023
- Neighborhood character
- Predominantly White (75%)
- Race & ethnicity
- White 75% Black 10% Hispanic / Latino 8% Two or more races 7% Native American 1%
- Hispanic origin (detail)
- Mexican 5%
- Common ancestry
- Slovak 3% Italian 2% Lithuanian 2%
- Foreign-born
- 6% · Canada
- Languages at home
- 92% English-only · Spanish 4% Other Indo-European 1% French/Haitian/Cajun 1%
Political lean MEDSL · Walton
- 2024 margin
- Solid R (+57.8) · D 20.7% · R 78.6%
- 2008→2024 swing
- -12.0pp toward R · 2008: -45.8pp · 2024: -57.8pp
- All cycles
- 2024: R+57.8 2020: R+51.7 2016: R+56.1 2012: R+52.0 2008: R+45.8
Not yet ingested
- Civics
- —
Market trends
- HPI YoY
- ▲ 14.77%
- Current HPI
- 367.046
- Rent YoY
- —
- Metro
- Crestview-Fort Walton Beach-Destin, FL
- State GDP YoY
- ▲ 3.28%
- F500 in state
- 36
Industry mix (Fortune 500 HQ in FL)
| Industry | F500 HQs | Revenue |
|---|---|---|
| Industrial Technology | 2 | $29B |
|
||
| Insurance | 2 | $17B |
|
||
| Retail | 1 | $60B |
|
||
| Technology Distribution | 1 | $58B |
|
||
| Homebuilding | 1 | $35B |
|
||
| Technology Manufacturing | 1 | $35B |
|
||
Price history
+530.5% since first listed20 events — show timeline
- 2026-06-17 Listed $59,900 ECAR
- 2017-02-02 Sold (Public Records) $100,000 Public Records
- 2017-01-30 Sold (MLS) $100,000 NAMLS
- 2017-01-30 Sold (MLS) $100,000 ECAR
- 2016-10-16 Listed $105,000 NAMLS
- 2016-08-31 Sold (MLS) $42,000 ECAR
- 2016-08-31 Sold (MLS) $42,000 NAMLS
- 2016-07-02 Listing Removed — NAMLS
- 2016-06-28 Listed $49,900 NAMLS
- 2016-02-02 Listed $49,900 NAMLS
- 2016-02-02 Listed $49,900 ECAR
- 2016-01-06 Listing Removed — NAMLS
- 2015-10-30 Listed $64,900 ECAR
- 2015-10-30 Listed $64,900 NAMLS
- 2014-10-02 Listing Removed — NAMLS
- 2014-08-13 Listed $49,900 NAMLS
- 2014-08-13 Listed $49,900 ECAR
- 2006-05-19 Sold (Public Records) $165,000 Public Records
- 2005-08-22 Sold (Public Records) $19,500 Public Records
- 2005-05-04 Sold (Public Records) $9,500 Public Records
Property tax history
-2.5%/yrLatest (2025): $519 · +12.6% YoY. Source: county tax records.
Cash-flow waterfall
monthlySold comps — $/sqft
last 12 mo · ≤1 miLoading sold comps…