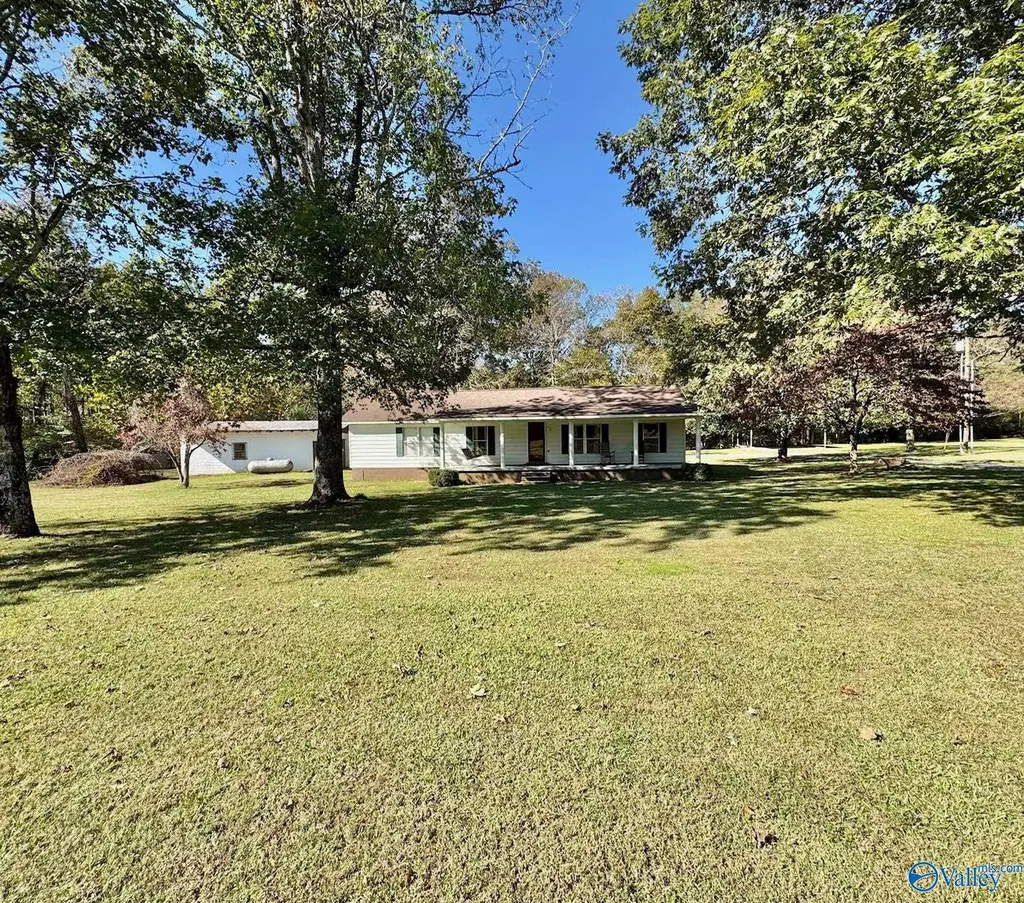
120 Mason Rd · Hazel Green, AL
Flood risk 8/10 · Major
- FEMA flood zone
- A
- Chance of flooding over 30 yrs
- 0.99%
- Est. flood insurance / yr
- $1,009 – $1,996
Fire risk 4/10 · Minor
- Est. fire insurance / yr
- $916 – $1,700
Heat risk 5/10 · Moderate
- Hot days now (above 104°F)
- 7 days/yr
- Hot days in 30 yrs
- 19 days/yr
Wind risk 4/10 · Minor
- Chance of severe wind over 30 yrs
- 15.0%
Air-quality risk 2/10 · Minimal
- Unhealthy air days now
- 2 days/yr
- Unhealthy air days in 30 yrs
- 2 days/yr
Risk factors via First Street. Map © Google.
Why this score? — see what drove the C grade
The composite is a weighted blend of 9 inputs, each scored 0–100. Each bar is that input's sub-score; the figure is the points it added to the 100-point composite (weight × sub-score).
- Cash flow +16.9/30.0
- Appreciation +10.0/10.0
- ARV discount +7.5/15.0
- DSCR +5.3/10.0
- 1% rule +4.6/10.0
- Schools +3.7/10.0
- Livability +3.5/5.0
- Rent growth +2.5/5.0
- Condition / age +2.5/5.0
$169,900
🖨 Deal sheet (PDF) 📄 Offer letter ✓ Due diligence
Listing remarks MLS
THIS ONE OWNER PROPERTY IS SITTING ON OVER AN ACRE! 59X34 DETACHED GARAGE, 22X18 GAZEBO WITH CONCRETE FLOOR, 42X27 CARPORT! COVERED FRONT AND BACK PORCHES! 3 BEDROOMS, 2 BATHROOMS, 2 LIVING AREAS! PROPERTY BEING SOLD AS IS.
Key facts
- Covered front porch
- Carport
- Detached garage
Tags
Neighborhood map
What this means for you Summary
Snapshot
- This is a 3-bed/1.0-bath single-family listed at $170k.
Deal economics
- At list price, monthly cash flow is $-12 ($-149/yr) — negative.
- To cash-flow at today's rent, offer at most $168k (1.1% below list).
- To meet the 1% rule (rent ≥ 1% of price), the offer needs to be $163k (4.1% below list).
- Recommended offer: $150k (12.0% below list) — sets the bar for market timing.
- Cap rate 7.1% vs local median 3.9% in Hazel Green — top-decile yield for the area; either an underpriced asset or a hidden risk that comps aren't pricing in. Stress-test before assuming the spread holds.
Location & tenants
- Location reads 69/100 on livability (#54 in AL) — a middle-class / working-renter tenant base. Strengths: cost of living A+, housing A+, crime A; Watch: schools C-, amenities F, commute F.
- Madison County (rural): math 27% / reading 56% proficiency, ranked #19 of 129 in AL (top 15%) — families likely to look elsewhere, expect single-tenant / working-renter base with shorter leases.
- Market conditions: 256 active listings in the ZIP; 6 comparable units currently listed for rent nearby; rentals lingering (median 44d on market — plan ~5-8 weeks vacancy on turnover, expect pricing pressure); 67% of comp listings sitting > 30 days — soft ceiling on asking rent; 4,709 units permitted in Madison County in 2024 (1,186 in 5+ unit buildings).
Forward outlook
- In year one you build about $18k of equity ($1k loan paydown + $17k appreciation (10.0% local appreciation)).
- Madison County population projected at +18% by 2050 — long-run rental-demand tailwind backs the buy-and-hold thesis.
- At projected returns (10.0% appreciation + 3.0% rent growth), your $48k cash investment doubles in ~3 years — after that, you're playing with house money.
- By year 3, paydown + projected appreciation supports a ~$46k cash-out refi (75% LTV) — recoverable capital for the next deal without selling this one.
Negotiation context
- It's been on market 226 days — a 12% lower offer ($150k) is reasonable based on typical stale-listing flexibility.
- 2 sale attempts; this cycle's ask has dropped $55k (24%) from the opening price — seller is motivated, your offer sets the floor, not the list.
Risks & watch-outs
- Watch-outs: flood insurance adds $125/mo.
- Climate carrying-cost: in FEMA flood zone A (mandatory federal flood insurance); extreme-heat days projected 7→19/yr by 2055 (HVAC capex compounding) — expect insurance premiums to compound above CPI over the hold.
Questions for the listing agent
- What do current leases actually rent for vs. the listed asking? Can we see a recent rent roll and the last 12 months of T-12 income?
- It's been on market 226 days. Have you received any prior offers? Is the seller open to a 12% concession, seller financing, or rate buy-down credit?
- Built in 1974 — when were the roof, HVAC, electrical panel, plumbing, and water heater last replaced?
- What's the actual annual flood-insurance premium (NFIP or private), and is the property in a SFHA with mandatory coverage?
- Why hasn't it sold? Are there any deal-killer items the seller is aware of (foundation, flood, title, zoning, code violations)?
- Is there a deadline driving the sale (1031 exchange, divorce, estate, relocation)? That informs how much negotiation room exists.
- What's the average days-on-market for RENTAL listings here right now (not sales)? A rising rental-DOM trend means longer vacancies and softer asking-rent achievability than the comps imply.
- What's the recent tenant-quality profile in this submarket — average credit score on applications, eviction rate, late-payment / NSF rate, and stable-employment percentage? A property-management company in the area should have these aggregated.
- How much new for-sale + rental construction is in the pipeline within 1–3 miles? Heavy new supply typically softens prices + rents 12–24 months out; constrained supply supports both.
Investment metrics
- 1% rule
- 0.96% ✗
- Cap rate
- 7.09%
- Cash-on-cash
- 2.84%
- DSCR
- 1.13
- GRM
- 8.7
CMA / ARV
- ARV (on-the-fly)
- $445,536
- Comps found
- 2
Show comp detail 2 sales within ~0.75 mi
| Address | Dist | Beds/Ba | Sqft | Sold | Price | $/sf | Match |
|---|---|---|---|---|---|---|---|
| 196 Mason Rd | 0.18mi | 3/2.5 | 1,600 (-14%) | 15mo | $380,000 | $238 | 49 |
| 110 Chapel Creek Dr | 0.65mi | 3/2.0 | 1,603 (-14%) | 20mo | $265,000 | $165 | 24 |
Match score weights: distance 35% · size 25% · config 20% · recency 20%. Top-matched comps best support the ARV.
Projected returns pro-forma
10.0% appreciation · 3.0% rent growth · sell at horizon
- IRR
- 24.1%
- Equity multiple
- 2.93×
- Total profit
- $91,841
- Equity at exit
- $153,059
- IRR
- 21.4%
- Equity multiple
- 6.70×
- Total profit
- $271,281
- Equity at exit
- $330,078
Cash invested: $47,572 (down + closing). Projections, not guarantees.
Landlord ↔ Tenant lean methodology
- Overall (STATE)
- 90 Strongly Landlord-Friendly
- State Alabama
- 90 Strongly Landlord-Friendly · R+15
- County
- — inherits STATE
- City
- — inherits STATE
ZIP-level market 35750
- Home prices YoY
- 8.2%
- Active inventory
- 256
- Price-to-rent
- 8.7×
Monthly cashflow live
- Estimated rent
- $1,629 high interval (Pro) →
- Mortgage (P&I)
- −$891
- Tax est. 1.5%
- −$212 /mo · $2,548/yr
- Insurance
- −$71
- Flood insurance flood zone
- −$125 /mo · $1,502/yr
- HOA
- −$0
- Vacancy / Maint / Mgmt
- −$342
- Net cashflow
- $-12
Break-even live
Sensitivity live
| Price | -10% $105 | -5% $46 | +0% $-12 | +5% $-71 | +10% $-130 |
|---|---|---|---|---|---|
| Rent | -10% $-141 | -5% $-77 | +0% $-12 | +5% $52 | +10% $116 |
| Rate | -1.0pp $73 | -0.5pp $31 | base $-12 | +0.5pp $-56 | +1.0pp $-101 |
UW: 25.0% down · 7.5% · 30yr · 1.5% tax · 5.0% vac · 8.0% maint · 8.0% mgmt
Financing live
Cash to close
- Down payment
- $42,475
- Closing costs
- $5,097
- Reserves months
- —
- Total cash needed
- —
Loan-product check · same deal, 3 products live
Conventional
25% down · 7.5% · 30yr
- Down + closing
- —
- Monthly P&I
- —
- Monthly cashflow
- —
- DSCR
- —
- Eligible?
- —
Personal DTI + credit; lowest rate.
DSCR
20% down · 8.5% · 30yr
- Down + closing
- —
- Monthly P&I
- —
- Monthly cashflow
- —
- DSCR
- —
- Eligible?
- —
No personal income docs; deal must DSCR.
Hard money
10% down · 12.0% · 12mo
- Down + closing
- —
- Monthly P&I
- —
- Monthly cashflow
- —
- DSCR
- —
- Eligible?
- —
Short-term bridge; refi at stabilization.
Rent comps 6 comps
| Address | Beds | Baths | Sqft | Rent | $/sqft | DOM | Units | Dist |
|---|---|---|---|---|---|---|---|---|
| 120 Grip Dr Hazel Green, AL | 4.0 | 2.0 | 1732 | $1,823 | $1.05 | 21d | 1 | 0.80mi |
| 204 Fern Bank Dr Unit A Hazel Green, AL | 3.0 | 2.0 | 1240 | $1,500 | $1.21 | 44d | 1 | 1.36mi |
| 204 Fern Bank Dr Unit B Hazel Green, AL | 3.0 | 2.0 | 1240 | $1,500 | $1.21 | 44d | 1 | 1.36mi |
| 109 Blue Heron Way Hazel Green, AL | 3.0 | 2.0 | 1257 | $1,440 | $1.15 | 44d | 1 | 1.37mi |
| 223 Fern Bank Dr Hazel Green, AL | 3.0 | 2.0 | 1257 | $1,440 | $1.15 | 44d | 1 | 1.43mi |
| 100 Brook Glen Dr Hazel Green, AL | 3.0 | 2.0 | 1336 | $1,595 | $1.19 | 14d | 1 | 1.48mi |
Listing history 18 events
-
2026-06-18days on market $169,900 Active 226 DOM
-
2026-06-17days on market $169,900 Active 225 DOM
-
2026-06-16days on market $169,900 Active 224 DOM
-
2026-06-15days on market $169,900 Active 223 DOM
-
2026-06-14days on market $169,900 Active 221 DOM
-
2026-06-10days on market $169,900 Active 218 DOM
-
2026-06-09days on market $169,900 Active 217 DOM
-
2026-06-08days on market $169,900 Active 216 DOM
-
2026-06-07days on market $169,900 Active 215 DOM
-
2026-06-02days on market $169,900 Active 210 DOM
-
2026-06-01days on market $169,900 Active 209 DOM
-
2026-05-31days on market $169,900 Active 208 DOM
-
2026-05-30days on market $169,900 Active 207 DOM
-
2026-05-13price $169,900 227-char remark
Show marketing remark (227 chars)
THIS ONE OWNER PROPERTY IS SITTING ON OVER AN ACRE! 59X34 DETACHED GARAGE, 22X18 GAZEBO WITH CONCRETE FLOOR, 42X27 CARPORT! COVERED FRONT AND BACK PORCHES! 3 BEDROOMS, 2 BATHROOMS, 2 LIVING AREAS! PROPERTY BEING SOLD AS IS.
-
2026-05-04status Active 227-char remark
Show marketing remark (227 chars)
THIS ONE OWNER PROPERTY IS SITTING ON OVER AN ACRE! 59X34 DETACHED GARAGE, 22X18 GAZEBO WITH CONCRETE FLOOR, 42X27 CARPORT! COVERED FRONT AND BACK PORCHES! 3 BEDROOMS, 2 BATHROOMS, 2 LIVING AREAS! PROPERTY BEING SOLD AS IS.
-
2026-04-23status Pending 227-char remark
Show marketing remark (227 chars)
THIS ONE OWNER PROPERTY IS SITTING ON OVER AN ACRE! 59X34 DETACHED GARAGE, 22X18 GAZEBO WITH CONCRETE FLOOR, 42X27 CARPORT! COVERED FRONT AND BACK PORCHES! 3 BEDROOMS, 2 BATHROOMS, 2 LIVING AREAS! PROPERTY BEING SOLD AS IS.
-
2026-02-02price $199,900 227-char remark
Show marketing remark (227 chars)
THIS ONE OWNER PROPERTY IS SITTING ON OVER AN ACRE! 59X34 DETACHED GARAGE, 22X18 GAZEBO WITH CONCRETE FLOOR, 42X27 CARPORT! COVERED FRONT AND BACK PORCHES! 3 BEDROOMS, 2 BATHROOMS, 2 LIVING AREAS! PROPERTY BEING SOLD AS IS.
-
2025-10-24$225,000 Active 227-char remark
Show marketing remark (227 chars)
THIS ONE OWNER PROPERTY IS SITTING ON OVER AN ACRE! 59X34 DETACHED GARAGE, 22X18 GAZEBO WITH CONCRETE FLOOR, 42X27 CARPORT! COVERED FRONT AND BACK PORCHES! 3 BEDROOMS, 2 BATHROOMS, 2 LIVING AREAS! PROPERTY BEING SOLD AS IS.
ⓘ Source: listings_history table (triggers on properties + properties_extension) + one-shot
backfill from property_details.listing_events for pre-trigger history.
Climate risk First Street
- Flood 8/10 Severe FEMA zone A · 99% chance over 30 yrs
- Wildfire 4/10 Moderate
- Heat 5/10 Major 7 d/yr ≥104°F today · 19 d/yr by 30 yrs out
- Wind 4/10 Moderate 15% chance of damaging wind over 30 yrs
- Air quality 2/10 Low 2 unhealthy d/yr today · 2 by 30 yrs out
Nearby sold comps map
Loading sold comps map…
Walkable amenities ~0.75 mi
Loading nearby amenities…
Taxation est. · year 1
- Rental income
- $19,548
- − Mortgage interest
- −$9,517
- − Property taxes
- −$2,548
- − Insurance
- −$2,352
- − Repairs & maintenance
- −$1,564
- − Management
- −$1,564
- − Depreciation
- −$4,943
- Taxable loss
- −$2,940
- Est. tax savings @ 24.0%
- +$706
- After-tax cash flow
- $556/yr
For passive investors: Depreciation is non-cash, so a rental often shows a tax loss while cash-flowing — sheltering income. Rental losses are passive: they offset passive income freely, and up to $25,000/yr can offset ordinary (W-2) income if you actively participate and your MAGI is under $100k (phasing out to $0 by $150k); unused losses carry forward. On sale, claimed depreciation is recaptured at up to 25%, and gains may owe capital-gains tax (a 1031 exchange can defer both). Figures are a year-1 estimate at your 24.0% rate — not tax advice; consult a CPA.
Schools (NCES district)
- District
- Madison County
- NCES district ID
- 0102220
- Math proficiency
- 27% ▼ -32.00%
- Reading proficiency
- 56% ▼ -1.00%
- Median HH income
- $66,058
- Composite
- 37.15/100
- National rank
- #4483
- State rank
- #19 of 129 in AL
Livability — Hazel Green
- Score
- 69/100
- State rank
- #54
- US rank
- #8575
Category grades
Schools grade is shown separately in the Schools card above.
Census & demographics
- County
- Madison County · 380,832 people
- City population
- 13,413
- Metro
- Huntsville, AL
- Population (ZIP)
- 13,413
- Household income
- $68,389
- Rent vs Own
- Severe rent burden
- 162.0
Population outlook (Madison County) Hauer SSP2
- Today (2025)
- 392,086 people
- By 2030
- 409,788 · +4.5%
- By 2040
- 440,557 · +12.4%
- By 2050
- 460,990 · +17.6%
- By 2075
- 502,872 · +28.3%
- By 2100
- 513,623 · +31.0%
Race, ethnicity, and origin ACS 2023
- Neighborhood character
- Predominantly White (71%)
- Race & ethnicity
- White 71% Black 19% Asian 5% Two or more races 3% Hispanic / Latino 2%
- Common ancestry
- Slovak 1% Serbian 1% Romanian 1%
- Foreign-born
- 3% · Canada
- Languages at home
- 95% English-only · Spanish 2% Chinese 1% Korean 1%
Political lean MEDSL · Madison
- 2024 margin
- Lean R (+9.0) · D 44.7% · R 53.7% · Other 1.6%
- 2008→2024 swing
- +6.0pp toward D · 2008: -14.9pp · 2024: -9.0pp
- All cycles
- 2024: R+9.0 2020: R+8.0 2016: R+16.8 2012: R+18.7 2008: R+14.9
Not yet ingested
- Civics
- —
Market trends
- HPI YoY
- ▲ 33.59%
- Current HPI
- 444.7418
- Rent YoY
- —
- Metro
- Huntsville, AL
- State GDP YoY
- ▲ 2.94%
- F500 in state
- 4
Industry mix (Fortune 500 HQ in AL)
| Industry | F500 HQs | Revenue |
|---|---|---|
| Financial Services | 1 | $8B |
|
||
| Healthcare | 1 | $5B |
|
||
Price history
-24.5% since first listed5 events — show timeline
- 2026-05-13 Price Changed $169,900 VMLS
- 2026-05-04 Relisted — VMLS
- 2026-04-23 Pending — VMLS
- 2026-02-02 Price Changed $199,900 VMLS
- 2025-10-24 Listed $225,000 VMLS
Cash-flow waterfall
monthlySold comps — $/sqft
last 12 mo · ≤1 miLoading sold comps…