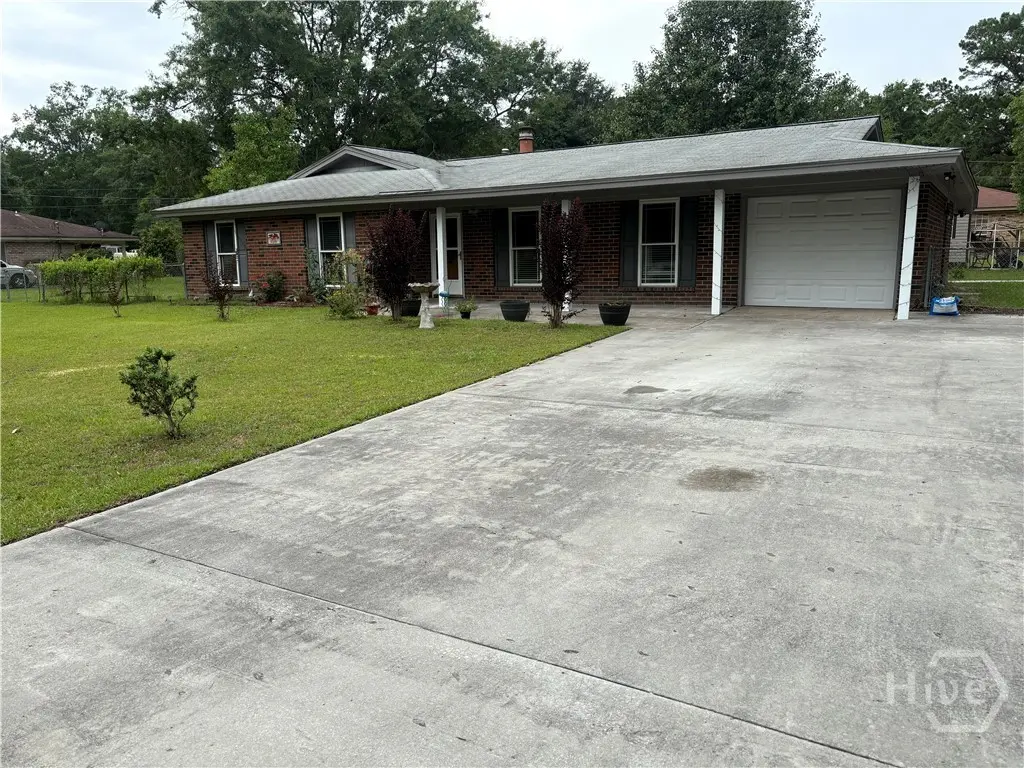
717 Bradwell St · Hinesville, GA
Flood risk 1/10 · Minimal
- FEMA flood zone
- X (unshaded)
- Chance of flooding over 30 yrs
- 0.0%
- Est. flood insurance / yr
- $507 – $1,088
Fire risk 3/10 · Minor
- Est. fire insurance / yr
- $963 – $1,789
Heat risk 9/10 · Severe
- Hot days now (above 110°F)
- 7 days/yr
- Hot days in 30 yrs
- 18 days/yr
Wind risk 8/10 · Major
- Chance of severe wind over 30 yrs
- 99.0%
Air-quality risk 2/10 · Minimal
- Unhealthy air days now
- 2 days/yr
- Unhealthy air days in 30 yrs
- 2 days/yr
Risk factors via First Street. Map © Google.
Why this score? — see what drove the C grade
The composite is a weighted blend of 9 inputs, each scored 0–100. Each bar is that input's sub-score; the figure is the points it added to the 100-point composite (weight × sub-score).
- Cash flow +20.9/30.0
- ARV discount +11.8/15.0
- DSCR +6.7/10.0
- 1% rule +5.2/10.0
- Rent growth +3.9/5.0
- Livability +3.7/5.0
- Condition / age +2.5/5.0
- Schools +2.0/10.0
- Appreciation +0.0/10.0
$214,000
🖨 Deal sheet 📄 Offer letter ✓ Due diligence
Listing remarks
New opportunity is now available in a heart of Hinesville whether you’re searching for your first home or next investment property or a place close to Fort Stewart this home deserves a look, convenient location, comfortable living space minutes from shopping and dining school and Fort Stewart great opportunity for homeowners investors alike bathroom and doorways. ADA installed door way great for wheelchair accessibility and outside shed with electricity. Wood burning fireplace.
Key facts
- 1,786 sq ft lot
- Garage
- Built 1978
Property features AI
Exterior
- Parking: Detached garage with garage door opener (1 car); Carport (2 cars); RV access/parking; Additional 'Other' parking features
- Utilities: Public water; Public sewer
- Home design: Single-family residence, single-story; Attached property with no common walls
- Construction: Brick construction; Built as a single-story
- Exterior features: Small lot with a view
Interior
- Bathrooms: 2 full bathrooms
- Heating & cooling: Central heating (electric and natural gas); Central electric air conditioning
- Interior features: Wood-burning fireplace in the family room; Gas water heater
- Laundry & utility: Dedicated laundry room
Neighborhood map
What this means for you Summary
Snapshot
- This is a 3-bed/2.0-bath single-family listed at $214k.
Deal economics
- At list price, monthly cash flow is $300 ($4k/yr) — positive.
- The deal already cash-flows at list — no discount required.
- Meets the 1% rule at list price ($2k rent vs $214k).
- Recommended offer: $211k (1.5% below list) — sets the bar for market timing.
- Cap rate 8.0% vs local median 5.2% in Hinesville — top-decile yield for the area; either an underpriced asset or a hidden risk that comps aren't pricing in. Stress-test before assuming the spread holds.
Location & tenants
- Location reads 73/100 on livability (#51 in GA) — a middle-class / working-renter tenant base. Strengths: cost of living A+, housing A+, health & safety A+; Watch: schools D+, commute D+, crime F.
- Liberty County (urban): math 19% / reading 28% proficiency, ranked #133 of 174 in GA (top 76%) — low school quality limits family demand, transient renter base, plan for 1-2y turnover.
- Market conditions: Rents rising fast (+5.4%/yr); 612 active listings in the ZIP; 11 comparable units currently listed for rent nearby; rentals lingering (median 44d on market — plan ~5-8 weeks vacancy on turnover, expect pricing pressure); 100% of comp listings sitting > 30 days — soft ceiling on asking rent; 471 units permitted in Liberty County in 2024 (0 in 5+ unit buildings).
- This rent runs 43% of the median local income ($60k/yr) — at the standard rent-burdened threshold; future hikes will face affordability resistance.
Forward outlook
- Local home prices are declining (-3.0%/yr); year-one equity from $1k of loan paydown is wiped out by about $6k of value loss. Plan a longer hold.
- Liberty County population projected to shrink 8% by 2050 — rents likely to lag national; underwrite the cash flow, not the appreciation.
Negotiation context
- It's been on market 19 days — a 2% lower offer ($211k) is reasonable based on typical stale-listing flexibility.
Risks & watch-outs
- Climate carrying-cost: severe wind risk, 99% chance of damaging wind over 30y; extreme-heat days projected 7→18/yr by 2055 (HVAC capex compounding) — expect insurance premiums to compound above CPI over the hold.
Questions for the listing agent
- Built in 1978 — when were the roof, HVAC, electrical panel, plumbing, and water heater last replaced?
- Is there a deadline driving the sale (1031 exchange, divorce, estate, relocation)? That informs how much negotiation room exists.
- Schools are D-rated, which usually means shorter tenancies and higher turnover. Who's the typical renter profile here, and what's been the actual vacancy rate?
- Crime grade is F in this area — have there been break-ins, vandalism, or insurance claims at this property in the last 3 years? What carrier currently insures it and at what premium?
- What's the average days-on-market for RENTAL listings here right now (not sales)? A rising rental-DOM trend means longer vacancies and softer asking-rent achievability than the comps imply.
- What's the recent tenant-quality profile in this submarket — average credit score on applications, eviction rate, late-payment / NSF rate, and stable-employment percentage? A property-management company in the area should have these aggregated.
- How much new for-sale + rental construction is in the pipeline within 1–3 miles? Heavy new supply typically softens prices + rents 12–24 months out; constrained supply supports both.
Investment metrics
- 1% rule
- 1.02% ✓
- Cap rate
- 7.97%
- Cash-on-cash
- 6.00%
- DSCR
- 1.27
- GRM
- 8.2
CMA / ARV
- ARV (on-the-fly)
- $236,538
- Comps found
- 12
Show comp detail 12 sales within ~0.75 mi
| Address | Dist | Beds/Ba | Sqft | Sold | Price | $/sf | Match |
|---|---|---|---|---|---|---|---|
| 306 Floyd St | 0.16mi | 4/2.0 (+1) | 1,572 (+2%) | 3mo | $155,000 | $99 | 83 |
| 454 Floyd Cir | 0.19mi | 3/2.0 | 1,568 (+1%) | 13mo | $285,000 | $182 | 78 |
| 401 Floyd St | 0.18mi | 3/2.0 | 1,582 (+2%) | 14mo | $221,000 | $140 | 76 |
| 638 Ogden Ave | 0.25mi | 3/2.0 | 1,497 (-3%) | 12mo | $257,900 | $172 | 73 |
| 300 Floyd St | 0.13mi | 4/2.5 (+1) | 1,710 (+11%) | 4mo | $230,000 | $135 | 66 |
| 108 W General Stewart Way Way | 0.29mi | 4/2.0 (+1) | 1,653 (+7%) | 6mo | $262,300 | $159 | 64 |
| 616 Olmstead Dr | 0.18mi | 3/2.0 | 1,380 (-11%) | 18mo | $205,000 | $149 | 59 |
| 308 Floyd St | 0.18mi | 3/2.0 | 1,357 (-12%) | 19mo | $227,500 | $168 | 55 |
| 808 Spanish Oak Dr | 0.24mi | 3/2.0 | 1,401 (-9%) | 23mo | $215,000 | $153 | 54 |
| 908 Kings Rd | 0.52mi | 3/2.5 | 1,700 (+10%) | 4mo | $245,000 | $144 | 54 |
| 215 Collins Lane Ln Unit A | 0.65mi | 3/2.0 | 1,414 (-8%) | 6mo | $239,900 | $170 | 50 |
| 215 A Collins Ln | 0.65mi | 3/2.0 | 1,379 (-11%) | 14mo | $105,000 | $76 | 40 |
Match score weights: distance 35% · size 25% · config 20% · recency 20%. Top-matched comps best support the ARV.
Projected returns pro-forma
-3.0% appreciation · 5.41% rent growth · sell at horizon
- IRR
- -4.4%
- Equity multiple
- 0.83×
- Total profit
- $-10,195
- Equity at exit
- $31,908
- IRR
- 7.8%
- Equity multiple
- 1.65×
- Total profit
- $38,987
- Equity at exit
- $18,503
Cash invested: $59,920 (down + closing). Projections, not guarantees.
Landlord ↔ Tenant lean methodology
- Overall (STATE)
- 90 Strongly Landlord-Friendly
- State Georgia
- 90 Strongly Landlord-Friendly · R+3
- County
- — inherits STATE
- City
- — inherits STATE
ZIP-level market 31313
- Home prices YoY
- -27.1%
- Rents YoY
- 5.4%
- Active inventory
- 612
- Price-to-rent
- 8.2×
Monthly cashflow live
- Estimated rent
- $2,177 high interval (Pro) →
- Mortgage (P&I)
- −$1,122
- Tax from tax record
- −$209 /mo · $2,510/yr
- Insurance
- −$89
- HOA
- −$0
- Vacancy / Maint / Mgmt
- −$457
- Net cashflow
- $300
Break-even live
UW: 25.0% down · 7.5% · 30yr · 1.5% tax · 5.0% vac · 8.0% maint · 8.0% mgmt
Financing live
Cash to close
- Down payment
- $53,500
- Closing costs
- $6,420
- Reserves months
- —
- Total cash needed
- —
Loan-product check · same deal, 3 products live
Conventional
25% down · 7.5% · 30yr
- Down + closing
- —
- Monthly P&I
- —
- Monthly cashflow
- —
- DSCR
- —
- Eligible?
- —
Personal DTI + credit; lowest rate.
DSCR
20% down · 8.5% · 30yr
- Down + closing
- —
- Monthly P&I
- —
- Monthly cashflow
- —
- DSCR
- —
- Eligible?
- —
No personal income docs; deal must DSCR.
Hard money
10% down · 12.0% · 12mo
- Down + closing
- —
- Monthly P&I
- —
- Monthly cashflow
- —
- DSCR
- —
- Eligible?
- —
Short-term bridge; refi at stabilization.
Rent comps 11 comps
| Address | Beds | Baths | Sqft | Rent | $/sqft | DOM | Units | Dist |
|---|---|---|---|---|---|---|---|---|
| 619 Olmstead Dr Hinesville, GA | 3.0 | 2.0 | 1745 | $3,000 | $1.72 | 43d | 1 | 0.22mi |
| 231 Honey Lane Cir Hinesville, GA | 3.0 | 1.5 | 1242 | $1,800 | $1.45 | 43d | 1 | 0.54mi |
| 350 Beverly St #124 Hinesville, GA | 3.0 | 2.0 | 1228 | $1,400 | $1.14 | 43d | 1 | 0.83mi |
| 854 Sagewood Dr Hinesville, GA | 2.0 | 2.0 | 1182 | $1,475 | $1.25 | 43d | 1 | 0.93mi |
| 205 Bagley Ave Unit B Hinesville, GA | 3.0 | 2.0 | 1071 | $1,850 | $1.73 | 43d | 1 | 0.96mi |
| 130 Hazy Ln Hinesville, GA | 3.0 | 2.5 | 1518 | $2,100 | $1.38 | 43d | 1 | 1.16mi |
| 822 Lost Grove Ln Hinesville, GA | 3.0 | 2.0 | 1080 | $1,650 | $1.53 | 44d | 1 | 1.25mi |
| 608 Palmetto St Hinesville, GA | 3.0 | 2.0 | 1615 | $1,700 | $1.05 | 43d | 1 | 1.33mi |
| 613 Franklin St Hinesville, GA | 3.0 | 2.0 | 1464 | $1,750 | $1.20 | 43d | 1 | 1.38mi |
| 812 Ridgewood Way Hinesville, GA | 3.0 | 2.0 | 1526 | $1,900 | $1.25 | 43d | 1 | 1.46mi |
| 158 Hamlet Ct Hinesville, GA | 3.0 | 2.5 | 1458 | $2,250 | $1.54 | 43d | 1 | 1.47mi |
Listing history 16 events
-
2026-06-19days on market $214,000 Active 19 DOM
-
2026-06-18days on market $214,000 Active 18 DOM
-
2026-06-17days on market $214,000 Active 17 DOM
-
2026-06-16days on market $214,000 Active 16 DOM
-
2026-06-15pricedays on market $214,000 Active 15 DOM
-
2026-06-14days on market $224,000 Active 13 DOM
-
2026-06-13days on market $224,000 Active 12 DOM
-
2026-06-10days on market $224,000 Active 10 DOM
-
2026-06-09days on market $224,000 Active 9 DOM
-
2026-06-08days on market $224,000 Active 8 DOM
-
2026-06-07days on market $224,000 Active 7 DOM
-
2026-06-05days on market $224,000 Active 4 DOM
-
2026-06-03days on market $224,000 Active 3 DOM
-
2026-06-02days on market $224,000 Active 2 DOM
-
2026-06-01remarks 484-char remark
-
2026-06-01$224,000 Active 1 DOM
ⓘ Source: listings_history table (triggers on properties + properties_extension) + one-shot
backfill from property_details.listing_events for pre-trigger history.
Tax reassessment forecast GA · Resets to sale price
- Current annual tax
- $2,510 · $209/mo
- Projected year-2 tax
- $2,510 · $209/mo
- Expected delta
- $0/yr ($0/mo · 0.0%)
ⓘ Screening estimate from a state-policy table — verify with the county assessor before closing.
Climate risk First Street
- Flood 1/10 Low FEMA zone X (unshaded) · 0% chance over 30 yrs
- Wildfire 3/10 Moderate
- Heat 9/10 Extreme 7 d/yr ≥110°F today · 18 d/yr by 30 yrs out
- Wind 8/10 Severe 99% chance of damaging wind over 30 yrs
- Air quality 2/10 Low 2 unhealthy d/yr today · 2 by 30 yrs out
Nearby sold comps map
Loading sold comps map…
Walkable amenities ~0.75 mi
Loading nearby amenities…
Taxation est. · year 1
- Rental income
- $26,128
- − Mortgage interest
- −$11,987
- − Property taxes
- −$2,510
- − Insurance
- −$1,070
- − Repairs & maintenance
- −$2,090
- − Management
- −$2,090
- − Depreciation
- −$6,225
- Taxable income
- $155
- Est. tax owed @ 24.0%
- −$37
- After-tax cash flow
- $3,557/yr
For passive investors: Depreciation is non-cash, so a rental often shows a tax loss while cash-flowing — sheltering income. Rental losses are passive: they offset passive income freely, and up to $25,000/yr can offset ordinary (W-2) income if you actively participate and your MAGI is under $100k (phasing out to $0 by $150k); unused losses carry forward. On sale, claimed depreciation is recaptured at up to 25%, and gains may owe capital-gains tax (a 1031 exchange can defer both). Figures are a year-1 estimate at your 24.0% rate — not tax advice; consult a CPA.
Schools (NCES district)
- District
- Liberty County
- NCES district ID
- 1303300
- Math proficiency
- 19% ▼ -16.00%
- Reading proficiency
- 28% ▼ -13.00%
- Median HH income
- $43,911
- Composite
- 20.2/100
- National rank
- #8630
- State rank
- #133 of 174 in GA
Livability — Hinesville
- Score
- 73/100
- State rank
- #51
- US rank
- #5200
Category grades
Schools grade is shown separately in the Schools card above.
Census & demographics
- Census place
- Hinesville, GA
- County
- Liberty County · 58,565 people
- City population
- 42,838
- Metro
- Hinesville, GA
- Population (ZIP)
- 42,838
- Household income
- $60,233
- Rent vs Own
- Severe rent burden
- 1693.0
Population outlook (Liberty County) Hauer SSP2
- Today (2025)
- 58,689 people
- By 2030
- 57,670 · -1.7%
- By 2040
- 55,750 · -5.0%
- By 2050
- 54,155 · -7.7%
- By 2075
- 58,947 · +0.4%
- By 2100
- 66,919 · +14.0%
Race, ethnicity, and origin ACS 2023
- Neighborhood character
- Diverse neighborhood (Simpson 0.67)
- Race & ethnicity
- Black 47% White 31% Hispanic / Latino 13% Two or more races 11% Asian 2%
- Hispanic origin (detail)
- Mexican 4% Puerto Rican 7%
- Common ancestry
- Slovak 1% Italian 1% Lithuanian 1%
- Foreign-born
- 7% · Canada, South Korea
- Languages at home
- 86% English-only · Spanish 7% Other Indo-European 2% German/W. Germanic 1%
Political lean MEDSL · Liberty
- 2024 margin
- D (+17.4) · D 58.5% · R 41.0%
- 2008→2024 swing
- -10.9pp toward R · 2008: 28.4pp · 2024: 17.4pp
- All cycles
- 2024: D+17.4 2020: D+24.1 2016: D+21.2 2012: D+30.2 2008: D+28.4
Not yet ingested
- Civics
- —
Market trends
- HPI YoY
- ▼ -77.50%
- Current HPI
- 208.0927
- Rent YoY
- ▲ 5.41%
- Metro
- Hinesville, GA
- State GDP YoY
- ▲ 2.66%
- F500 in state
- 28
Industry mix (Fortune 500 HQ in GA)
| Industry | F500 HQs | Revenue |
|---|---|---|
| Paper / Packaging | 2 | $29B |
|
||
| Retail | 1 | $160B |
|
||
| Transportation / Logistics | 1 | $91B |
|
||
| Airlines | 1 | $62B |
|
||
| Consumer Goods | 1 | $47B |
|
||
| Utilities | 1 | $25B |
|
||
Price history
1 event — show timeline
- 2026-06-01 Listed $224,000 Hive MLS
Property tax history
+7.8%/yrLatest (2025): $2,510 · +3.3% YoY. Source: county tax records.
Cash-flow waterfall
monthlySold comps — $/sqft
last 12 mo · ≤1 miLoading sold comps…