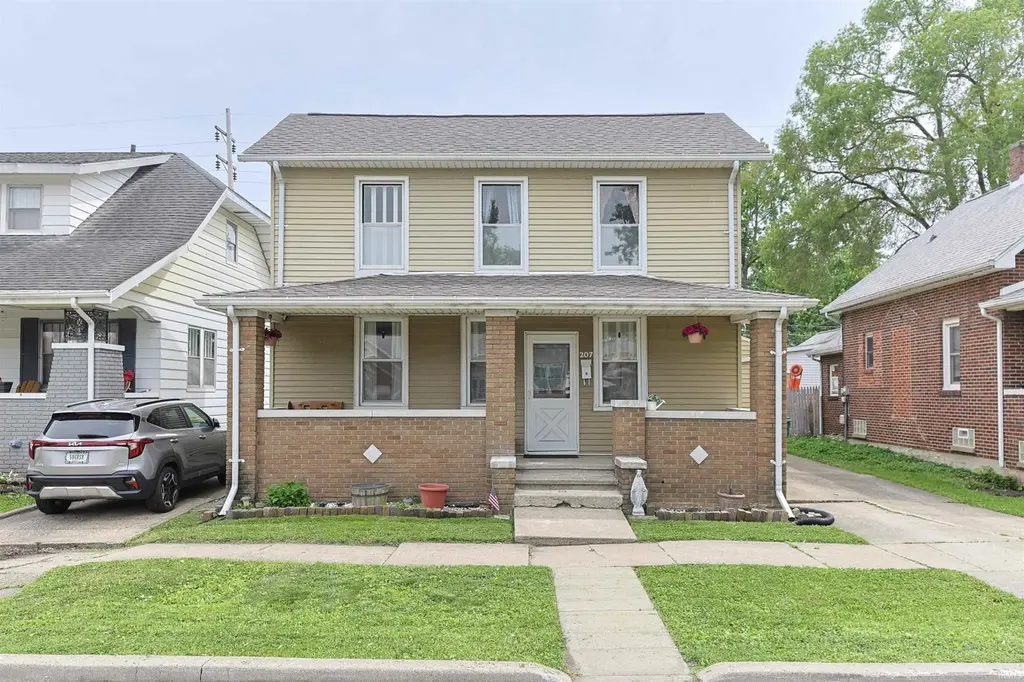
207 W 12th St · Mishawaka, IN
Flood risk 3/10 · Minor
- FEMA flood zone
- X (unshaded)
- Chance of flooding over 30 yrs
- 0.2%
- Est. flood insurance / yr
- $473 – $860
Fire risk 1/10 · Minimal
- Est. fire insurance / yr
- $717 – $1,331
Heat risk 3/10 · Minor
- Hot days now (above 100°F)
- 7 days/yr
- Hot days in 30 yrs
- 16 days/yr
Wind risk 2/10 · Minimal
- Chance of severe wind over 30 yrs
- —
Air-quality risk 3/10 · Minor
- Unhealthy air days now
- 2 days/yr
- Unhealthy air days in 30 yrs
- 3 days/yr
Risk factors via First Street. Map © Google.
Why this score? — see what drove the C grade
The composite is a weighted blend of 9 inputs, each scored 0–100. Each bar is that input's sub-score; the figure is the points it added to the 100-point composite (weight × sub-score).
- Cash flow +18.5/30.0
- ARV discount +14.3/15.0
- DSCR +5.8/10.0
- Rent growth +4.8/5.0
- 1% rule +4.4/10.0
- Livability +3.8/5.0
- Condition / age +2.5/5.0
- Schools +2.2/10.0
- Appreciation +0.0/10.0
$165,000
🖨 Deal sheet 📄 Offer letter ✓ Due diligence
Listing remarks MLS
What a charmer!! Loads of character in this four bedroom home. Original hardwood floors in most of house along with interior wood shutters throughout. Vintage sink in utility room off kitchen. Updated dining and kitchen with new cooktop, tub surround and electrical box within past two years. All appliances included along with washer and dryer and fridge in basement. Close to downtown Mishawaka and the river walk. Set up your private showing today!
Key facts
- Large living area
- Porch space
- Natural light
Tags
Property features AI
Finance
- Other: Lot dimensions approximately 40 x 113 (about 0.1 acre)
Exterior
- Parking: Detached concrete garage with space for 1 car
- Utilities: Public water; Public sewer
- Home design: Single-family, site-built home; Two stories
- Construction: Brick and vinyl siding exterior; Block foundation; Built as a site-built home
- Exterior features: Front porch; Level lot
Interior
- Kitchen: Electric cooktop; Electric oven; Refrigerator; Electric water heater
- Flooring: Hardwood flooring; Vinyl flooring
- Bathrooms: One full bathroom; One half bathroom; One main-level bathroom
- Heating & cooling: Forced air heating (natural gas); Central air conditioning
- Interior features: Breakfast bar; Window treatments and shutters; One fireplace (no additional fireplace features listed); Partial, unfinished basement
- Laundry & utility: Washer and dryer included; Laundry located on lower level; Owned water softener
Neighborhood map
What this means for you Summary
Snapshot
- This is a 3-bed/1.5-bath single-family listed at $165k.
Deal economics
- At list price, monthly cash flow is $158 ($2k/yr) — positive.
- The deal already cash-flows at list — no discount required.
- To meet the 1% rule (rent ≥ 1% of price), the offer needs to be $156k (5.6% below list).
- Recommended offer: $156k (5.6% below list) — sets the bar for 1% rule.
- Cap rate 7.4% vs local median 5.3% in Mishawaka — top-decile yield for the area; either an underpriced asset or a hidden risk that comps aren't pricing in. Stress-test before assuming the spread holds.
Location & tenants
- Location reads 76/100 on livability (#53 in IN, #3,586 nationally) — a middle-class / working-renter tenant base. Strengths: cost of living A+, housing A+, health & safety B; Watch: amenities F, employment F.
- School City Of Mishawaka (urban): math 23% / reading 30% proficiency, ranked #260 of 301 in IN (top 86%) — low school quality limits family demand, transient renter base, plan for 1-2y turnover.
- Zoned schools: Emmons Elementary School (math 14% / reading 14%, grade F, #874 of 994 statewide, top 89%, 435 students, 87% FRL); John J Young Middle School (math 17% / reading 30%, grade F, #257 of 330 statewide, top 79%, 735 students, 74% FRL); Mishawaka High School (math 24% / reading 60%, grade F, #197 of 369 statewide, top 57%, 1,488 students, 65% FRL) — zoned schools average 75% FRL vs 54% district-wide (21 pts higher); higher-poverty schools than district average — tighter screening recommended.
- Market conditions: Rents rising fast (+9.1%/yr); 140 active listings in the ZIP; 7 comparable units currently listed for rent nearby; rentals at typical pace (median 21d on market — plan ~3-4 weeks tenant-placement turnaround); 754 units permitted in St. Joseph County in 2024 (460 in 5+ unit buildings).
- This rent runs 32% of the median local income ($59k/yr) — at the standard rent-burdened threshold; future hikes will face affordability resistance.
Forward outlook
- Local home prices are declining (-3.0%/yr); year-one equity from $1k of loan paydown is wiped out by about $5k of value loss. Plan a longer hold.
- At projected returns (-3.0% appreciation + 8.0% rent growth), your $46k cash investment doubles in ~10 years — after that, you're playing with house money.
Negotiation context
- Only 7 days on market — expect competitive offers; lowballing is unlikely to land.
- 3 sale attempts since 9y ago with the ask held roughly flat each time — persistent listings suggest the price (not the market) is what's stuck; bring a comps-based counter.
- Current owner paid $115k; 43% above their basis — modest negotiation headroom, anchor on the comps not their cost.
Risks & watch-outs
- Watch-outs: built in 1900 — expect roof / HVAC / electrical / plumbing capex.
Questions for the listing agent
- Built in 1900 — when were the roof, HVAC, electrical panel, plumbing, and water heater last replaced?
- Is there a deadline driving the sale (1031 exchange, divorce, estate, relocation)? That informs how much negotiation room exists.
- What's the average days-on-market for RENTAL listings here right now (not sales)? A rising rental-DOM trend means longer vacancies and softer asking-rent achievability than the comps imply.
- What's the recent tenant-quality profile in this submarket — average credit score on applications, eviction rate, late-payment / NSF rate, and stable-employment percentage? A property-management company in the area should have these aggregated.
- How much new for-sale + rental construction is in the pipeline within 1–3 miles? Heavy new supply typically softens prices + rents 12–24 months out; constrained supply supports both.
Investment metrics
- 1% rule
- 0.94% ✗
- Cap rate
- 7.44%
- Cash-on-cash
- 4.10%
- DSCR
- 1.18
- GRM
- 8.8
CMA / ARV
- ARV (on-the-fly)
- $194,416
- Comps found
- 12
Show comp detail 12 sales within ~0.75 mi
| Address | Dist | Beds/Ba | Sqft | Sold | Price | $/sf | Match |
|---|---|---|---|---|---|---|---|
| 1014 S Main St | 0.12mi | 3/1.0 | 1,599 (-5%) | 6mo | $180,000 | $113 | 79 |
| 130 E 16th St | 0.28mi | 3/1.0 | 1,665 (-1%) | 8mo | $174,000 | $105 | 77 |
| 304 E 8th St | 0.35mi | 4/1.0 (+1) | 1,672 (-0%) | 3mo | $181,000 | $108 | 74 |
| 424 W 9th St | 0.26mi | 4/2.0 (+1) | 1,733 (+3%) | 3mo | $225,000 | $130 | 73 |
| 403 W 7th St | 0.32mi | 4/2.0 (+1) | 1,668 (-0%) | 7mo | $175,000 | $105 | 72 |
| 519 W 10th St | 0.26mi | 2/2.0 (-1) | 1,562 (-7%) | 4mo | $182,500 | $117 | 66 |
| 131 E 6th St | 0.39mi | 3/2.0 | 1,460 (-13%) | 1mo | $217,500 | $149 | 57 |
| 804 W 15th St | 0.44mi | 3/2.0 | 1,844 (+10%) | 6mo | $297,000 | $161 | 55 |
| 615 E 15th St | 0.56mi | 3/1.0 | 1,506 (-10%) | 5mo | $175,000 | $116 | 51 |
| 905 Taylor St | 0.42mi | 3/2.5 | 1,920 (+15%) | 2mo | $262,500 | $137 | 50 |
| 911 S Laurel St | 0.57mi | 3/1.0 | 1,488 (-11%) | 7mo | $135,000 | $91 | 47 |
| 701 W 3 St | 0.67mi | 3/2.0 | 1,870 (+12%) | 4mo | $185,000 | $99 | 44 |
Match score weights: distance 35% · size 25% · config 20% · recency 20%. Top-matched comps best support the ARV.
Projected returns pro-forma
-3.0% appreciation · 8.0% rent growth · sell at horizon
- IRR
- -4.7%
- Equity multiple
- 0.82×
- Total profit
- $-8,473
- Equity at exit
- $24,602
- IRR
- 9.9%
- Equity multiple
- 1.93×
- Total profit
- $42,940
- Equity at exit
- $14,266
Cash invested: $46,200 (down + closing). Projections, not guarantees.
Landlord ↔ Tenant lean methodology
- Overall (STATE)
- 90 Strongly Landlord-Friendly
- State Indiana
- 90 Strongly Landlord-Friendly · R+11
- County
- — inherits STATE
- City
- — inherits STATE
ZIP-level market 46544
- Rents YoY
- 9.1%
- Active inventory
- 140
- Price-to-rent
- 8.8×
Monthly cashflow live
- Estimated rent
- $1,557 medium interval (Pro) →
- Mortgage (P&I)
- −$865
- Tax from tax record
- −$138 /mo · $1,656/yr
- Insurance
- −$69
- HOA
- −$0
- Vacancy / Maint / Mgmt
- −$327
- Net cashflow
- $158
Break-even live
UW: 25.0% down · 7.5% · 30yr · 1.5% tax · 5.0% vac · 8.0% maint · 8.0% mgmt
Financing live
Cash to close
- Down payment
- $41,250
- Closing costs
- $4,950
- Reserves months
- —
- Total cash needed
- —
Loan-product check · same deal, 3 products live
Conventional
25% down · 7.5% · 30yr
- Down + closing
- —
- Monthly P&I
- —
- Monthly cashflow
- —
- DSCR
- —
- Eligible?
- —
Personal DTI + credit; lowest rate.
DSCR
20% down · 8.5% · 30yr
- Down + closing
- —
- Monthly P&I
- —
- Monthly cashflow
- —
- DSCR
- —
- Eligible?
- —
No personal income docs; deal must DSCR.
Hard money
10% down · 12.0% · 12mo
- Down + closing
- —
- Monthly P&I
- —
- Monthly cashflow
- —
- DSCR
- —
- Eligible?
- —
Short-term bridge; refi at stabilization.
Rent comps 7 comps
| Address | Beds | Baths | Sqft | Rent | $/sqft | DOM | Units | Dist |
|---|---|---|---|---|---|---|---|---|
| 642 E 11th St Mishawaka, IN | 3.0 | 1.0 | 1248 | $1,295 | $1.04 | 20d | 1 | 0.58mi |
| 507 Lincolnway E Unit 507 Mishawaka, IN | 2.0 | 1.0 | 1961 | $950 | $0.48 | 20d | 1 | 0.75mi |
| 365 W Front St Mishawaka, IN | 2.0 | 1.0–2.0 | 825 | $3,050 | $3.70 | 13d | 1 | 0.75mi |
| 211 Columbia St Mishawaka, IN | 4.0 | 2.5 | 1500 | $1,795 | $1.20 | 20d | 1 | 0.82mi |
| 116 W Mishawaka Ave Mishawaka, IN | 3.0 | 1.0–2.0 | 948 | $2,321 | $2.45 | 13d | 31 | 1.01mi |
| 232 E Grove St Mishawaka, IN | 3.0 | 1.0 | 1188 | $1,500 | $1.26 | 13d | 1 | 1.08mi |
| 931 S 34th St South Bend, IN | 3.0 | 1.5 | 1656 | $1,550 | $0.94 | 43d | 1 | 1.26mi |
Listing history 10 events
-
2026-06-07statusdays on market $165,000 Pending 7 DOM
-
2026-06-02days on market $165,000 Active Under Contract 5 DOM
-
2026-06-01days on market $165,000 Active Under Contract 4 DOM
-
2026-05-31days on market $165,000 Active Under Contract 3 DOM
-
2026-05-30statusdays on market $165,000 Active Under Contract 2 DOM
-
2026-05-28$165,000 Active
-
2021-08-18soldstatus $115,000 452-char remark
Show marketing remark (452 chars)
What a charmer!! Loads of character in this four bedroom home. Original hardwood floors in most of house along with interior wood shutters throughout. Vintage sink in utility room off kitchen. Updated dining and kitchen with new cooktop, tub surround and electrical box within past two years. All appliances included along with washer and dryer and fridge in basement. Close to downtown Mishawaka and the river walk. Set up your private showing today!
-
2021-04-30$130,000 452-char remark
Show marketing remark (452 chars)
What a charmer!! Loads of character in this four bedroom home. Original hardwood floors in most of house along with interior wood shutters throughout. Vintage sink in utility room off kitchen. Updated dining and kitchen with new cooktop, tub surround and electrical box within past two years. All appliances included along with washer and dryer and fridge in basement. Close to downtown Mishawaka and the river walk. Set up your private showing today!
-
2017-12-06soldstatus $74,000 842-char remark
Show marketing remark (842 chars)
Mishawaka Craftsman w/ a Bricked wrapped front porch located only 1/2 mile from Rose Park. This little charmer is quite a surprise with the possibility of 5 bedrooms to support a growing family (5th bed rm w/ wardrobe closet). There is 1.5 baths, hardwood flooring, 10' living room ceiling, open concept through the dining-kitchen. The spacious kitchen provides great hardwood cabinetry, a large breakfast bar-workspace featuring a cooktop stove and built-in oven. The mudroom just off the kitchen, has the 1930s farmhouse porcelain wall sink, a pantry cabinet and a Glass Sliding French door to the basement. The basement provides lots of storage including a staircase to the cottage garden backyard that blooms with perennials. This oversize 1car garage is 2cars deep, providing space for 2 cars or a great workshop. Don't delay call today!
-
2017-06-04$89,000 842-char remark
Show marketing remark (842 chars)
Mishawaka Craftsman w/ a Bricked wrapped front porch located only 1/2 mile from Rose Park. This little charmer is quite a surprise with the possibility of 5 bedrooms to support a growing family (5th bed rm w/ wardrobe closet). There is 1.5 baths, hardwood flooring, 10' living room ceiling, open concept through the dining-kitchen. The spacious kitchen provides great hardwood cabinetry, a large breakfast bar-workspace featuring a cooktop stove and built-in oven. The mudroom just off the kitchen, has the 1930s farmhouse porcelain wall sink, a pantry cabinet and a Glass Sliding French door to the basement. The basement provides lots of storage including a staircase to the cottage garden backyard that blooms with perennials. This oversize 1car garage is 2cars deep, providing space for 2 cars or a great workshop. Don't delay call today!
ⓘ Source: listings_history table (triggers on properties + properties_extension) + one-shot
backfill from property_details.listing_events for pre-trigger history.
Tax reassessment forecast IN · Partial reset (capped growth)
- Current annual tax
- $1,656 · $138/mo
- Projected year-2 tax
- $1,656 · $138/mo
- Expected delta
- $0/yr ($0/mo · 0.0%)
ⓘ Screening estimate from a state-policy table — verify with the county assessor before closing.
Climate risk First Street
- Flood 3/10 Moderate FEMA zone X (unshaded) · 20% chance over 30 yrs
- Wildfire 1/10 Low
- Heat 3/10 Moderate 7 d/yr ≥100°F today · 16 d/yr by 30 yrs out
- Wind 2/10 Low
- Air quality 3/10 Moderate 2 unhealthy d/yr today · 3 by 30 yrs out
Nearby sold comps map
Loading sold comps map…
Walkable amenities ~0.75 mi
Loading nearby amenities…
Taxation est. · year 1
- Rental income
- $18,682
- − Mortgage interest
- −$9,243
- − Property taxes
- −$1,656
- − Insurance
- −$825
- − Repairs & maintenance
- −$1,495
- − Management
- −$1,495
- − Depreciation
- −$4,800
- Taxable loss
- −$831
- Est. tax savings @ 24.0%
- +$199
- After-tax cash flow
- $2,094/yr
For passive investors: Depreciation is non-cash, so a rental often shows a tax loss while cash-flowing — sheltering income. Rental losses are passive: they offset passive income freely, and up to $25,000/yr can offset ordinary (W-2) income if you actively participate and your MAGI is under $100k (phasing out to $0 by $150k); unused losses carry forward. On sale, claimed depreciation is recaptured at up to 25%, and gains may owe capital-gains tax (a 1031 exchange can defer both). Figures are a year-1 estimate at your 24.0% rate — not tax advice; consult a CPA.
Schools (NCES district)
- District
- School City Of Mishawaka
- NCES district ID
- 1806840
- Math proficiency
- 23% ▼ -9.00%
- Reading proficiency
- 30% ▼ -7.00%
- Median HH income
- $39,290
- Composite
- 22.26/100
- National rank
- #8143
- State rank
- #260 of 301 in IN
Livability — Mishawaka
- Score
- 76/100
- State rank
- #53
- US rank
- #3586
Category grades
Schools grade is shown separately in the Schools card above.
Census & demographics
- Census place
- Mishawaka, IN
- County
- Saint Joseph County · 189,048 people
- City population
- 57,683
- Metro
- South Bend-Mishawaka, IN-MI
- Population (ZIP)
- 31,077
- Household income
- $58,829
- Rent vs Own
- Severe rent burden
- 685.0
Population outlook (St. Joseph County) Hauer SSP2
- Today (2025)
- 273,186 people
- By 2030
- 273,594 · +0.1%
- By 2040
- 271,641 · -0.6%
- By 2050
- 269,187 · -1.5%
- By 2075
- 263,136 · -3.7%
- By 2100
- 245,659 · -10.1%
Race, ethnicity, and origin ACS 2023
- Neighborhood character
- Predominantly White (79%)
- Race & ethnicity
- White 79% Black 9% Two or more races 7% Hispanic / Latino 6% Asian 1%
- Hispanic origin (detail)
- Mexican 5%
- Common ancestry
- Romanian 7% English 3% Lithuanian 2%
- Foreign-born
- 4% · Canada, Vietnam
- Languages at home
- 94% English-only · Spanish 3%
Political lean MEDSL · St. Joseph
- 2024 margin
- Toss-up / Even · D 50.0% · R 48.5% · Other 1.5%
- 2008→2024 swing
- -15.6pp toward R · 2008: 17.1pp · 2024: 1.5pp
- All cycles
- 2024: D+1.5 2020: D+5.8 2016: D+0.2 2012: D+3.5 2008: D+17.1
Not yet ingested
- Civics
- —
Market trends
- HPI YoY
- ▼ -116.74%
- Current HPI
- 188.9996
- Rent YoY
- ▲ 9.10%
- Metro
- South Bend-Mishawaka, IN-MI
- State GDP YoY
- ▲ 2.90%
- F500 in state
- 18
Industry mix (Fortune 500 HQ in IN)
| Industry | F500 HQs | Revenue |
|---|---|---|
| Industrial Machinery | 2 | $37B |
|
||
| Healthcare | 1 | $177B |
|
||
| Pharmaceuticals | 1 | $45B |
|
||
| Metals / Steel | 1 | $18B |
|
||
| Agriculture | 1 | $17B |
|
||
| Packaging | 1 | $12B |
|
||
Price history
+85.4% since first listed5 events — show timeline
- 2026-05-28 Listed $165,000 IRMLS
- 2021-08-18 Sold (MLS) $115,000 IRMLS
- 2021-04-30 Listed $130,000 IRMLS
- 2017-12-06 Sold (MLS) $74,000 IRMLS
- 2017-06-04 Listed $89,000 IRMLS
Property tax history
+3.5%/yrLatest (2024): $1,656 · +18.6% YoY. Source: county tax records.
Cash-flow waterfall
monthlySold comps — $/sqft
last 12 mo · ≤1 miLoading sold comps…