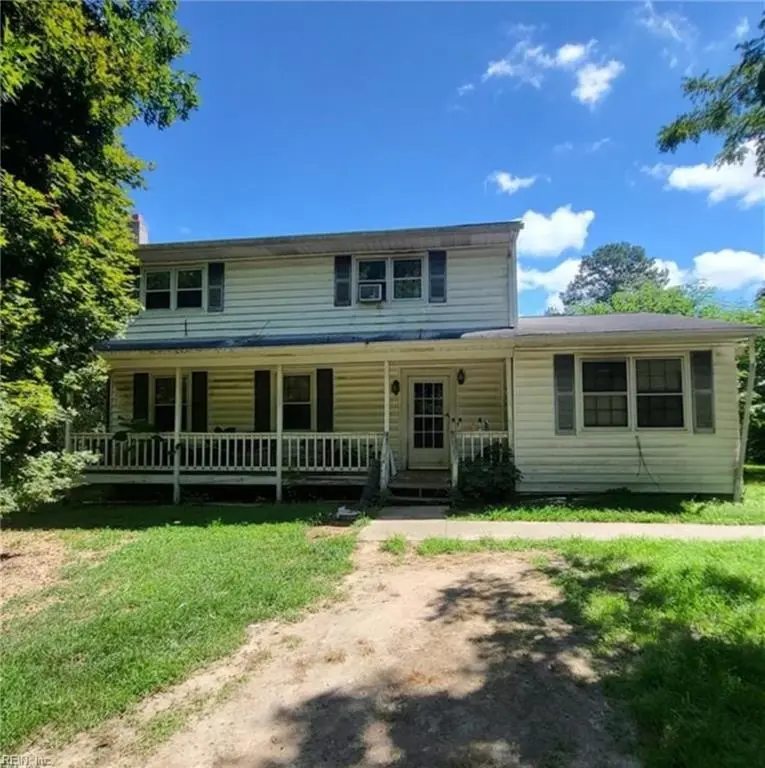
4523 Stormont Rd · Saluda, VA
Flood risk 1/10 · Minimal
- FEMA flood zone
- X (unshaded)
- Chance of flooding over 30 yrs
- 0.0%
- Est. flood insurance / yr
- $507 – $1,088
Fire risk 4/10 · Minor
- Est. fire insurance / yr
- $666 – $1,236
Heat risk 9/10 · Severe
- Hot days now (above 105°F)
- 7 days/yr
- Hot days in 30 yrs
- 17 days/yr
Wind risk 8/10 · Major
- Chance of severe wind over 30 yrs
- 80.0%
Air-quality risk 1/10 · Minimal
- Unhealthy air days now
- 0 days/yr
- Unhealthy air days in 30 yrs
- 0 days/yr
Risk factors via First Street. Map © Google.
Why this score? — see what drove the D- grade
The composite is a weighted blend of 9 inputs, each scored 0–100. Each bar is that input's sub-score; the figure is the points it added to the 100-point composite (weight × sub-score).
- Cash flow +8.0/30.0
- ARV discount +7.5/15.0
- Schools +4.5/10.0
- Appreciation +4.4/10.0
- Rent growth +2.5/5.0
- Condition / age +2.5/5.0
- Livability +2.4/5.0
- DSCR +2.0/10.0
- 1% rule +1.6/10.0
$250,000
🖨 Deal sheet (PDF) 📄 Offer letter ✓ Due diligence
Listing remarks MLS
Grand Location on 8.5 Acres zoned for farming. This is a Buyers' or Builders' Dream. Welcome to this charming area with opportunity to rebuild. This lot offers ample space for expansion or a creative builder's touch. Just 10 minutes from the Piankatank River Golf Course, this home offers easy access to recreation and leisure. - **Horse-Friendly:** Previously zoned for horses, this property is great for equestrian enthusiasts. Selling as is. The house on the lot needs complete restoration. Buyers have the potential to divide area into 3 properties at 2.5 acres with a right of way passage. (Please contact Middlesex County for more information.) Schedule your showing appointment today.
Key facts
- 8.5 acres
- Zoned for farming
- Horse-friendly
Tags
Neighborhood map
What this means for you Summary
Snapshot
- This is a 4-bed/2.5-bath single-family listed at $250k.
Deal economics
- At list price, monthly cash flow is $-257 ($-3k/yr) — negative.
- To cash-flow at today's rent, offer at most $205k (18.2% below list).
- To meet the 1% rule (rent ≥ 1% of price), the offer needs to be $165k (34.2% below list).
- Recommended offer: $165k (34.2% below list) — sets the bar for 1% rule.
- Cap rate 5.1% vs local median 3.0% in Saluda — top-decile yield for the area; either an underpriced asset or a hidden risk that comps aren't pricing in. Stress-test before assuming the spread holds.
Location & tenants
- Location reads 47/100 on livability (#557 in VA) — a working-class tenant base; expect higher turnover. Strengths: crime A, cost of living A; Watch: amenities F, commute F, employment F.
- Middlesex County Public School District (rural): math 45% / reading 59% proficiency, ranked #90 of 131 in VA (top 69%) — acceptable for families but not a draw, mixed tenant base, ~2y average lease.
- Zoned schools: Middlesex Elementary (math 40% / reading 53%, grade D-, #817 of 1,108 statewide, top 74%, 611 students, 97% FRL); St. Clare Walker Middle (math 33% / reading 57%, grade D, #274 of 342 statewide, top 81%, 287 students, 87% FRL); Middlesex High (math 92% / reading 82%, grade A, #16 of 319 statewide, top 5%, 346 students, 99% FRL) — zoned schools average 94% FRL vs 44% district-wide (51 pts higher); higher-poverty schools than district average — tighter screening recommended.
- Market conditions: 57 active listings in the ZIP; 97 units permitted in Middlesex County in 2024 (0 in 5+ unit buildings).
Forward outlook
- Local home prices are declining (-1.2%/yr); year-one equity from $2k of loan paydown is wiped out by about $3k of value loss. Plan a longer hold.
- Middlesex County population projected at -21% by 2050 — secular population decline; favor cash flow + early exit over multi-decade hold.
Negotiation context
- It's been on market 109 days — a 9% lower offer ($228k) is reasonable based on typical stale-listing flexibility.
- 4 sale attempts since 2y ago with the ask held roughly flat each time — persistent listings suggest the price (not the market) is what's stuck; bring a comps-based counter.
Risks & watch-outs
- Climate carrying-cost: severe wind risk, 80% chance of damaging wind over 30y; extreme-heat days projected 7→17/yr by 2055 (HVAC capex compounding) — expect insurance premiums to compound above CPI over the hold.
Questions for the listing agent
- What do current leases actually rent for vs. the listed asking? Can we see a recent rent roll and the last 12 months of T-12 income?
- It's been on market 109 days. Have you received any prior offers? Is the seller open to a 34% concession, seller financing, or rate buy-down credit?
- Built in 1970 — when were the roof, HVAC, electrical panel, plumbing, and water heater last replaced?
- Why hasn't it sold? Are there any deal-killer items the seller is aware of (foundation, flood, title, zoning, code violations)?
- Is there a deadline driving the sale (1031 exchange, divorce, estate, relocation)? That informs how much negotiation room exists.
- Schools are B-rated — typically a magnet for longer-tenancy family renters. What's the average tenant stay here, and is there a school-zone premium baked into asking?
- The area grade is low — what's the realistic commute time and amenity access for the typical tenant pool here? Any planned neighborhood developments (good or bad) we should know about?
- What's the average days-on-market for RENTAL listings here right now (not sales)? A rising rental-DOM trend means longer vacancies and softer asking-rent achievability than the comps imply.
- What's the recent tenant-quality profile in this submarket — average credit score on applications, eviction rate, late-payment / NSF rate, and stable-employment percentage? A property-management company in the area should have these aggregated.
- How much new for-sale + rental construction is in the pipeline within 1–3 miles? Heavy new supply typically softens prices + rents 12–24 months out; constrained supply supports both.
Investment metrics
- 1% rule
- 0.66% ✗
- Cap rate
- 5.06%
- Cash-on-cash
- -4.40%
- DSCR
- 0.80
- GRM
- 12.7
CMA / ARV
- ARV (median comp)
- $688,416
- List price
- $250,000
- Delta
- -63.68%
- Verdict
- UNDERPRICED
- Comps
- 3 within 1.0 mi
Projected returns pro-forma
-1.22% appreciation · 3.0% rent growth · sell at horizon
- IRR
- -12.8%
- Equity multiple
- 0.46×
- Total profit
- $-37,786
- Equity at exit
- $57,669
- IRR
- -6.0%
- Equity multiple
- 0.48×
- Total profit
- $-36,507
- Equity at exit
- $58,304
Cash invested: $70,000 (down + closing). Projections, not guarantees.
Landlord ↔ Tenant lean methodology
- Overall (STATE)
- 55 Moderately Landlord-Leaning
- State Virginia
- 55 Moderately Landlord-Leaning · D+2
- County
- — inherits STATE
- City
- — inherits STATE
ZIP-level market 23071
- Home prices YoY
- -0.4%
- Active inventory
- 57
- Price-to-rent
- 12.7×
Monthly cashflow live
- Estimated rent
- $1,645 medium interval (Pro) →
- Mortgage (P&I)
- −$1,311
- Tax from tax record
- −$142 /mo · $1,700/yr
- Insurance
- −$104
- HOA
- −$0
- Vacancy / Maint / Mgmt
- −$346
- Net cashflow
- $-257
Break-even live
Sensitivity live
| Price | -10% $-115 | -5% $-186 | +0% $-257 | +5% $-328 | +10% $-398 |
|---|---|---|---|---|---|
| Rent | -10% $-387 | -5% $-322 | +0% $-257 | +5% $-192 | +10% $-127 |
| Rate | -1.0pp $-131 | -0.5pp $-193 | base $-257 | +0.5pp $-322 | +1.0pp $-388 |
UW: 25.0% down · 7.5% · 30yr · 1.5% tax · 5.0% vac · 8.0% maint · 8.0% mgmt
Financing live
Cash to close
- Down payment
- $62,500
- Closing costs
- $7,500
- Reserves months
- —
- Total cash needed
- —
Loan-product check · same deal, 3 products live
Conventional
25% down · 7.5% · 30yr
- Down + closing
- —
- Monthly P&I
- —
- Monthly cashflow
- —
- DSCR
- —
- Eligible?
- —
Personal DTI + credit; lowest rate.
DSCR
20% down · 8.5% · 30yr
- Down + closing
- —
- Monthly P&I
- —
- Monthly cashflow
- —
- DSCR
- —
- Eligible?
- —
No personal income docs; deal must DSCR.
Hard money
10% down · 12.0% · 12mo
- Down + closing
- —
- Monthly P&I
- —
- Monthly cashflow
- —
- DSCR
- —
- Eligible?
- —
Short-term bridge; refi at stabilization.
Listing history 37 events
-
2026-06-21days on market $250,000 Active 109 DOM
-
2026-06-21days on market $250,000 Active 108 DOM
-
2026-06-18days on market $250,000 Active 106 DOM
-
2026-06-17days on market $250,000 Active 105 DOM
-
2026-06-16days on market $250,000 Active 104 DOM
-
2026-06-15days on market $250,000 Active 103 DOM
-
2026-06-15days on market $250,000 Active 102 DOM
-
2026-06-13days on market $250,000 Active 101 DOM
-
2026-06-12days on market $250,000 Active 100 DOM
-
2026-06-09days on market $250,000 Active 97 DOM
-
2026-06-08days on market $250,000 Active 96 DOM
-
2026-06-08days on market $250,000 Active 95 DOM
-
2026-06-07days on market $250,000 Active 94 DOM
-
2026-06-03days on market $250,000 Active 91 DOM
-
2026-06-02days on market $250,000 Active 90 DOM
-
2026-06-01days on market $250,000 Active 89 DOM
-
2026-05-31days on market $250,000 Active 88 DOM
-
2026-03-04$250,000 Active 692-char remark
Show marketing remark (692 chars)
Grand Location on 8.5 Acres zoned for farming. This is a Buyers' or Builders' Dream. Welcome to this charming area with opportunity to rebuild. This lot offers ample space for expansion or a creative builder's touch. Just 10 minutes from the Piankatank River Golf Course, this home offers easy access to recreation and leisure. - **Horse-Friendly:** Previously zoned for horses, this property is great for equestrian enthusiasts. Selling as is. The house on the lot needs complete restoration. Buyers have the potential to divide area into 3 properties at 2.5 acres with a right of way passage. (Please contact Middlesex County for more information.) Schedule your showing appointment today.
-
2026-02-28historical
-
2026-02-06price $250,000
-
2025-08-11price $349,500
-
2025-07-14price $349,800
-
2025-05-29price $349,900
-
2025-04-11price $350,000
-
2025-03-12$370,000 Active
-
2025-03-12historical
-
2024-11-09price $370,000
-
2024-10-29price $375,000
-
2024-10-23price $380,000
-
2024-10-07price $385,000
-
2024-09-27$395,000 Active
-
2024-09-26historical
-
2024-09-04price $395,000
-
2024-08-13price $465,000
-
2024-08-02price $485,000
-
2024-07-20price $490,000
-
2024-07-12$500,000 Active
ⓘ Source: listings_history table (triggers on properties + properties_extension) + one-shot
backfill from property_details.listing_events for pre-trigger history.
Tax reassessment forecast VA · Resets to sale price
- Current annual tax
- $1,700 · $142/mo
- Projected year-2 tax
- $2,050 · $171/mo
- Expected delta
- +$350/yr (+$29/mo · 20.6%)
ⓘ Screening estimate from a state-policy table — verify with the county assessor before closing.
Climate risk First Street
- Flood 1/10 Low FEMA zone X (unshaded) · 0% chance over 30 yrs
- Wildfire 4/10 Moderate
- Heat 9/10 Extreme 7 d/yr ≥105°F today · 17 d/yr by 30 yrs out
- Wind 8/10 Severe 80% chance of damaging wind over 30 yrs
- Air quality 1/10 Low 0 unhealthy d/yr today · 0 by 30 yrs out
Nearby sold comps map
Loading sold comps map…
Walkable amenities ~0.75 mi
Loading nearby amenities…
Taxation est. · year 1
- Rental income
- $19,746
- − Mortgage interest
- −$14,004
- − Property taxes
- −$1,700
- − Insurance
- −$1,250
- − Repairs & maintenance
- −$1,580
- − Management
- −$1,580
- − Depreciation
- −$7,273
- Taxable loss
- −$7,640
- Est. tax savings @ 24.0%
- +$1,834
- After-tax cash flow
- $-1,250/yr
For passive investors: Depreciation is non-cash, so a rental often shows a tax loss while cash-flowing — sheltering income. Rental losses are passive: they offset passive income freely, and up to $25,000/yr can offset ordinary (W-2) income if you actively participate and your MAGI is under $100k (phasing out to $0 by $150k); unused losses carry forward. On sale, claimed depreciation is recaptured at up to 25%, and gains may owe capital-gains tax (a 1031 exchange can defer both). Figures are a year-1 estimate at your 24.0% rate — not tax advice; consult a CPA.
Schools (NCES district)
- District
- Middlesex County Public School District
- NCES district ID
- 5102490
- Math proficiency
- 45% ▼ -35.00%
- Reading proficiency
- 59% ▼ -11.00%
- Median HH income
- $51,986
- Composite
- 44.58/100
- National rank
- #2783
- State rank
- #90 of 131 in VA
Livability — Saluda
- Score
- 47/100
- State rank
- #557
- US rank
- #26208
Category grades
Schools grade is shown separately in the Schools card above.
Census & demographics
- Population (ZIP)
- 1,970
Population outlook (Middlesex County) Hauer SSP2
- Today (2025)
- 9,829 people
- By 2030
- 9,340 · -5.0%
- By 2040
- 8,411 · -14.4%
- By 2050
- 7,795 · -20.7%
- By 2075
- 7,471 · -24.0%
- By 2100
- 7,049 · -28.3%
Race, ethnicity, and origin ACS 2023
- Neighborhood character
- Predominantly White (92%)
- Race & ethnicity
- White 92% Hispanic / Latino 6% Two or more races 1%
- Hispanic origin (detail)
- Puerto Rican 6%
- Common ancestry
- Serbian 3% Slovak 1% Romanian 1%
- Foreign-born
- 1%
- Languages at home
- 97% English-only · Spanish 2%
Political lean MEDSL · Middlesex
- 2024 margin
- Strong R (+27.4) · D 35.9% · R 63.3%
- 2008→2024 swing
- -8.2pp toward R · 2008: -19.2pp · 2024: -27.4pp
- All cycles
- 2024: R+27.4 2020: R+25.1 2016: R+26.0 2012: R+20.6 2008: R+19.2
Not yet ingested
- Civics
- —
Market trends
- HPI YoY
- ▼ -1.22%
- Current HPI
- 317.9851
- Rent YoY
- —
- Metro
- —
- State GDP YoY
- ▲ 2.40%
- F500 in state
- 50
Industry mix (Fortune 500 HQ in VA)
| Industry | F500 HQs | Revenue |
|---|---|---|
| Aerospace / Defense | 4 | $236B |
|
||
| Technology / Defense | 3 | $32B |
|
||
| Financial Services | 2 | $176B |
|
||
| Utilities | 2 | $27B |
|
||
| Insurance | 2 | $25B |
|
||
| Technology | 2 | $15B |
|
||
Price history
-50.0% since first listed20 events — show timeline
- 2026-03-04 Listed $250,000 REINMLS
- 2026-02-28 Listing Removed — REINMLS
- 2026-02-06 Price Changed $250,000 REINMLS
- 2025-08-11 Price Changed $349,500 REINMLS
- 2025-07-14 Price Changed $349,800 REINMLS
- 2025-05-29 Price Changed $349,900 REINMLS
- 2025-04-11 Price Changed $350,000 REINMLS
- 2025-03-12 Listing Removed — REINMLS
- 2025-03-12 Listed $370,000 REINMLS
- 2024-11-09 Price Changed $370,000 REINMLS
- 2024-10-29 Price Changed $375,000 REINMLS
- 2024-10-23 Price Changed $380,000 REINMLS
- 2024-10-07 Price Changed $385,000 REINMLS
- 2024-09-27 Listed $395,000 REINMLS
- 2024-09-26 Listing Removed — REINMLS
- 2024-09-04 Price Changed $395,000 REINMLS
- 2024-08-13 Price Changed $465,000 REINMLS
- 2024-08-02 Price Changed $485,000 REINMLS
- 2024-07-20 Price Changed $490,000 REINMLS
- 2024-07-12 Listed $500,000 REINMLS
Property tax history
+3.0%/yrLatest (2025): $1,700 · +0.0% YoY. Source: county tax records.
Cash-flow waterfall
monthlySold comps — $/sqft
last 12 mo · ≤1 miLoading sold comps…