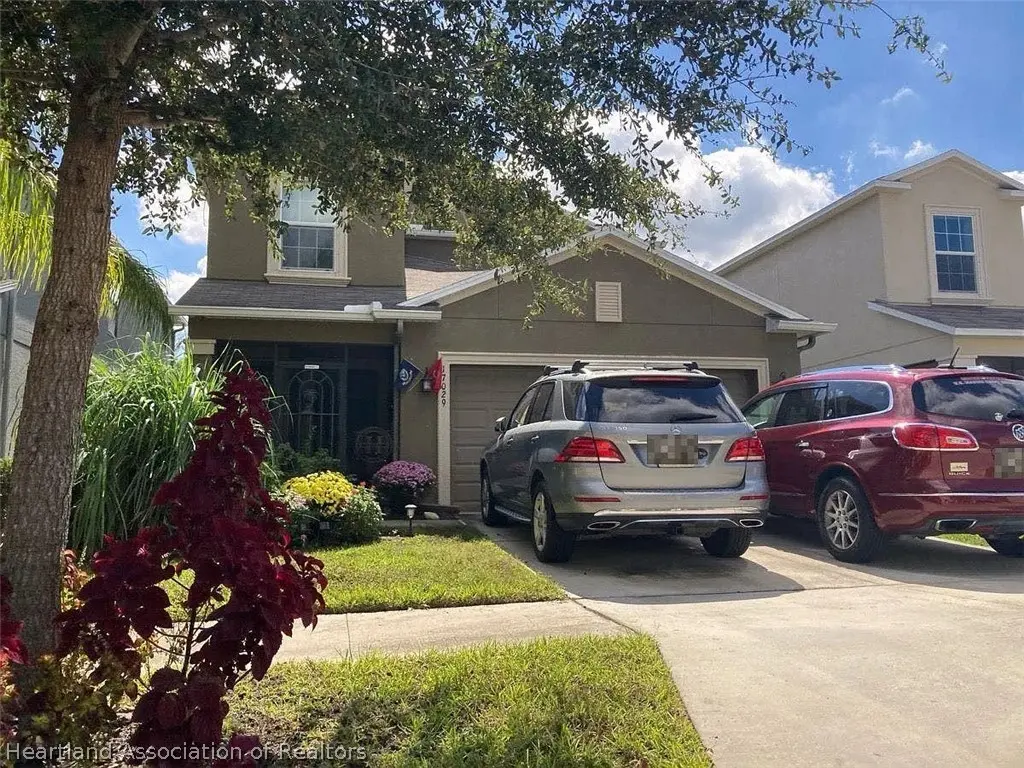
17029 Peaceful Valley Dr · Wimauma, FL
Flood risk 1/10 · Minimal
- FEMA flood zone
- X (unshaded)
- Chance of flooding over 30 yrs
- 0.0%
- Est. flood insurance / yr
- $507 – $1,088
Fire risk 5/10 · Moderate
- Est. fire insurance / yr
- $947 – $1,759
Heat risk 10/10 · Severe
- Hot days now (above 109°F)
- 7 days/yr
- Hot days in 30 yrs
- 27 days/yr
Wind risk 9/10 · Severe
- Chance of severe wind over 30 yrs
- 99.0%
Air-quality risk 3/10 · Minor
- Unhealthy air days now
- 3 days/yr
- Unhealthy air days in 30 yrs
- 3 days/yr
Risk factors via First Street. Map © Google.
Why this score? — see what drove the D+ grade
The composite is a weighted blend of 9 inputs, each scored 0–100. Each bar is that input's sub-score; the figure is the points it added to the 100-point composite (weight × sub-score).
- Cash flow +15.0/30.0
- ARV discount +7.5/15.0
- 1% rule +5.0/10.0
- DSCR +5.0/10.0
- Schools +4.2/10.0
- Appreciation +3.8/10.0
- Livability +3.2/5.0
- Condition / age +2.5/5.0
- Rent growth +1.9/5.0
$5,000
🖨 Deal sheet (PDF) 📄 Offer letter ✓ Due diligence
Listing remarks MLS
Your sitting home during this time of family and health looking at homes and came across the most absolute stunning home! You looked at the pictures and have not seen a home that looked this nice yet, "Am I correct?" Well yes, it's even better then the pics show! What these pictures aren't telling you is this - (1) Crown Molding/Wall trim throughout entire first floor (2) Granite Countertops throughout home (3) Stainless steel kitchen appliance suite (Samsung) (4) Window treatments throughout (5) Fenced In backyard with NO NEIGHBORS Behind (6) Gutters/Downspouts on entire home (7) Large screened in Lanai with extended Grill pad This home will stand out from the rest. Schedule your showing today & when your ready to see it in person, you will be even MORE impressed! Community features: * * LAWN SERVICES INCLUDED with HOA * Never worry about cutting grass again! * * Beach entry pool with poolside cabanas, hammocks, hot tub, as well as splash pad for tots Clubhouse featuring fitness center, clubhouse kitchen, billiards, playground, nature trail, fishing ponds and more
Key facts
- 4,356 sq ft lot
- 2 garage spots
- Built 2017
Property features AI
Exterior
- Parking: Garage (2 spaces)
- Utilities: Other water source; Other sewer
- Home design: Two levels; Single-family residence; Residential property; Planned Development (PD) zoning
- Construction: Metal siding
- Exterior features: Front porch; Other roof
Interior
- Bedrooms: 1 total room
- Flooring: Other
- Bathrooms: 2 full bathrooms; 1 half bathroom
- Heating & cooling: No heating; No cooling
- Interior features: Front porch; Other flooring
Neighborhood map
What this means for you Summary
Snapshot
- This is a 5-bed/3.0-bath single-family listed at $5k.
Deal economics
- At list price, monthly cash flow is $2k ($27k/yr) — positive.
- The deal already cash-flows at list — no discount required.
- Meets the 1% rule at list price ($3k rent vs $5k).
- Cap rate 552.0% vs local median 4.5% in Wimauma — top-decile yield for the area; either an underpriced asset or a hidden risk that comps aren't pricing in. Stress-test before assuming the spread holds.
Location & tenants
- Location reads 64/100 on livability (#699 in FL) — a middle-class / working-renter tenant base. Strengths: commute A, cost of living A-, crime B; Watch: amenities F, employment D-, health & safety F.
- Hillsborough (suburban): math 47% / reading 50% proficiency, ranked #41 of 73 in FL (top 56%) — families likely to look elsewhere, expect single-tenant / working-renter base with shorter leases.
- Zoned schools: Reddick Elementary School (math 34% / reading 29%, grade F, #1,841 of 2,144 statewide, top 86%, 794 students, 78% FRL); Shields Middle School (math 29% / reading 27%, grade F, #486 of 571 statewide, top 86%, 1,867 students, 68% FRL); Lennard High School (math 30% / reading 46%, grade F, #328 of 667 statewide, top 50%, 2,404 students, 47% FRL).
- Zoned-school proficiency averages 32% at this address vs 48% district-wide (-16 pts) — the specific schools serving this property underperform the Hillsborough average; the district grade overstates school quality for this exact location.
- Market conditions: Rents soft (-2.5%/yr); 689 active listings in the ZIP; 11 comparable units currently listed for rent nearby; rentals at typical pace (median 16d on market — plan ~3-4 weeks tenant-placement turnaround); solid renter incomes; 9,053 units permitted in Hillsborough County in 2024 (4,555 in 5+ unit buildings).
- This rent runs 36% of the median local income ($98k/yr) — at the standard rent-burdened threshold; future hikes will face affordability resistance.
Forward outlook
- Local home prices are declining (-2.4%/yr); year-one equity from $35 of loan paydown is wiped out by about $117 of value loss. Plan a longer hold.
- Hillsborough County population projected at +37% by 2050 — long-run rental-demand tailwind backs the buy-and-hold thesis.
- At projected returns (-2.4% appreciation + 0.0% rent growth), your $1k cash investment doubles in ~1 year — after that, you're playing with house money.
Negotiation context
- Only 4 days on market — expect competitive offers; lowballing is unlikely to land.
- 2 sale attempts since 6y ago with the ask held roughly flat each time — persistent listings suggest the price (not the market) is what's stuck; bring a comps-based counter.
Risks & watch-outs
- Climate carrying-cost: severe wind risk, 99% chance of damaging wind over 30y; moderate wildfire risk; extreme-heat days projected 7→27/yr by 2055 (HVAC capex compounding) — expect insurance premiums to compound above CPI over the hold.
Questions for the listing agent
- Is there a deadline driving the sale (1031 exchange, divorce, estate, relocation)? That informs how much negotiation room exists.
- Schools are F-rated, which usually means shorter tenancies and higher turnover. Who's the typical renter profile here, and what's been the actual vacancy rate?
- The area grade is low — what's the realistic commute time and amenity access for the typical tenant pool here? Any planned neighborhood developments (good or bad) we should know about?
- What's the average days-on-market for RENTAL listings here right now (not sales)? A rising rental-DOM trend means longer vacancies and softer asking-rent achievability than the comps imply.
- What's the recent tenant-quality profile in this submarket — average credit score on applications, eviction rate, late-payment / NSF rate, and stable-employment percentage? A property-management company in the area should have these aggregated.
- How much new for-sale + rental construction is in the pipeline within 1–3 miles? Heavy new supply typically softens prices + rents 12–24 months out; constrained supply supports both.
Investment metrics
- 1% rule
- 58.44% ✓
- Cap rate
- 551.96%
- Cash-on-cash
- 1948.82%
- DSCR
- 87.71
- GRM
- 0.1
CMA / ARV
No comps found within radius.
Projected returns pro-forma
-2.35% appreciation · 0.0% rent growth · sell at horizon
- IRR
- —
- Equity multiple
- 97.87×
- Total profit
- $135,618
- Equity at exit
- $892
- IRR
- —
- Equity multiple
- 195.12×
- Total profit
- $271,767
- Equity at exit
- $689
Cash invested: $1,400 (down + closing). Projections, not guarantees.
Landlord ↔ Tenant lean methodology
- Overall (STATE)
- 87 Strongly Landlord-Friendly
- State Florida
- 87 Strongly Landlord-Friendly · R+3
- County
- — inherits STATE
- City
- — inherits STATE
ZIP-level market 33598
- Home prices YoY
- -0.9%
- Rents YoY
- -2.5%
- Active inventory
- 689
- Price-to-rent
- 0.1×
Monthly cashflow live
- Estimated rent
- $2,922 high interval (Pro) →
- Mortgage (P&I)
- −$26
- Tax est. 1.5%
- −$6 /mo · $75/yr
- Insurance
- −$2
- HOA
- −$0
- Vacancy / Maint / Mgmt
- −$614
- Net cashflow
- $2,274
Break-even live
Sensitivity live
| Price | -10% $2,277 | -5% $2,275 | +0% $2,274 | +5% $2,272 | +10% $2,270 |
|---|---|---|---|---|---|
| Rent | -10% $2,043 | -5% $2,158 | +0% $2,274 | +5% $2,389 | +10% $2,504 |
| Rate | -1.0pp $2,276 | -0.5pp $2,275 | base $2,274 | +0.5pp $2,272 | +1.0pp $2,271 |
UW: 25.0% down · 7.5% · 30yr · 1.5% tax · 5.0% vac · 8.0% maint · 8.0% mgmt
Financing live
Cash to close
- Down payment
- $1,250
- Closing costs
- $150
- Reserves months
- —
- Total cash needed
- —
Loan-product check · same deal, 3 products live
Conventional
25% down · 7.5% · 30yr
- Down + closing
- —
- Monthly P&I
- —
- Monthly cashflow
- —
- DSCR
- —
- Eligible?
- —
Personal DTI + credit; lowest rate.
DSCR
20% down · 8.5% · 30yr
- Down + closing
- —
- Monthly P&I
- —
- Monthly cashflow
- —
- DSCR
- —
- Eligible?
- —
No personal income docs; deal must DSCR.
Hard money
10% down · 12.0% · 12mo
- Down + closing
- —
- Monthly P&I
- —
- Monthly cashflow
- —
- DSCR
- —
- Eligible?
- —
Short-term bridge; refi at stabilization.
Rent comps 11 comps
| Address | Beds | Baths | Sqft | Rent | $/sqft | DOM | Units | Dist |
|---|---|---|---|---|---|---|---|---|
| 17138 Sunshine Mimosa St Wimauma, FL | 4.0 | 2.5 | 2634 | $2,499 | $0.95 | 4d | 1 | 0.20mi |
| 17134 White Mangrove Dr Wimauma, FL | 4.0 | 2.0 | 1935 | $2,395 | $1.24 | 26d | 1 | 0.28mi |
| 17345 White Mangrove Dr Wimauma, FL | 4.0 | 2.5 | 1870 | $2,650 | $1.42 | 15d | 1 | 0.43mi |
| 16984 Oval Rum Dr Wimauma, FL | 4.0 | 3.0 | 3362 | $3,300 | $0.98 | 1d | 1 | 0.46mi |
| 17029 Blister Wing Dr Wimauma, FL | 4.0 | 2.5 | 2328 | $3,000 | $1.29 | 1d | 1 | 0.52mi |
| 17224 Auburn Arch Loop Wimauma, FL | 2.0–4.0 | 2.5 | 1517 | $2,900 | $1.91 | 19d | 20 | 0.81mi |
| 16634 Mooner Plank Cir Wimauma, FL | 4.0 | 2.5 | 2035 | $2,550 | $1.25 | 26d | 1 | 0.98mi |
| 5025 Brickwood Rise Dr Wimauma, FL | 4.0 | 2.5 | 1925 | $2,500 | $1.30 | 26d | 1 | 1.23mi |
| 5615 Red Kite Dr Wimauma, FL | 5.0 | 3.0 | 2112 | $3,000 | $1.42 | 4d | 1 | 1.24mi |
| 5757 Red Kite Dr Wimauma, FL | 5.0 | 3.0 | 2200 | $2,630 | $1.20 | 12d | 1 | 1.34mi |
| 5771 Red Kite Dr Wimauma, FL | 5.0 | 3.0 | 2200 | $2,650 | $1.20 | 26d | 1 | 1.36mi |
Listing history 3 events
-
2026-06-21days on market $5,000 Active 4 DOM
-
2026-06-17remarks 297-char remark
-
2026-06-17$5,000 Active 1 DOM
ⓘ Source: listings_history table (triggers on properties + properties_extension) + one-shot
backfill from property_details.listing_events for pre-trigger history.
Climate risk First Street
- Flood 1/10 Low FEMA zone X (unshaded) · 0% chance over 30 yrs
- Wildfire 5/10 Major
- Heat 10/10 Extreme 7 d/yr ≥109°F today · 27 d/yr by 30 yrs out
- Wind 9/10 Extreme 99% chance of damaging wind over 30 yrs
- Air quality 3/10 Moderate 3 unhealthy d/yr today · 3 by 30 yrs out
Nearby sold comps map
Loading sold comps map…
Walkable amenities ~0.75 mi
Loading nearby amenities…
Taxation est. · year 1
- Rental income
- $35,061
- − Mortgage interest
- −$280
- − Property taxes
- −$75
- − Insurance
- −$25
- − Repairs & maintenance
- −$2,805
- − Management
- −$2,805
- − Depreciation
- −$145
- Taxable income
- $28,926
- Est. tax owed @ 24.0%
- −$6,942
- After-tax cash flow
- $20,341/yr
For passive investors: Depreciation is non-cash, so a rental often shows a tax loss while cash-flowing — sheltering income. Rental losses are passive: they offset passive income freely, and up to $25,000/yr can offset ordinary (W-2) income if you actively participate and your MAGI is under $100k (phasing out to $0 by $150k); unused losses carry forward. On sale, claimed depreciation is recaptured at up to 25%, and gains may owe capital-gains tax (a 1031 exchange can defer both). Figures are a year-1 estimate at your 24.0% rate — not tax advice; consult a CPA.
Schools (NCES district)
- District
- Hillsborough
- NCES district ID
- 1200870
- Math proficiency
- 47% ▼ -8.00%
- Reading proficiency
- 50% ▼ -4.00%
- Median HH income
- $50,622
- Composite
- 41.6/100
- National rank
- #3435
- State rank
- #41 of 73 in FL
Livability — Wimauma
- Score
- 64/100
- State rank
- #699
- US rank
- #14659
Category grades
Schools grade is shown separately in the Schools card above.
Census & demographics
- Census place
- Wimauma, FL
- County
- Hillsborough County · 1,540,968 people
- City population
- 32,820
- Metro
- Tampa-St. Petersburg-Clearwater, FL
- Population (ZIP)
- 32,820
- Household income
- $97,520
- Rent vs Own
- Severe rent burden
- 149.0
Population outlook (Hillsborough County) Hauer SSP2
- Today (2025)
- 1,607,022 people
- By 2030
- 1,733,968 · +7.9%
- By 2040
- 1,979,565 · +23.2%
- By 2050
- 2,203,427 · +37.1%
- By 2075
- 2,667,893 · +66.0%
- By 2100
- 2,891,558 · +79.9%
Race, ethnicity, and origin ACS 2023
- Neighborhood character
- Diverse neighborhood (Simpson 0.67)
- Race & ethnicity
- White 40% Hispanic / Latino 39% Black 14% Two or more races 11% Asian 2%
- Hispanic origin (detail)
- Mexican 26% Puerto Rican 3% Cuban 1%
- Common ancestry
- Romanian 2% Scotch-Irish 2% Lithuanian 1%
- Foreign-born
- 23% · Canada, Jamaica, Guatemala
- Languages at home
- 62% English-only · Spanish 35% Other Indo-European 1% Arabic 1%
Political lean MEDSL · Hillsborough
- 2024 margin
- Toss-up / Even · D 47.8% · R 50.9% · Other 1.3%
- 2008→2024 swing
- -10.2pp toward R · 2008: 7.1pp · 2024: -3.1pp
- All cycles
- 2024: R+3.1 2020: D+6.9 2016: D+6.8 2012: D+6.7 2008: D+7.1
Not yet ingested
- Civics
- —
Market trends
- HPI YoY
- ▼ -2.35%
- Current HPI
- 271.8552
- Rent YoY
- ▼ -2.50%
- Metro
- Tampa-St. Petersburg-Clearwater, FL
- State GDP YoY
- ▲ 3.28%
- F500 in state
- 36
Industry mix (Fortune 500 HQ in FL)
| Industry | F500 HQs | Revenue |
|---|---|---|
| Industrial Technology | 2 | $29B |
|
||
| Insurance | 2 | $17B |
|
||
| Retail | 1 | $60B |
|
||
| Technology Distribution | 1 | $58B |
|
||
| Homebuilding | 1 | $35B |
|
||
| Technology Manufacturing | 1 | $35B |
|
||
Price history
-98.0% since first listed5 events — show timeline
- 2026-06-17 Listed $5,000 HAOR as distributed by MLS GRID
- 2020-05-13 Sold (Public Records) $253,000 Public Records
- 2020-05-08 Sold (MLS) $253,000 Stellar MLS as Distributed by MLS Grid
- 2020-04-01 Pending — Stellar MLS as Distributed by MLS Grid
- 2020-03-28 Listed $249,000 Stellar MLS as Distributed by MLS Grid
Property tax history
+5.9%/yrLatest (2025): $4,277 · +7.9% YoY. Source: county tax records.
Cash-flow waterfall
monthlySold comps — $/sqft
last 12 mo · ≤1 miLoading sold comps…