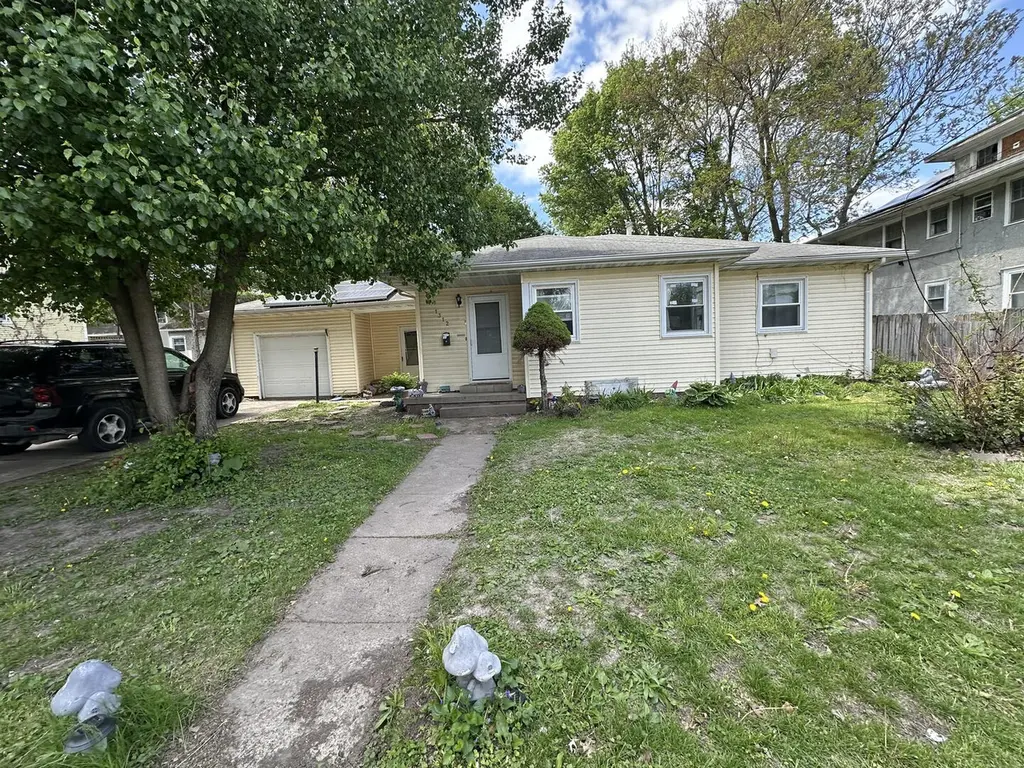
1312 Pershing Ave · Davenport, IA
Flood risk 1/10 · Minimal
- FEMA flood zone
- X (unshaded)
- Chance of flooding over 30 yrs
- 0.0%
- Est. flood insurance / yr
- $473 – $860
Fire risk 1/10 · Minimal
- Est. fire insurance / yr
- $902 – $1,676
Heat risk 3/10 · Minor
- Hot days now (above 103°F)
- 7 days/yr
- Hot days in 30 yrs
- 16 days/yr
Wind risk 2/10 · Minimal
- Chance of severe wind over 30 yrs
- —
Air-quality risk 3/10 · Minor
- Unhealthy air days now
- 2 days/yr
- Unhealthy air days in 30 yrs
- 3 days/yr
Risk factors via First Street. Map © Google.
Why this score? — see what drove the D+ grade
The composite is a weighted blend of 9 inputs, each scored 0–100. Each bar is that input's sub-score; the figure is the points it added to the 100-point composite (weight × sub-score).
- Cash flow +20.5/30.0
- DSCR +6.5/10.0
- 1% rule +5.5/10.0
- Livability +4.0/5.0
- Schools +3.9/10.0
- Rent growth +3.6/5.0
- Condition / age +2.5/5.0
- ARV discount +0.0/15.0
- Appreciation +0.0/10.0
$125,000
🖨 Deal sheet (PDF) 📄 Offer letter ✓ Due diligence
Listing remarks
3BR, 1 Car garage, Nice sized ranch. Currently rented at $1000 per month. The home has a nice layout with a full unfished basement, which could be finished for more equity. Photos are from before tenant moved in.
Key facts
- 6,098 sq ft lot
- Garage
- Built 1960
Property features AI
Finance
- Other: Property currently being leased
- HOA & community: No master association fee required
Exterior
- Parking: Attached garage (1 garage space); Driveway and off-street parking (3 total parking spaces); Concrete surfaces
- Utilities: Public water; Public sewer; Cable available
- Home design: Detached single-family home; One-story; Fee simple ownership; Built approximately 61–70 years ago; Built before 1978
- Construction: Vinyl siding exterior; Asphalt roof; Block foundation
- Exterior features: Deck; Fenced yard; Level lot (approx. 80 x 75)
Interior
- Kitchen: Range; Refrigerator; Range hood
- Bedrooms: Three bedrooms (all on main level); Primary bedroom on main level
- Flooring: Hardwood flooring in living room and bedrooms; Tile in dining room; Linoleum in kitchen; Other flooring in basement laundry
- Bathrooms: One full bathroom
- Heating & cooling: Forced air heating; Central air conditioning
- Interior features: Six total rooms; Unfinished full basement; Separate dining room
- Laundry & utility: Basement laundry (5 x 5)
Neighborhood map
What this means for you Summary
Snapshot
- This is a 3-bed/1.0-bath single-family listed at $125k.
Deal economics
- At list price, monthly cash flow is $164 ($2k/yr) — positive.
- The deal already cash-flows at list — no discount required.
- Meets the 1% rule at list price ($1k rent vs $125k).
- Recommended offer: $121k (3.0% below list) — sets the bar for market timing.
- Cap rate 7.9% vs local median 4.4% in Davenport — top-decile yield for the area; either an underpriced asset or a hidden risk that comps aren't pricing in. Stress-test before assuming the spread holds.
Location & tenants
- Location reads 79/100 on livability (#126 in IA, #2,312 nationally) — a middle-class / working-renter tenant base. Strengths: cost of living A+, housing A+, health & safety A+; Watch: employment C-, crime F.
- Davenport Community School District (urban): math 43% / reading 50% proficiency, ranked #288 of 289 in IA (top 100%) — families likely to look elsewhere, expect single-tenant / working-renter base with shorter leases.
- Zoned schools: Madison Elementary School (math 28% / reading 25%, grade F, #611 of 616 statewide, top 99%, 379 students, 73% FRL); Central High School (math 45% / reading 64%, grade C-, #290 of 336 statewide, top 87%, 1,505 students, 47% FRL) — zoned schools at 60% FRL track the district average.
- Market conditions: Rents rising fast (+4.6%/yr); 169 active listings in the ZIP; 40 comparable units currently listed for rent nearby; rentals lingering (median 46d on market — plan ~5-8 weeks vacancy on turnover, expect pricing pressure); 60% of comp listings sitting > 30 days — soft ceiling on asking rent; 805 units permitted in Scott County in 2024 (479 in 5+ unit buildings).
Forward outlook
- Local home prices are declining (-3.0%/yr); year-one equity from $864 of loan paydown is wiped out by about $4k of value loss. Plan a longer hold.
- Scott County population projected at +19% by 2050 — long-run rental-demand tailwind backs the buy-and-hold thesis.
Negotiation context
- It's been on market 31 days — a 3% lower offer ($121k) is reasonable based on typical stale-listing flexibility.
- 5 sale attempts since 21y ago with the ask held roughly flat each time — persistent listings suggest the price (not the market) is what's stuck; bring a comps-based counter.
- Current owner paid $48k; list at $125k implies a 160% gain — meaningful room to come down on a strong offer.
Questions for the listing agent
- It's been on market 31 days. Have you received any prior offers? Is the seller open to a 3% concession, seller financing, or rate buy-down credit?
- Built in 1960 — when were the roof, HVAC, electrical panel, plumbing, and water heater last replaced?
- Is there a deadline driving the sale (1031 exchange, divorce, estate, relocation)? That informs how much negotiation room exists.
- Crime grade is F in this area — have there been break-ins, vandalism, or insurance claims at this property in the last 3 years? What carrier currently insures it and at what premium?
- The area grade is low — what's the realistic commute time and amenity access for the typical tenant pool here? Any planned neighborhood developments (good or bad) we should know about?
- What's the average days-on-market for RENTAL listings here right now (not sales)? A rising rental-DOM trend means longer vacancies and softer asking-rent achievability than the comps imply.
- What's the recent tenant-quality profile in this submarket — average credit score on applications, eviction rate, late-payment / NSF rate, and stable-employment percentage? A property-management company in the area should have these aggregated.
- How much new for-sale + rental construction is in the pipeline within 1–3 miles? Heavy new supply typically softens prices + rents 12–24 months out; constrained supply supports both.
Investment metrics
- 1% rule
- 1.05% ✓
- Cap rate
- 7.86%
- Cash-on-cash
- 5.61%
- DSCR
- 1.25
- GRM
- 7.9
CMA / ARV
- ARV (median comp)
- $106,029
- List price
- $125,000
- Delta
- 17.89%
- Verdict
- OVERPRICED
- Comps
- 20 within 1.0 mi
Show comp detail 12 sales within ~0.75 mi
| Address | Dist | Beds/Ba | Sqft | Sold | Price | $/sf | Match |
|---|---|---|---|---|---|---|---|
| 209 E 13th St | 0.05mi | 3/1.0 | 1,144 (-15%) | 2mo | $45,000 | $39 | 71 |
| 402 E Pleasant St | 0.44mi | 4/1.0 (+1) | 1,300 (-3%) | 1mo | $140,000 | $108 | 69 |
| 730 E 14th St St | 0.40mi | 4/2.0 (+1) | 1,325 (-1%) | 4mo | $72,000 | $54 | 67 |
| 2214 Grand Ave | 0.70mi | 3/1.5 | 1,338 (-0%) | 1mo | $136,000 | $102 | 64 |
| 2130 Pershing Ave | 0.55mi | 2/1.0 (-1) | 1,355 (+1%) | 7mo | $50,000 | $37 | 62 |
| 734 W 17th St | 0.73mi | 3/1.0 | 1,389 (+4%) | 2mo | $138,000 | $99 | 59 |
| 818 Charlotte St | 0.67mi | 4/2.0 (+1) | 1,330 (-1%) | 0mo | $95,000 | $71 | 58 |
| 727 W 11th St | 0.69mi | 3/1.0 | 1,428 (+6%) | 1mo | $65,000 | $46 | 56 |
| 1102 Kirkwood Blvd | 0.63mi | 3/2.0 | 1,428 (+6%) | 1mo | $129,000 | $90 | 55 |
| 1920 Carey Ave | 0.70mi | 4/2.0 (+1) | 1,329 (-1%) | 4mo | $180,000 | $135 | 54 |
| 1030 Oneida Ave | 0.64mi | 4/2.0 (+1) | 1,386 (+3%) | 12mo | $200,000 | $144 | 46 |
| 1936 Carey Ave | 0.71mi | 4/2.0 (+1) | 1,288 (-4%) | 9mo | $210,500 | $163 | 44 |
Match score weights: distance 35% · size 25% · config 20% · recency 20%. Top-matched comps best support the ARV.
Projected returns pro-forma
-3.0% appreciation · 4.57% rent growth · sell at horizon
- IRR
- -5.8%
- Equity multiple
- 0.78×
- Total profit
- $-7,690
- Equity at exit
- $18,638
- IRR
- 5.7%
- Equity multiple
- 1.45×
- Total profit
- $15,799
- Equity at exit
- $10,808
Cash invested: $35,000 (down + closing). Projections, not guarantees.
Landlord ↔ Tenant lean methodology
- Overall (STATE)
- 83 Strongly Landlord-Friendly
- State Iowa
- 83 Strongly Landlord-Friendly · R+6
- County
- — inherits STATE
- City
- — inherits STATE
ZIP-level market 52803
- Home prices YoY
- -34.5%
- Rents YoY
- 4.6%
- Active inventory
- 169
- Price-to-rent
- 7.9×
Monthly cashflow live
- Estimated rent
- $1,318 high interval (Pro) →
- Mortgage (P&I)
- −$656
- Tax from tax record
- −$170 /mo · $2,038/yr
- Insurance
- −$52
- HOA
- −$0
- Lot rent
- −$0
- Vacancy / Maint / Mgmt
- −$277
- Net cashflow
- $164
Break-even live
Sensitivity live
| Price | -10% $234 | -5% $199 | +0% $164 | +5% $128 | +10% $93 |
|---|---|---|---|---|---|
| Rent | -10% $60 | -5% $112 | +0% $164 | +5% $216 | +10% $268 |
| Rate | -1.0pp $227 | -0.5pp $195 | base $164 | +0.5pp $131 | +1.0pp $98 |
UW: 25.0% down · 7.5% · 30yr · 1.5% tax · 5.0% vac · 8.0% maint · 8.0% mgmt
Financing live
Cash to close
- Down payment
- $31,250
- Closing costs
- $3,750
- Reserves months
- —
- Total cash needed
- —
Loan-product check · same deal, 3 products live
Conventional
25% down · 7.5% · 30yr
- Down + closing
- —
- Monthly P&I
- —
- Monthly cashflow
- —
- DSCR
- —
- Eligible?
- —
Personal DTI + credit; lowest rate.
DSCR
20% down · 8.5% · 30yr
- Down + closing
- —
- Monthly P&I
- —
- Monthly cashflow
- —
- DSCR
- —
- Eligible?
- —
No personal income docs; deal must DSCR.
Hard money
10% down · 12.0% · 12mo
- Down + closing
- —
- Monthly P&I
- —
- Monthly cashflow
- —
- DSCR
- —
- Eligible?
- —
Short-term bridge; refi at stabilization.
Rent comps 40 comps
| Address | Beds | Baths | Sqft | Rent | $/sqft | DOM | Units | Dist |
|---|---|---|---|---|---|---|---|---|
| 119 E 13th St Davenport, IA | 3.0 | 1.0 | 1728 | $1,495 | $0.87 | 46d | 1 | 0.12mi |
| 317 Kirkwood Blvd Davenport, IA | 2.0 | 1.0 | 1300 | $950 | $0.73 | 46d | 1 | 0.20mi |
| 1421 N Main St #2 Davenport, IA | 3.0 | 1.0 | 1350 | $1,095 | $0.81 | 46d | 1 | 0.24mi |
| 1812 Pershing Ave Unit 1 Davenport, IA | 3.0 | 1.0 | 1000 | $1,200 | $1.20 | 23d | 1 | 0.33mi |
| 1421 Grand Ave Unit 1 Davenport, IA | 2.0 | 1.0 | 1015 | $850 | $0.84 | 46d | 1 | 0.35mi |
| 201 E Locust St Unit Sw Davenport, IA | 2.0 | 1.0 | 1000 | $875 | $0.88 | 46d | 1 | 0.36mi |
| 1511 N Ripley St Davenport, IA | 4.0 | 2.0 | 1872 | $1,450 | $0.77 | 23d | 1 | 0.42mi |
| 1519 N Ripley St Davenport, IA | 2.0 | 1.0 | 1144 | $1,100 | $0.96 | 16d | 1 | 0.42mi |
| 1615 1/2 N Ripley St Davenport, IA | 2.0 | 1.0 | 900 | $825 | $0.92 | 46d | 1 | 0.45mi |
| 1301 Arlington Ave Unit 1305 Davenport, IA | 2.0 | 1.0 | 900 | $895 | $0.99 | 16d | 1 | 0.46mi |
| 321 E 7th St Davenport, IA | 1.0–2.0 | 1.0 | 825 | $1,050 | $1.27 | 16d | 4 | 0.48mi |
| 616 E 6th St Davenport, IA | 4.0 | 1.0 | 1578 | $1,712 | $1.08 | 46d | 1 | 0.54mi |
| 511 Pershing Ave Apt 602W Davenport, IA | 2.0 | 2.0 | 948 | $1,367 | $1.44 | 46d | 1 | 0.56mi |
| 511 Pershing Ave Unit 102W Davenport, IA | 2.0 | 1.0 | 1173 | $1,506 | $1.28 | 46d | 1 | 0.56mi |
| 511 Pershing Ave Unit 402W Davenport, IA | 2.0 | 2.0 | 1106 | $1,478 | $1.34 | 46d | 1 | 0.56mi |
| 511 Pershing Ave Unit 301E Davenport, IA | 3.0 | 2.0 | 1429 | $2,126 | $1.49 | 46d | 1 | 0.56mi |
| 511 Pershing Ave Unit 609W Davenport, IA | 2.0 | 1.0 | 912 | $1,317 | $1.44 | 46d | 1 | 0.56mi |
| 511 Pershing Ave Unit 106E Davenport, IA | 3.0 | 2.0 | 1349 | $1,996 | $1.48 | 46d | 1 | 0.56mi |
| 511 Pershing Ave Unit 105E Davenport, IA | 2.0 | 2.0 | 1100 | $1,635 | $1.49 | 46d | 1 | 0.56mi |
| 511 Pershing Ave Unit 101W Davenport, IA | 2.0 | 1.0 | 1280 | $1,704 | $1.33 | 46d | 1 | 0.56mi |
| 511 Pershing Ave Unit 202W Davenport, IA | 2.0 | 1.0 | 1201 | $1,601 | $1.33 | 46d | 1 | 0.56mi |
| 511 Pershing Ave Unit 407W Davenport, IA | 2.0 | 2.0 | 1175 | $1,568 | $1.33 | 46d | 1 | 0.56mi |
| 1017 E 13th St Unit 1017 Davenport, IA | 2.0 | 1.0 | 1335 | $950 | $0.71 | 23d | 1 | 0.56mi |
| 537 W 16th St Davenport, IA | 3.0 | 1.0 | 1311 | $1,400 | $1.07 | 46d | 1 | 0.58mi |
| 1323 N Gaines St Davenport, IA | 4.0 | 2.0 | 1733 | $1,350 | $0.78 | 23d | 1 | 0.60mi |
| 621 W 15th St Davenport, IA | 4.0 | 2.0 | 1833 | $1,500 | $0.82 | 16d | 1 | 0.60mi |
| 427 Pershing Ave Davenport, IA | 3.0 | 2.0 | 1438 | $2,288 | $1.59 | 16d | 3 | 0.60mi |
| 427 N Brady St Unit 1 Davenport, IA | 3.0 | 1.5 | 1126 | $1,359 | $1.21 | 46d | 1 | 0.62mi |
| 427 N Brady St Unit 6 Davenport, IA | 2.0 | 1.0 | 916 | $995 | $1.09 | 46d | 1 | 0.62mi |
| 427 Iowa St Unit 1-C308 Davenport, IA | 2.0 | 1.5 | 950 | $1,354 | $1.43 | 46d | 1 | 0.62mi |
| 2224 Iowa St Davenport, IA | 2.0 | 1.0 | 1214 | $895 | $0.74 | 46d | 1 | 0.64mi |
| 2224 Iowa St Unit 2224 Davenport, IA | 2.0 | 1.0 | 1214 | $925 | $0.76 | 46d | 1 | 0.64mi |
| 736 Federal St Davenport, IA | 1.0–3.0 | 1.0–2.0 | 1186 | $1,868 | $1.57 | 23d | 1 | 0.66mi |
| 401 Brady St Davenport, IA | 1.0–3.0 | 1.0–2.0 | 870 | $2,100 | $2.41 | 16d | 2 | 0.66mi |
| 1315 Brown St Unit 2 Davenport, IA | 3.0 | 1.0 | 1300 | $1,250 | $0.96 | 23d | 1 | 0.68mi |
| 2209 Farnam St Unit 2211 Davenport, IA | 3.0 | 1.0 | 1138 | $1,050 | $0.92 | 23d | 1 | 0.68mi |
| 1318 1/2 Brown St Davenport, IA | 2.0 | 1.0 | 900 | $875 | $0.97 | 23d | 1 | 0.71mi |
| 200 E 3rd St Davenport, IA | 1.0–2.0 | 1.0–2.0 | 900 | $1,700 | $1.89 | 16d | 2 | 0.71mi |
| 106 E 3rd St Davenport, IA | 1.0–2.0 | 1.0 | 812 | $1,299 | $1.60 | 46d | 1 | 0.74mi |
| 212 N Brady St Davenport, IA | 2.0–3.0 | 2.0–3.0 | 1428 | $2,600 | $1.82 | 16d | 4 | 0.79mi |
Listing history 17 events
-
2026-06-23days on market $125,000 Active 31 DOM
-
2026-06-21days on market $125,000 Active 30 DOM
-
2026-06-18days on market $125,000 Active 27 DOM
-
2026-06-17days on market $125,000 Active 26 DOM
-
2026-06-16days on market $125,000 Active 25 DOM
-
2026-06-15days on market $125,000 Active 24 DOM
-
2026-06-14days on market $125,000 Active 22 DOM
-
2026-06-13statusdays on market $125,000 Active 21 DOM
-
2026-05-08$125,000 Active 212-char remark
-
2021-08-06historical
-
2021-08-06historical
-
2018-11-08soldstatus $48,000
-
2018-11-08soldstatus $48,000
-
2018-09-14$50,000
-
2018-09-14$50,000
-
2006-06-08soldstatus $67,000
-
2005-12-22$66,000
ⓘ Source: listings_history table (triggers on properties + properties_extension) + one-shot
backfill from property_details.listing_events for pre-trigger history.
Tax reassessment forecast IA · Partial reset (capped growth)
- Current annual tax
- $2,038 · $170/mo
- Projected year-2 tax
- $2,038 · $170/mo
- Expected delta
- $0/yr ($0/mo · 0.0%)
ⓘ Screening estimate from a state-policy table — verify with the county assessor before closing.
Climate risk First Street
- Flood 1/10 Low FEMA zone X (unshaded) · 0% chance over 30 yrs
- Wildfire 1/10 Low
- Heat 3/10 Moderate 7 d/yr ≥103°F today · 16 d/yr by 30 yrs out
- Wind 2/10 Low
- Air quality 3/10 Moderate 2 unhealthy d/yr today · 3 by 30 yrs out
Nearby sold comps map
Loading sold comps map…
Walkable amenities ~0.75 mi
Loading nearby amenities…
Taxation est. · year 1
- Rental income
- $15,815
- − Mortgage interest
- −$7,002
- − Property taxes
- −$2,038
- − Insurance
- −$625
- − Repairs & maintenance
- −$1,265
- − Management
- −$1,265
- − Depreciation
- −$3,636
- Taxable loss
- −$18
- Est. tax savings @ 24.0%
- +$4
- After-tax cash flow
- $1,968/yr
For passive investors: Depreciation is non-cash, so a rental often shows a tax loss while cash-flowing — sheltering income. Rental losses are passive: they offset passive income freely, and up to $25,000/yr can offset ordinary (W-2) income if you actively participate and your MAGI is under $100k (phasing out to $0 by $150k); unused losses carry forward. On sale, claimed depreciation is recaptured at up to 25%, and gains may owe capital-gains tax (a 1031 exchange can defer both). Figures are a year-1 estimate at your 24.0% rate — not tax advice; consult a CPA.
Schools (NCES district)
- District
- Davenport Community School District
- NCES district ID
- 1908580
- Math proficiency
- 43% ▼ -11.00%
- Reading proficiency
- 50% ▼ -3.00%
- Median HH income
- $46,157
- Composite
- 39.49/100
- National rank
- #3951
- State rank
- #288 of 289 in IA
Livability — Davenport
- Score
- 79/100
- State rank
- #126
- US rank
- #2312
Category grades
Schools grade is shown separately in the Schools card above.
Census & demographics
- Census place
- Davenport, IA
- County
- Scott County · 144,583 people
- City population
- 103,319
- Metro
- Davenport-Moline-Rock Island, IA-IL
- Population (ZIP)
- 22,742
- Household income
- $64,543
- Rent vs Own
- Severe rent burden
- 630.0
Population outlook (Scott County) Hauer SSP2
- Today (2025)
- 188,878 people
- By 2030
- 196,648 · +4.1%
- By 2040
- 210,860 · +11.6%
- By 2050
- 224,359 · +18.8%
- By 2075
- 258,884 · +37.1%
- By 2100
- 286,447 · +51.7%
Race, ethnicity, and origin ACS 2023
- Neighborhood character
- Predominantly White (69%)
- Race & ethnicity
- White 69% Black 14% Two or more races 10% Hispanic / Latino 9%
- Hispanic origin (detail)
- Mexican 7%
- Common ancestry
- Romanian 2% Portuguese 2% Iranian 2%
- Foreign-born
- 5% · Canada, United Kingdom, South Korea
- Languages at home
- 93% English-only · Spanish 4% French/Haitian/Cajun 1%
Political lean MEDSL · Scott
- 2024 margin
- Toss-up / Even · D 47.3% · R 51.2% · Other 1.4%
- 2008→2024 swing
- -18.4pp toward R · 2008: 14.6pp · 2024: -3.9pp
- All cycles
- 2024: R+3.9 2020: D+3.5 2016: D+1.4 2012: D+13.8 2008: D+14.6
Not yet ingested
- Civics
- —
Market trends
- HPI YoY
- ▼ -96.00%
- Current HPI
- 182.0976
- Rent YoY
- ▲ 4.57%
- Metro
- Davenport-Moline-Rock Island, IA-IL
- State GDP YoY
- ▲ 2.48%
- F500 in state
- 4
Industry mix (Fortune 500 HQ in IA)
| Industry | F500 HQs | Revenue |
|---|---|---|
| Financial Services | 1 | $16B |
|
||
| Retail / Convenience | 1 | $15B |
|
||
Price history
+89.4% since first listed11 events — show timeline
- 2026-06-10 Relisted — MRED as Distributed by MLS Grid
- 2026-05-27 Pending — MRED as Distributed by MLS Grid
- 2026-05-08 Listed $125,000 MRED as Distributed by MLS Grid
- 2021-08-06 Listing Removed — RMLSA as Distributed by MLS Grid
- 2021-08-06 Listing Removed — RMLSA as Distributed by MLS Grid
- 2018-11-08 Sold (MLS) $48,000 MRED as Distributed by MLS Grid
- 2018-11-08 Sold (MLS) $48,000 RMLSA as Distributed by MLS Grid
- 2018-09-14 Listed $50,000 MRED as Distributed by MLS Grid
- 2018-09-14 Listed $50,000 RMLSA as Distributed by MLS Grid
- 2006-06-08 Sold (MLS) $67,000 RMLSA as Distributed by MLS Grid
- 2005-12-22 Listed $66,000 RMLSA as Distributed by MLS Grid
Property tax history
+3.3%/yrLatest (2025): $2,038 · -9.8% YoY. Source: county tax records.
Cash-flow waterfall
monthlySold comps — $/sqft
last 12 mo · ≤1 miLoading sold comps…