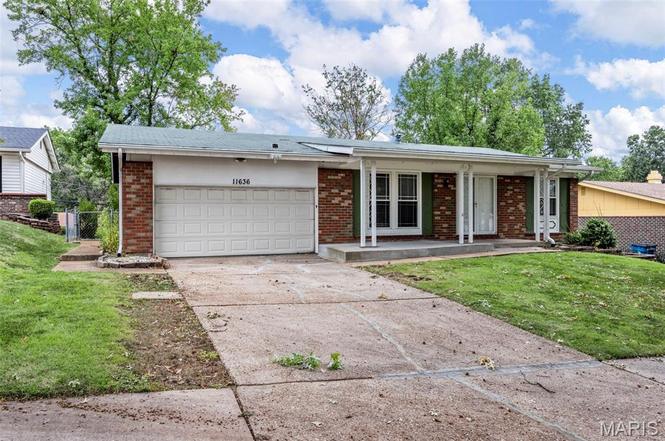
11636 Macrinus Dr · Black Jack, MO
Flood risk 1/10 · Minimal
- FEMA flood zone
- X (unshaded)
- Chance of flooding over 30 yrs
- 0.0%
- Est. flood insurance / yr
- $473 – $860
Fire risk 1/10 · Minimal
- Est. fire insurance / yr
- $1,054 – $1,958
Heat risk 5/10 · Moderate
- Hot days now (above 106°F)
- 7 days/yr
- Hot days in 30 yrs
- 21 days/yr
Wind risk 2/10 · Minimal
- Chance of severe wind over 30 yrs
- 1.0%
Air-quality risk 3/10 · Minor
- Unhealthy air days now
- 3 days/yr
- Unhealthy air days in 30 yrs
- 5 days/yr
Risk factors via First Street. Map © Google.
Why this score? — see what drove the C- grade
The composite is a weighted blend of 9 inputs, each scored 0–100. Each bar is that input's sub-score; the figure is the points it added to the 100-point composite (weight × sub-score).
- Cash flow +14.3/30.0
- Appreciation +10.0/10.0
- ARV discount +8.2/15.0
- Rent growth +4.4/5.0
- DSCR +4.3/10.0
- 1% rule +3.6/10.0
- Livability +3.5/5.0
- Condition / age +2.5/5.0
- Schools +1.7/10.0
$229,900
🖨 Deal sheet 📄 Offer letter ✓ Due diligence
Listing remarks MLS
This is the one! With 4 bedrooms and 3 bathrooms, this Ranch has the perfect amount of space. As you step inside, you immediately notice the attention to detail the seller has taken during their ownership. The main floor has enough bedrooms and bathrooms for anyone! Or, it is perfect for those that work from home and need extra bedrooms for office space. You will be impressed with the updated bathrooms on the main level. The basement has been finished to include all of the additional space you need for fun, work, play area or even storage! Step outside to the fenced in, level backyard. To top it all off, there's a newer roof! This is a must see, but don't wait! Schedule your showing today.
Key facts
- Newer roof
- Finished basement
- Updated bathrooms
Tags
Neighborhood map
What this means for you Summary
Snapshot
- This is a 4-bed/3.0-bath single-family listed at $230k.
Deal economics
- At list price, monthly cash flow is $41 ($486/yr) — positive.
- The deal already cash-flows at list — no discount required.
- To meet the 1% rule (rent ≥ 1% of price), the offer needs to be $199k (13.6% below list).
- Recommended offer: $199k (13.6% below list) — sets the bar for 1% rule.
Location & tenants
- Location reads 70/100 on livability (#132 in MO) — a middle-class / working-renter tenant base. Strengths: cost of living A+, housing A+; Watch: health & safety C-, crime D+, amenities F.
- Hazelwood (suburban): math 11% / reading 26% proficiency, ranked #306 of 324 in MO (top 94%) — low school quality limits family demand, transient renter base, plan for 1-2y turnover.
- Zoned schools: Jury Elem. (math 5% / reading 19%, grade F, #1,016 of 1,115 statewide, top 92%, 420 students, 99% FRL); Hazelwood Central High (math 12% / reading 33%, grade F, #455 of 521 statewide, top 88%, 1,628 students, 52% FRL) — zoned schools average 75% FRL vs 53% district-wide (22 pts higher); higher-poverty schools than district average — tighter screening recommended.
- Market conditions: Rents rising fast (+7.5%/yr); 218 active listings in the ZIP; 12 comparable units currently listed for rent nearby; rentals at typical pace (median 18d on market — plan ~3-4 weeks tenant-placement turnaround); 920 units permitted in St. Louis County in 2024 (250 in 5+ unit buildings).
- This rent runs 36% of the median local income ($67k/yr) — at the standard rent-burdened threshold; future hikes will face affordability resistance.
Forward outlook
- In year one you build about $25k of equity ($2k loan paydown + $23k appreciation (10.0% local appreciation)).
- At projected returns (10.0% appreciation + 7.5% rent growth), your $64k cash investment doubles in ~3 years — after that, you're playing with house money.
- By year 2, paydown + projected appreciation supports a ~$40k cash-out refi (75% LTV) — recoverable capital for the next deal without selling this one.
Negotiation context
- It's been on market 165 days — a 12% lower offer ($202k) is reasonable based on typical stale-listing flexibility.
- 3 sale attempts since 4y ago with the ask held roughly flat each time — persistent listings suggest the price (not the market) is what's stuck; bring a comps-based counter.
Risks & watch-outs
- Climate carrying-cost: extreme-heat days projected 7→21/yr by 2055 (HVAC capex compounding) — expect insurance premiums to compound above CPI over the hold.
Questions for the listing agent
- It's been on market 165 days. Have you received any prior offers? Is the seller open to a 14% concession, seller financing, or rate buy-down credit?
- Built in 1966 — when were the roof, HVAC, electrical panel, plumbing, and water heater last replaced?
- What does the HOA fee cover, when was the last increase, and are there any pending special assessments or reserve-fund shortfalls?
- Why hasn't it sold? Are there any deal-killer items the seller is aware of (foundation, flood, title, zoning, code violations)?
- Is there a deadline driving the sale (1031 exchange, divorce, estate, relocation)? That informs how much negotiation room exists.
- Crime grade is D in this area — have there been break-ins, vandalism, or insurance claims at this property in the last 3 years? What carrier currently insures it and at what premium?
- What's the average days-on-market for RENTAL listings here right now (not sales)? A rising rental-DOM trend means longer vacancies and softer asking-rent achievability than the comps imply.
- What's the recent tenant-quality profile in this submarket — average credit score on applications, eviction rate, late-payment / NSF rate, and stable-employment percentage? A property-management company in the area should have these aggregated.
- How much new for-sale + rental construction is in the pipeline within 1–3 miles? Heavy new supply typically softens prices + rents 12–24 months out; constrained supply supports both.
Investment metrics
- 1% rule
- 0.86% ✗
- Cap rate
- 6.50%
- Cash-on-cash
- 0.76%
- DSCR
- 1.03
- GRM
- 9.6
CMA / ARV
- ARV (on-the-fly)
- $233,325
- Comps found
- 12
Show comp detail 12 sales within ~0.75 mi
| Address | Dist | Beds/Ba | Sqft | Sold | Price | $/sf | Match |
|---|---|---|---|---|---|---|---|
| 11636 Macrinus Dr | 0.00mi | 4/3.0 | 1,525 (0%) | 1mo | $229,900 | $151 | 99 |
| 4471 Rhine Dr | 0.16mi | 4/3.0 | 1,525 (0%) | 7mo | $245,000 | $161 | 86 |
| 4461 Rhine Dr | 0.17mi | 3/2.5 (-1) | 1,607 (+5%) | 5mo | $150,000 | $93 | 72 |
| 4451 Rhine Dr | 0.18mi | 3/2.0 (-1) | 1,421 (-7%) | 0mo | $165,000 | $116 | 71 |
| 4443 Remus Dr | 0.14mi | 4/2.5 | 1,354 (-11%) | 3mo | $224,900 | $166 | 70 |
| 11962 Nero Dr | 0.28mi | 3/2.0 (-1) | 1,440 (-6%) | 1mo | $220,000 | $153 | 68 |
| 2325 Grassland Dr | 0.52mi | 3/2.0 (-1) | 1,525 (0%) | 2mo | $239,000 | $157 | 65 |
| 19 Bridekirk Ct | 0.51mi | 4/2.0 | 1,624 (+6%) | 1mo | $220,000 | $135 | 61 |
| 4428 Papal Dr | 0.15mi | 3/2.0 (-1) | 1,318 (-14%) | 6mo | $129,900 | $99 | 57 |
| 2390 Grassland Dr | 0.57mi | 4/2.0 | 1,653 (+8%) | 4mo | $175,000 | $106 | 52 |
| 4394 Satiris Dr | 0.32mi | 3/2.0 (-1) | 1,301 (-15%) | 0mo | $235,000 | $181 | 51 |
| 4040 Helmkampf Dr | 0.61mi | 3/2.0 (-1) | 1,371 (-10%) | 8mo | $215,000 | $157 | 39 |
Match score weights: distance 35% · size 25% · config 20% · recency 20%. Top-matched comps best support the ARV.
Projected returns pro-forma
10.0% appreciation · 7.51% rent growth · sell at horizon
- IRR
- 26.4%
- Equity multiple
- 3.13×
- Total profit
- $137,204
- Equity at exit
- $207,112
- IRR
- 24.3%
- Equity multiple
- 7.60×
- Total profit
- $424,902
- Equity at exit
- $446,645
Cash invested: $64,372 (down + closing). Projections, not guarantees.
Landlord ↔ Tenant lean methodology
- Overall (STATE)
- 81 Strongly Landlord-Friendly
- State Missouri
- 81 Strongly Landlord-Friendly · R+10
- County
- — inherits STATE
- City
- — inherits STATE
ZIP-level market 63033
- Home prices YoY
- 2.5%
- Rents YoY
- 7.5%
- Active inventory
- 218
- Price-to-rent
- 9.6×
Monthly cashflow live
- Estimated rent
- $1,986 high interval (Pro) →
- Mortgage (P&I)
- −$1,206
- Tax from tax record
- −$221 /mo · $2,653/yr
- Insurance
- −$96
- HOA
- −$6
- Vacancy / Maint / Mgmt
- −$417
- Net cashflow
- $41
Break-even live
UW: 25.0% down · 7.5% · 30yr · 1.5% tax · 5.0% vac · 8.0% maint · 8.0% mgmt
Financing live
Cash to close
- Down payment
- $57,475
- Closing costs
- $6,897
- Reserves months
- —
- Total cash needed
- —
Loan-product check · same deal, 3 products live
Conventional
25% down · 7.5% · 30yr
- Down + closing
- —
- Monthly P&I
- —
- Monthly cashflow
- —
- DSCR
- —
- Eligible?
- —
Personal DTI + credit; lowest rate.
DSCR
20% down · 8.5% · 30yr
- Down + closing
- —
- Monthly P&I
- —
- Monthly cashflow
- —
- DSCR
- —
- Eligible?
- —
No personal income docs; deal must DSCR.
Hard money
10% down · 12.0% · 12mo
- Down + closing
- —
- Monthly P&I
- —
- Monthly cashflow
- —
- DSCR
- —
- Eligible?
- —
Short-term bridge; refi at stabilization.
Rent comps 12 comps
| Address | Beds | Baths | Sqft | Rent | $/sqft | DOM | Units | Dist |
|---|---|---|---|---|---|---|---|---|
| 11635 Hazeloak Dr Black Jack, MO | 3.0 | 2.0 | 1124 | $1,728 | $1.54 | 17d | 1 | 0.27mi |
| 4872 Bristol Rock Rd Black Jack, MO | 4.0 | 2.0 | 1448 | $2,061 | $1.42 | 2d | 1 | 0.32mi |
| 4583 Whisper Lake Dr Black Jack, MO | 1.0–5.0 | 1.0–2.5 | 1225 | $1,354 | $1.10 | 2d | 17 | 0.64mi |
| 4440 Parker Rd Black Jack, MO | 3.0 | 2.0 | 1900 | $1,711 | $0.90 | 2d | 1 | 0.70mi |
| 2544 Netherton Dr Saint Louis, MO | 3.0 | 2.0 | 1288 | $1,945 | $1.51 | 2d | 1 | 0.97mi |
| 2257 Luxmore Dr Saint Louis, MO | 3.0 | 3.0 | 1073 | $1,495 | $1.39 | 23d | 1 | 1.24mi |
| 5364 Trailview Dr Black Jack, MO | 4.0 | 3.0 | 1992 | $2,330 | $1.17 | 22d | 1 | 1.33mi |
| 1536 Springlet Ct #31 Florissant, MO | 3.0 | 2.5 | 1161 | $1,450 | $1.25 | 7d | 1 | 1.38mi |
| 2259 Ainsworth Dr Saint Louis, MO | 4.0 | 2.0 | 1500 | $1,776 | $1.18 | 44d | 1 | 1.41mi |
| 2259 Ainsworth Dr Saint Louis, MO | 4.0 | 2.0 | 1561 | $2,100 | $1.35 | 2d | 1 | 1.41mi |
| 5320 Springtrail Dr Black Jack, MO | 4.0 | 2.5 | 1712 | $2,390 | $1.40 | 22d | 1 | 1.46mi |
| 10606 Kilbourn Dr Saint Louis, MO | 3.0 | 2.0 | 2100 | $1,395 | $0.66 | 44d | 1 | 1.47mi |
HOA detail
- Monthly dues
- $6 · $72/yr
Listing history 13 events
-
2026-04-12status Pending
-
2026-03-06status Active
-
2026-01-30status Pending
-
2025-11-03price $229,900
-
2025-10-13price $234,900
-
2025-09-23$239,900 Active
-
2022-06-01price $1,840
-
2022-04-04soldstatus $215,200
-
2022-03-22soldstatus Closed 698-char remark
Show marketing remark (698 chars)
This is the one! With 4 bedrooms and 3 bathrooms, this Ranch has the perfect amount of space. As you step inside, you immediately notice the attention to detail the seller has taken during their ownership. The main floor has enough bedrooms and bathrooms for anyone! Or, it is perfect for those that work from home and need extra bedrooms for office space. You will be impressed with the updated bathrooms on the main level. The basement has been finished to include all of the additional space you need for fun, work, play area or even storage! Step outside to the fenced in, level backyard. To top it all off, there's a newer roof! This is a must see, but don't wait! Schedule your showing today.
-
2022-02-22status Pending 698-char remark
Show marketing remark (698 chars)
This is the one! With 4 bedrooms and 3 bathrooms, this Ranch has the perfect amount of space. As you step inside, you immediately notice the attention to detail the seller has taken during their ownership. The main floor has enough bedrooms and bathrooms for anyone! Or, it is perfect for those that work from home and need extra bedrooms for office space. You will be impressed with the updated bathrooms on the main level. The basement has been finished to include all of the additional space you need for fun, work, play area or even storage! Step outside to the fenced in, level backyard. To top it all off, there's a newer roof! This is a must see, but don't wait! Schedule your showing today.
-
2022-02-20$215,000 Active 698-char remark
Show marketing remark (698 chars)
This is the one! With 4 bedrooms and 3 bathrooms, this Ranch has the perfect amount of space. As you step inside, you immediately notice the attention to detail the seller has taken during their ownership. The main floor has enough bedrooms and bathrooms for anyone! Or, it is perfect for those that work from home and need extra bedrooms for office space. You will be impressed with the updated bathrooms on the main level. The basement has been finished to include all of the additional space you need for fun, work, play area or even storage! Step outside to the fenced in, level backyard. To top it all off, there's a newer roof! This is a must see, but don't wait! Schedule your showing today.
-
2002-09-09soldstatus $128,000
-
2002-06-19soldstatus $83,000
ⓘ Source: listings_history table (triggers on properties + properties_extension) + one-shot
backfill from property_details.listing_events for pre-trigger history.
Tax reassessment forecast MO · Resets to sale price
- Current annual tax
- $2,653 · $221/mo
- Projected year-2 tax
- $2,653 · $221/mo
- Expected delta
- $0/yr ($0/mo · 0.0%)
ⓘ Screening estimate from a state-policy table — verify with the county assessor before closing.
Climate risk First Street
- Flood 1/10 Low FEMA zone X (unshaded) · 0% chance over 30 yrs
- Wildfire 1/10 Low
- Heat 5/10 Major 7 d/yr ≥106°F today · 21 d/yr by 30 yrs out
- Wind 2/10 Low 100% chance of damaging wind over 30 yrs
- Air quality 3/10 Moderate 3 unhealthy d/yr today · 5 by 30 yrs out
Nearby sold comps map
Loading sold comps map…
Walkable amenities ~0.75 mi
Loading nearby amenities…
Taxation est. · year 1
- Rental income
- $23,833
- − Mortgage interest
- −$12,878
- − Property taxes
- −$2,653
- − Insurance
- −$1,150
- − Repairs & maintenance
- −$1,907
- − Management
- −$1,907
- − HOA
- −$72
- − Depreciation
- −$6,688
- Taxable loss
- −$3,421
- Est. tax savings @ 24.0%
- +$821
- After-tax cash flow
- $1,307/yr
For passive investors: Depreciation is non-cash, so a rental often shows a tax loss while cash-flowing — sheltering income. Rental losses are passive: they offset passive income freely, and up to $25,000/yr can offset ordinary (W-2) income if you actively participate and your MAGI is under $100k (phasing out to $0 by $150k); unused losses carry forward. On sale, claimed depreciation is recaptured at up to 25%, and gains may owe capital-gains tax (a 1031 exchange can defer both). Figures are a year-1 estimate at your 24.0% rate — not tax advice; consult a CPA.
Schools (NCES district)
- District
- Hazelwood
- NCES district ID
- 2913830
- Math proficiency
- 11% ▼ -13.00%
- Reading proficiency
- 26% ▼ -6.00%
- Median HH income
- $51,621
- Composite
- 16.77/100
- National rank
- #9156
- State rank
- #306 of 324 in MO
Livability — Black Jack
- Score
- 70/100
- State rank
- #132
- US rank
- #7706
Category grades
Schools grade is shown separately in the Schools card above.
Census & demographics
- County
- Saint Louis County · 888,823 people
- City population
- 42,258
- Metro
- St. Louis, MO-IL
- Population (ZIP)
- 43,056
- Household income
- $66,776
- Rent vs Own
- Severe rent burden
- 1429.0
Population outlook (St. Louis County) Hauer SSP2
- Today (2025)
- 1,025,227 people
- By 2030
- 1,028,023 · +0.3%
- By 2040
- 1,020,940 · -0.4%
- By 2050
- 1,007,280 · -1.8%
- By 2075
- 987,277 · -3.7%
- By 2100
- 921,984 · -10.1%
Race, ethnicity, and origin ACS 2023
- Neighborhood character
- Predominantly Black (71%)
- Race & ethnicity
- Black 71% White 23% Two or more races 4% Hispanic / Latino 1%
- Common ancestry
- Romanian 1% Lithuanian 1% Italian 1%
- Foreign-born
- 3% · Canada, Vietnam
- Languages at home
- 95% English-only · Spanish 1% French/Haitian/Cajun 1%
Political lean MEDSL · St. Louis
- 2024 margin
- Strong D (+23.4) · D 60.8% · R 37.4% · Other 1.7%
- 2008→2024 swing
- +3.5pp toward D · 2008: 19.9pp · 2024: 23.4pp
- All cycles
- 2024: D+23.4 2020: D+24.0 2016: D+16.2 2012: D+13.7 2008: D+19.9
Not yet ingested
- Civics
- —
Market trends
- HPI YoY
- ▲ 13.78%
- Current HPI
- 570.6
- Rent YoY
- ▲ 7.51%
- Metro
- St. Louis, MO-IL
- State GDP YoY
- ▲ 1.84%
- F500 in state
- 20
Industry mix (Fortune 500 HQ in MO)
| Industry | F500 HQs | Revenue |
|---|---|---|
| Healthcare | 1 | $163B |
|
||
| Insurance | 1 | $21B |
|
||
| Industrial Technology | 1 | $17B |
|
||
| Retail | 1 | $16B |
|
||
| Industrial Distribution | 1 | $10B |
|
||
| Utilities | 1 | $9B |
|
||
Price history
+177.0% since first listed13 events — show timeline
- 2026-04-12 Pending — MARIS as Distributed by MLS Grid
- 2026-03-06 Relisted — MARIS as Distributed by MLS Grid
- 2026-01-30 Pending — MARIS as Distributed by MLS Grid
- 2025-11-03 Price Changed $229,900 MARIS as Distributed by MLS Grid
- 2025-10-13 Price Changed $234,900 MARIS as Distributed by MLS Grid
- 2025-09-23 Listed $239,900 MARIS as Distributed by MLS Grid
- 2022-06-01 Price Changed $1,840 RENT.
- 2022-04-04 Sold (Public Records) $215,200 Public Records
- 2022-03-22 Sold (MLS) — MARIS as Distributed by MLS Grid
- 2022-02-22 Pending — MARIS as Distributed by MLS Grid
- 2022-02-20 Listed $215,000 MARIS as Distributed by MLS Grid
- 2002-09-09 Sold (Public Records) $128,000 Public Records
- 2002-06-19 Sold (Public Records) $83,000 Public Records
Property tax history
+2.4%/yrLatest (2022): $2,653 · +5.6% YoY. Source: county tax records.
Cash-flow waterfall
monthlySold comps — $/sqft
last 12 mo · ≤1 miLoading sold comps…