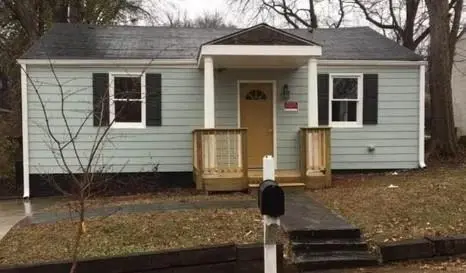
220 Ormond St SW · Atlanta, GA
Flood risk 1/10 · Minimal
- FEMA flood zone
- X (unshaded)
- Chance of flooding over 30 yrs
- 0.0%
- Est. flood insurance / yr
- $507 – $1,088
Fire risk 1/10 · Minimal
- Est. fire insurance / yr
- $963 – $1,789
Heat risk 5/10 · Moderate
- Hot days now (above 104°F)
- 7 days/yr
- Hot days in 30 yrs
- 18 days/yr
Wind risk 4/10 · Minor
- Chance of severe wind over 30 yrs
- 24.0%
Air-quality risk 4/10 · Minor
- Unhealthy air days now
- 4 days/yr
- Unhealthy air days in 30 yrs
- 6 days/yr
Risk factors via First Street. Map © Google.
Why this score? — see what drove the D grade
The composite is a weighted blend of 9 inputs, each scored 0–100. Each bar is that input's sub-score; the figure is the points it added to the 100-point composite (weight × sub-score).
- ARV discount +15.0/15.0
- Cash flow +10.1/30.0
- Livability +4.2/5.0
- Rent growth +3.3/5.0
- DSCR +2.9/10.0
- 1% rule +2.7/10.0
- Schools +2.7/10.0
- Condition / age +2.5/5.0
- Appreciation +0.0/10.0
$205,000
🖨 Deal sheet (PDF) 📄 Offer letter ✓ Due diligence
Listing remarks MLS
Great ranch style home, includes updated kitchen with stainless appliances, living room/dining combo, tile bathrooms, cute front porch, and nice backyard with deck.
Key facts
- 4,299 sq ft lot
- Built 1950
- Listed 136 days
Neighborhood map
What this means for you Summary
Snapshot
- This is a 2-bed/1.0-bath single-family listed at $205k.
Deal economics
- At list price, monthly cash flow is $-120 ($-1k/yr) — negative.
- To cash-flow at today's rent, offer at most $184k (10.3% below list).
- To meet the 1% rule (rent ≥ 1% of price), the offer needs to be $159k (22.6% below list).
- Recommended offer: $159k (22.6% below list) — sets the bar for 1% rule.
- Cap rate 5.6% vs local median 3.1% in Atlanta — top-decile yield for the area; either an underpriced asset or a hidden risk that comps aren't pricing in. Stress-test before assuming the spread holds.
Location & tenants
- Location reads 83/100 on livability (#6 in GA, #919 nationally) — a professional / high-income tenant draw. Strengths: amenities A+, commute A+, housing A+; Watch: cost of living C-.
- Atlanta Public Schools (urban): math 28% / reading 35% proficiency, ranked #80 of 174 in GA (top 46%) — families likely to look elsewhere, expect single-tenant / working-renter base with shorter leases; 71% free/reduced lunch — lower-income household profile, screen leases tightly.
- Zoned schools: Kipp Ways Primary Charter School (math 5% / reading 5%, grade F, #1,160 of 1,228 statewide, top 98%, 477 students, 100% FRL, charter); Martin L. King Jr. Middle School (math 16% / reading 23%, grade F, #356 of 470 statewide, top 78%, 818 students, 100% FRL); Maynard Jackson High School (math 30% / reading 24%, grade F, #160 of 424 statewide, top 38%, 1,474 students, 44% FRL).
- Zoned-school proficiency averages 17% at this address vs 32% district-wide (-14 pts) — the specific schools serving this property underperform the Atlanta Public Schools average; the district grade overstates school quality for this exact location.
- Market conditions: Rents rising (+3.2%/yr); 391 active listings in the ZIP; 40 comparable units currently listed for rent nearby; rentals at typical pace (median 21d on market — plan ~3-4 weeks tenant-placement turnaround); 11,565 units permitted in Fulton County in 2024 (8,159 in 5+ unit buildings).
Forward outlook
- Local home prices are declining (-3.0%/yr); year-one equity from $1k of loan paydown is wiped out by about $6k of value loss. Plan a longer hold.
- Fulton County population projected at +38% by 2050 — long-run rental-demand tailwind backs the buy-and-hold thesis.
Negotiation context
- It's been on market 136 days — a 12% lower offer ($180k) is reasonable based on typical stale-listing flexibility.
- 7 sale attempts since 10y ago with the ask held roughly flat each time — persistent listings suggest the price (not the market) is what's stuck; bring a comps-based counter.
- Current owner paid $58k; list at $205k implies a 253% gain — meaningful room to come down on a strong offer.
Risks & watch-outs
- Watch-outs: built in 1950 — expect roof / HVAC / electrical / plumbing capex.
- Climate carrying-cost: extreme-heat days projected 7→18/yr by 2055 (HVAC capex compounding) — expect insurance premiums to compound above CPI over the hold.
Questions for the listing agent
- What do current leases actually rent for vs. the listed asking? Can we see a recent rent roll and the last 12 months of T-12 income?
- It's been on market 136 days. Have you received any prior offers? Is the seller open to a 23% concession, seller financing, or rate buy-down credit?
- Built in 1950 — when were the roof, HVAC, electrical panel, plumbing, and water heater last replaced?
- Why hasn't it sold? Are there any deal-killer items the seller is aware of (foundation, flood, title, zoning, code violations)?
- Is there a deadline driving the sale (1031 exchange, divorce, estate, relocation)? That informs how much negotiation room exists.
- The area grade is low — what's the realistic commute time and amenity access for the typical tenant pool here? Any planned neighborhood developments (good or bad) we should know about?
- What's the average days-on-market for RENTAL listings here right now (not sales)? A rising rental-DOM trend means longer vacancies and softer asking-rent achievability than the comps imply.
- What's the recent tenant-quality profile in this submarket — average credit score on applications, eviction rate, late-payment / NSF rate, and stable-employment percentage? A property-management company in the area should have these aggregated.
- How much new for-sale + rental construction is in the pipeline within 1–3 miles? Heavy new supply typically softens prices + rents 12–24 months out; constrained supply supports both.
Investment metrics
- 1% rule
- 0.77% ✗
- Cap rate
- 5.59%
- Cash-on-cash
- -2.51%
- DSCR
- 0.89
- GRM
- 10.8
CMA / ARV
- ARV (median comp)
- $254,116
- List price
- $205,000
- Delta
- -19.33%
- Verdict
- UNDERPRICED
- Comps
- 20 within 1.0 mi
Show comp detail 8 sales within ~0.75 mi
| Address | Dist | Beds/Ba | Sqft | Sold | Price | $/sf | Match |
|---|---|---|---|---|---|---|---|
| 260 Ormond St SW | 0.07mi | 2/2.0 | 728 (-3%) | 2mo | $243,900 | $335 | 86 |
| 1002 Ira St SW | 0.38mi | 2/1.0 | 768 (+2%) | 11mo | $163,000 | $212 | 69 |
| 913 Smith St SW | 0.35mi | 2/2.5 | 806 (+8%) | 1mo | $75,000 | $93 | 65 |
| 1050 Garibaldi St SW | 0.43mi | 1/1.0 (-1) | 704 (-6%) | 4mo | $105,000 | $149 | 62 |
| 397 Mary St SW | 0.37mi | 1/1.0 (-1) | 704 (-6%) | 10mo | $165,000 | $234 | 60 |
| 1152 West Ave SW | 0.57mi | 2/1.0 | 700 (-7%) | 6mo | $75,000 | $107 | 57 |
| 1140 Ira St SW | 0.60mi | 2/1.0 | 736 (-2%) | 16mo | $155,000 | $211 | 55 |
| 935 Smith St SW | 0.36mi | 2/2.0 | 835 (+11%) | 14mo | $285,000 | $341 | 48 |
Match score weights: distance 35% · size 25% · config 20% · recency 20%. Top-matched comps best support the ARV.
Projected returns pro-forma
-3.0% appreciation · 3.23% rent growth · sell at horizon
- IRR
- -20.2%
- Equity multiple
- 0.29×
- Total profit
- $-40,486
- Equity at exit
- $30,566
- IRR
- -12.8%
- Equity multiple
- 0.24×
- Total profit
- $-43,578
- Equity at exit
- $17,725
Cash invested: $57,400 (down + closing). Projections, not guarantees.
Landlord ↔ Tenant lean methodology
- Overall (STATE)
- 90 Strongly Landlord-Friendly
- State Georgia
- 90 Strongly Landlord-Friendly · R+3
- County
- — inherits STATE
- City
- — inherits STATE
ZIP-level market 30315
- Rents YoY
- 3.2%
- Active inventory
- 391
- Price-to-rent
- 10.8×
Monthly cashflow live
- Estimated rent
- $1,586 high interval (Pro) →
- Mortgage (P&I)
- −$1,075
- Tax from tax record
- −$212 /mo · $2,548/yr
- Insurance
- −$85
- HOA
- −$0
- Vacancy / Maint / Mgmt
- −$333
- Net cashflow
- $-120
Break-even live
Sensitivity live
| Price | -10% $-4 | -5% $-62 | +0% $-120 | +5% $-178 | +10% $-236 |
|---|---|---|---|---|---|
| Rent | -10% $-245 | -5% $-182 | +0% $-120 | +5% $-57 | +10% $5 |
| Rate | -1.0pp $-17 | -0.5pp $-68 | base $-120 | +0.5pp $-173 | +1.0pp $-227 |
UW: 25.0% down · 7.5% · 30yr · 1.5% tax · 5.0% vac · 8.0% maint · 8.0% mgmt
Financing live
Cash to close
- Down payment
- $51,250
- Closing costs
- $6,150
- Reserves months
- —
- Total cash needed
- —
Loan-product check · same deal, 3 products live
Conventional
25% down · 7.5% · 30yr
- Down + closing
- —
- Monthly P&I
- —
- Monthly cashflow
- —
- DSCR
- —
- Eligible?
- —
Personal DTI + credit; lowest rate.
DSCR
20% down · 8.5% · 30yr
- Down + closing
- —
- Monthly P&I
- —
- Monthly cashflow
- —
- DSCR
- —
- Eligible?
- —
No personal income docs; deal must DSCR.
Hard money
10% down · 12.0% · 12mo
- Down + closing
- —
- Monthly P&I
- —
- Monthly cashflow
- —
- DSCR
- —
- Eligible?
- —
Short-term bridge; refi at stabilization.
Rent comps 40 comps
| Address | Beds | Baths | Sqft | Rent | $/sqft | DOM | Units | Dist |
|---|---|---|---|---|---|---|---|---|
| 235 Dodd Ave SW Atlanta, GA | 2.0 | 2.0 | 1120 | $1,595 | $1.42 | 0d | 1 | 0.11mi |
| 840 Smith St SW Unit A Atlanta, GA | 2.0 | 1.5 | 910 | $1,550 | $1.70 | 18d | 1 | 0.33mi |
| 865 Hank Aaron Dr SE Unit 103 Atlanta, GA | 2.0 | 1.0 | 650 | $1,250 | $1.92 | 26d | 1 | 0.39mi |
| 875 Hank Aaron Dr SW Atlanta, GA | 1.0–3.0 | 1.0–2.0 | 916 | $1,460 | $1.59 | 26d | 1 | 0.40mi |
| 404 Bass St SW Atlanta, GA | 3.0 | 2.0 | 1080 | $1,850 | $1.71 | 18d | 1 | 0.43mi |
| 710 McDaniel St SW Unit 1 Atlanta, GA | 1.0 | 1.0 | 600 | $1,100 | $1.83 | 26d | 1 | 0.45mi |
| 720 Hank Aaron Dr SE Atlanta, GA | 2.0 | 1.0–2.0 | 891 | $2,234 | $2.51 | 0d | 27 | 0.49mi |
| 574 Cooper St SW Atlanta, GA | 1.0 | 1.0 | 800 | $900 | $1.12 | 22d | 1 | 0.50mi |
| 561 Formwalt St SW Atlanta, GA | 2.0 | 2.0 | 1000 | $1,600 | $1.60 | 26d | 1 | 0.51mi |
| 1093 West Ave SW Atlanta, GA | 2.0 | 1.0–2.0 | 770 | $1,414 | $1.84 | 0d | 6 | 0.52mi |
| 565 Hank Aaron Dr SW Atlanta, GA | 1.0–3.0 | 1.0–2.0 | 1139 | $2,338 | $2.05 | 0d | 22 | 0.58mi |
| 1148 Booker Ave SW Atlanta, GA | 1.0 | 1.0 | 1012 | $900 | $0.89 | 18d | 1 | 0.60mi |
| 1056 Hank Aaron Dr SW Atlanta, GA | 1.0–2.0 | 1.0 | 753 | $1,139 | $1.51 | 9d | 6 | 0.60mi |
| 502 Pryor St SW #317 Atlanta, GA | 1.0 | 1.0 | 750 | $1,350 | $1.80 | 26d | 1 | 0.65mi |
| 1178 Garibaldi St SW Atlanta, GA | 1.0 | 1.0 | 650 | $950 | $1.46 | 26d | 1 | 0.68mi |
| 72 Milton Ave SE Atlanta, GA | 2.0 | 1.0–2.0 | 818 | $2,041 | $2.49 | 0d | 19 | 0.74mi |
| 1187 McDaniel St SW Unit B Atlanta, GA | 2.0 | 1.0 | 1038 | $1,025 | $0.99 | 13d | 1 | 0.77mi |
| 1180 Sims St SW Atlanta, GA | 2.0 | 1.0 | 772 | $1,100 | $1.42 | 26d | 1 | 0.79mi |
| 207 South Ave SE Atlanta, GA | 2.0 | 1.0 | 750 | $1,977 | $2.64 | 26d | 1 | 0.80mi |
| 396 Rawson St SW Unit 12 Atlanta, GA | 2.0 | 1.0 | 1000 | $2,100 | $2.10 | 0d | 1 | 0.81mi |
| 420 Rawson St SW Atlanta, GA | 1.0 | 1.0 | 700 | $950 | $1.36 | 26d | 1 | 0.82mi |
| 396 Rawson St SW Unit 10 Atlanta, GA | 1.0 | 1.0 | 950 | $1,500 | $1.58 | 0d | 1 | 0.83mi |
| 1133 Mayland Cir SW Atlanta, GA | 3.0 | 2.0 | 1120 | $3,600 | $3.21 | 26d | 1 | 0.84mi |
| 222 Tuskegee St SE Atlanta, GA | 2.0–3.0 | 1.0–2.0 | 1202 | $1,213 | $1.01 | 26d | 6 | 0.87mi |
| 600 Mayland Ave SW Atlanta, GA | 3.0 | 2.0 | 1100 | $2,300 | $2.09 | 26d | 1 | 0.87mi |
| 125 Milton Ave SE Atlanta, GA | 2.0 | 1.0–2.0 | 965 | $2,494 | $2.58 | 0d | 30 | 0.92mi |
| 510 Whitehall St SW Unit 103 Atlanta, GA | 1.0 | 1.0 | 748 | $1,645 | $2.20 | 9d | 1 | 0.94mi |
| 825 Hank Aaron Dr SW Atlanta, GA | 2.0 | 2.0 | 861 | $1,470 | $1.71 | 26d | 1 | 0.97mi |
| 806 Murphy Ave SW Atlanta, GA | 1.0–2.0 | 1.0 | 825 | $1,254 | $1.52 | 26d | 8 | 0.97mi |
| 806 Murphy Ave SW Atlanta, GA | 1.0 | 1.0 | 731 | $1,254 | $1.72 | 9d | 3 | 0.97mi |
| 565 Northside Dr SW Atlanta, GA | 1.0 | 1.0 | 675 | $1,700 | $2.52 | 5d | 6 | 0.98mi |
| 1293 Marcy St SE Unit 8 Atlanta, GA | 1.0 | 1.0 | 600 | $950 | $1.58 | 26d | 1 | 0.99mi |
| 1295 Marcy St SE Atlanta, GA | 1.0 | 1.0 | 650 | $950 | $1.46 | 26d | 1 | 1.01mi |
| 1293-1295 Marcy St SE Unit 7 Atlanta, GA | 1.0 | 1.0 | 650 | $950 | $1.46 | 26d | 1 | 1.01mi |
| 1000 Hill St SE Unit C Atlanta, GA | 1.0 | 1.0 | 1100 | $1,823 | $1.66 | 9d | 1 | 1.02mi |
| 518 Erin Ave SW Atlanta, GA | 2.0 | 1.0 | 1075 | $2,500 | $2.33 | 19d | 1 | 1.02mi |
| 725 Catherine St SW Unit 1 Atlanta, GA | 1.0 | 1.0 | 600 | $1,195 | $1.99 | 26d | 1 | 1.03mi |
| 725 Catherine St SW Unit 1 Atlanta, GA | 1.0 | 1.0 | 651 | $1,400 | $2.15 | 17d | 1 | 1.03mi |
| 346 Peters St SW #102 Atlanta, GA | 2.0 | 1.0 | 1080 | $3,150 | $2.92 | 20d | 1 | 1.04mi |
| 346 Peters St SW #208 Atlanta, GA | 1.0 | 1.0 | 756 | $2,050 | $2.71 | 18d | 1 | 1.04mi |
Listing history 29 events
-
2026-05-31days on market $205,000 Active 136 DOM
-
2026-01-15$205,000 Active 164-char remark
Show marketing remark (164 chars)
Great ranch style home, includes updated kitchen with stainless appliances, living room/dining combo, tile bathrooms, cute front porch, and nice backyard with deck.
-
2026-01-15historical $205,000 164-char remark
Show marketing remark (164 chars)
Great ranch style home, includes updated kitchen with stainless appliances, living room/dining combo, tile bathrooms, cute front porch, and nice backyard with deck.
-
2026-01-14$205,000 New 164-char remark
Show marketing remark (164 chars)
Great ranch style home, includes updated kitchen with stainless appliances, living room/dining combo, tile bathrooms, cute front porch, and nice backyard with deck.
-
2016-11-14soldstatus $58,000
-
2016-11-04soldstatus $58,000 Sold
-
2016-11-01soldstatus $135,500 Sold
-
2016-10-19status Under Contract
-
2016-10-19historical Pending
-
2016-10-12price $49,900
-
2016-10-12price $49,900
-
2016-10-04status Back on Market
-
2016-10-04status Active
-
2016-09-12status Under Contract
-
2016-09-12historical Pending
-
2016-08-29price $54,900
-
2016-08-29price $54,900
-
2016-06-06$59,900 New
-
2016-06-03status Active
-
2016-05-20historical Pending
-
2016-05-13$59,900 Active
-
2014-07-01soldstatus $71,000
-
2006-09-06soldstatus $121,000
-
2004-08-18soldstatus $104,300
-
2003-11-18soldstatus $71,000
-
2001-12-31soldstatus $64,900
-
1983-07-31soldstatus $14,950
-
1983-01-18soldstatus $14,000
-
1981-01-30soldstatus $5,500
ⓘ Source: listings_history table (triggers on properties + properties_extension) + one-shot
backfill from property_details.listing_events for pre-trigger history.
Tax reassessment forecast GA · Resets to sale price
- Current annual tax
- $2,548 · $212/mo
- Projected year-2 tax
- $2,548 · $212/mo
- Expected delta
- $0/yr ($0/mo · 0.0%)
ⓘ Screening estimate from a state-policy table — verify with the county assessor before closing.
Climate risk First Street
- Flood 1/10 Low FEMA zone X (unshaded) · 0% chance over 30 yrs
- Wildfire 1/10 Low
- Heat 5/10 Major 7 d/yr ≥104°F today · 18 d/yr by 30 yrs out
- Wind 4/10 Moderate 24% chance of damaging wind over 30 yrs
- Air quality 4/10 Moderate 4 unhealthy d/yr today · 6 by 30 yrs out
Nearby sold comps map
Loading sold comps map…
Walkable amenities ~0.75 mi
Loading nearby amenities…
Taxation est. · year 1
- Rental income
- $19,032
- − Mortgage interest
- −$11,483
- − Property taxes
- −$2,548
- − Insurance
- −$1,025
- − Repairs & maintenance
- −$1,523
- − Management
- −$1,523
- − Depreciation
- −$5,964
- Taxable loss
- −$5,033
- Est. tax savings @ 24.0%
- +$1,208
- After-tax cash flow
- $-230/yr
For passive investors: Depreciation is non-cash, so a rental often shows a tax loss while cash-flowing — sheltering income. Rental losses are passive: they offset passive income freely, and up to $25,000/yr can offset ordinary (W-2) income if you actively participate and your MAGI is under $100k (phasing out to $0 by $150k); unused losses carry forward. On sale, claimed depreciation is recaptured at up to 25%, and gains may owe capital-gains tax (a 1031 exchange can defer both). Figures are a year-1 estimate at your 24.0% rate — not tax advice; consult a CPA.
Schools (NCES district)
- District
- Atlanta Public Schools
- NCES district ID
- 1300120
- Math proficiency
- 28% ▼ -6.00%
- Reading proficiency
- 35% ▼ -2.00%
- Median HH income
- $48,306
- Composite
- 27.27/100
- National rank
- #7006
- State rank
- #80 of 174 in GA
Livability — Atlanta
- Score
- 83/100
- State rank
- #6
- US rank
- #919
Category grades
Schools grade is shown separately in the Schools card above.
Census & demographics
- Census place
- Atlanta, GA
- County
- Fulton County · 1,094,430 people
- City population
- 629,525
- Metro
- Atlanta-Sandy Springs-Alpharetta, GA
- Population (ZIP)
- 34,264
- Household income
- $50,822
- Rent vs Own
- Severe rent burden
- 2962.0
Population outlook (Fulton County) Hauer SSP2
- Today (2025)
- 1,203,707 people
- By 2030
- 1,299,706 · +8.0%
- By 2040
- 1,488,256 · +23.6%
- By 2050
- 1,664,580 · +38.3%
- By 2075
- 2,036,072 · +69.2%
- By 2100
- 2,222,402 · +84.6%
Race, ethnicity, and origin ACS 2023
- Neighborhood character
- Predominantly Black (72%)
- Race & ethnicity
- Black 72% White 14% Hispanic / Latino 10% Two or more races 4%
- Hispanic origin (detail)
- Mexican 4%
- Common ancestry
- Romanian 1% Italian 1% Lithuanian 1%
- Foreign-born
- 5% · Canada
- Languages at home
- 90% English-only · Spanish 9% French/Haitian/Cajun 1%
Political lean MEDSL · Fulton
- 2024 margin
- Solid D (+44.9) · D 71.9% · R 27.0% · Other 1.1%
- 2008→2024 swing
- +9.8pp toward D · 2008: 35.0pp · 2024: 44.9pp
- All cycles
- 2024: D+44.9 2020: D+46.4 2016: D+42.1 2012: D+29.6 2008: D+35.0
Not yet ingested
- Civics
- —
Market trends
- HPI YoY
- ▼ -281.87%
- Current HPI
- 176.673
- Rent YoY
- ▲ 3.23%
- Metro
- Atlanta-Sandy Springs-Alpharetta, GA
- State GDP YoY
- ▲ 2.66%
- F500 in state
- 28
Industry mix (Fortune 500 HQ in GA)
| Industry | F500 HQs | Revenue |
|---|---|---|
| Paper / Packaging | 2 | $29B |
|
||
| Retail | 1 | $160B |
|
||
| Transportation / Logistics | 1 | $91B |
|
||
| Airlines | 1 | $62B |
|
||
| Consumer Goods | 1 | $47B |
|
||
| Utilities | 1 | $25B |
|
||
Price history
+3627.3% since first listed28 events — show timeline
- 2026-01-15 Listed $205,000 FMLS
- 2026-01-15 Coming Soon $205,000 FMLS
- 2026-01-14 Listed $205,000 GAMLS
- 2016-11-14 Sold (Public Records) $58,000 Public Records
- 2016-11-04 Sold (MLS) $58,000 GAMLS
- 2016-11-01 Sold (MLS) $135,500 FMLS
- 2016-10-19 Pending — GAMLS
- 2016-10-19 Contingent — FMLS
- 2016-10-12 Price Changed $49,900 GAMLS
- 2016-10-12 Price Changed $49,900 FMLS
- 2016-10-04 Relisted — GAMLS
- 2016-10-04 Relisted — FMLS
- 2016-09-12 Pending — GAMLS
- 2016-09-12 Contingent — FMLS
- 2016-08-29 Price Changed $54,900 GAMLS
- 2016-08-29 Price Changed $54,900 FMLS
- 2016-06-06 Listed $59,900 GAMLS
- 2016-06-03 Relisted — FMLS
- 2016-05-20 Contingent — FMLS
- 2016-05-13 Listed $59,900 FMLS
- 2014-07-01 Sold (Public Records) $71,000 Public Records
- 2006-09-06 Sold (Public Records) $121,000 Public Records
- 2004-08-18 Sold (Public Records) $104,300 Public Records
- 2003-11-18 Sold (Public Records) $71,000 Public Records
- 2001-12-31 Sold (Public Records) $64,900 Public Records
- 1983-07-31 Sold (Public Records) $14,950 Public Records
- 1983-01-18 Sold (Public Records) $14,000 Public Records
- 1981-01-30 Sold (Public Records) $5,500 Public Records
Property tax history
+5.1%/yrLatest (2025): $2,548 · -4.1% YoY. Source: county tax records.
Cash-flow waterfall
monthlySold comps — $/sqft
last 12 mo · ≤1 miLoading sold comps…