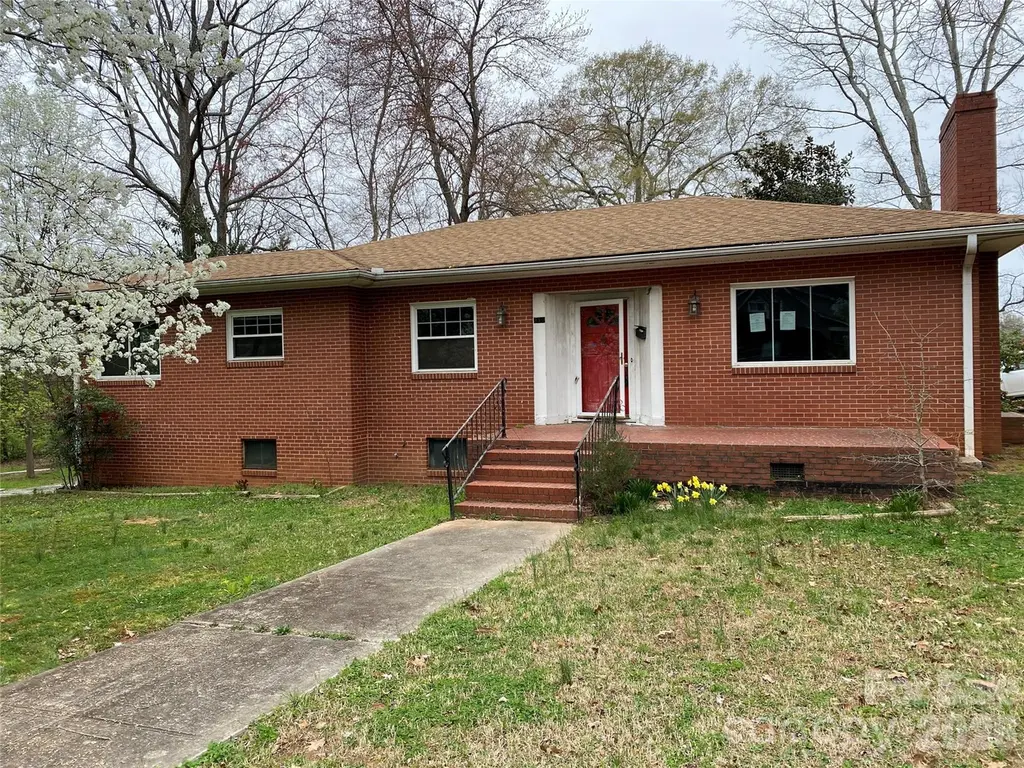
930 Church St · Salisbury, NC
Flood risk 1/10 · Minimal
- FEMA flood zone
- X (unshaded)
- Chance of flooding over 30 yrs
- 0.0%
- Est. flood insurance / yr
- $507 – $1,088
Fire risk 1/10 · Minimal
- Est. fire insurance / yr
- $906 – $1,684
Heat risk 5/10 · Moderate
- Hot days now (above 104°F)
- 7 days/yr
- Hot days in 30 yrs
- 17 days/yr
Wind risk 4/10 · Minor
- Chance of severe wind over 30 yrs
- 13.0%
Air-quality risk 3/10 · Minor
- Unhealthy air days now
- 2 days/yr
- Unhealthy air days in 30 yrs
- 3 days/yr
Risk factors via First Street. Map © Google.
Why this score? — see what drove the B- grade
The composite is a weighted blend of 9 inputs, each scored 0–100. Each bar is that input's sub-score; the figure is the points it added to the 100-point composite (weight × sub-score).
- Cash flow +30.0/30.0
- 1% rule +10.0/10.0
- DSCR +10.0/10.0
- ARV discount +7.5/15.0
- Livability +3.2/5.0
- Schools +2.6/10.0
- Rent growth +2.5/5.0
- Condition / age +2.5/5.0
- Appreciation +0.0/10.0
$70,000
🖨 Deal sheet 📄 Offer letter ✓ Due diligence
Listing remarks
2 bedroom / 1 bathroom brick ranch in Salisbury. The home features hardwood floors, spacious living room with fireplace, a formal dining area, and kitchen open to den. Unfinished partial basement with exterior entry. Sunroom off of kitchen. Patio at basement entry. HUD case 387-142853. Sold (IE) FHA insurable w/ repair escrow, subject to buyer appraisal. Property owned by US Dept. of Housing and Urban Development. Sold AS/IS without repairs or warranties. Seller, its agents & /or assigns make no representations or warranties as to property condition. Pre-1978 properties includes Lead Based Paint Addendum. Buyer & their agent to verify all information including schools, HLA, &
Key facts
- Formal dining area
- Kitchen open to den
- Hardwood floors
Tags
Neighborhood map
What this means for you Summary
Snapshot
- This is a 2-bed/1.0-bath single-family listed at $70k.
Deal economics
- At list price, monthly cash flow is $603 ($7k/yr) — positive.
- The deal already cash-flows at list — no discount required.
- Meets the 1% rule at list price ($2k rent vs $70k).
- Cap rate 16.6% vs local median 3.2% in Salisbury — top-decile yield for the area; either an underpriced asset or a hidden risk that comps aren't pricing in. Stress-test before assuming the spread holds.
Location & tenants
- Location reads 64/100 on livability (#365 in NC) — a middle-class / working-renter tenant base. Strengths: cost of living A+, housing A+, health & safety A+; Watch: schools F, crime F, amenities D-.
- Rowan-Salisbury Schools (rural): math 26% / reading 35% proficiency, ranked #142 of 178 in NC (top 80%) — families likely to look elsewhere, expect single-tenant / working-renter base with shorter leases.
- Market conditions: 291 active listings in the ZIP; 20 comparable units currently listed for rent nearby; rentals at typical pace (median 18d on market — plan ~3-4 weeks tenant-placement turnaround); 592 units permitted in Rowan County in 2024 (5 in 5+ unit buildings).
- This rent runs 35% of the median local income ($53k/yr) — at the standard rent-burdened threshold; future hikes will face affordability resistance.
Forward outlook
- Local home prices are declining (-3.0%/yr); year-one equity from $484 of loan paydown is wiped out by about $2k of value loss. Plan a longer hold.
- Rowan County population projected to shrink 6% by 2050 — rents likely to lag national; underwrite the cash flow, not the appreciation.
- At projected returns (-3.0% appreciation + 3.0% rent growth), your $20k cash investment doubles in ~4 years — after that, you're playing with house money.
Negotiation context
- Only 2 days on market — expect competitive offers; lowballing is unlikely to land.
- 2 sale attempts since 5y ago with the ask held roughly flat each time — persistent listings suggest the price (not the market) is what's stuck; bring a comps-based counter.
Risks & watch-outs
- Watch-outs: property tax is 3.4% of price; built in 1952 — expect roof / HVAC / electrical / plumbing capex.
- Climate carrying-cost: extreme-heat days projected 7→17/yr by 2055 (HVAC capex compounding) — expect insurance premiums to compound above CPI over the hold.
Questions for the listing agent
- Built in 1952 — when were the roof, HVAC, electrical panel, plumbing, and water heater last replaced?
- Property tax is high relative to price — has the assessment been appealed recently, and will the sale trigger a re-assessment?
- Is there a deadline driving the sale (1031 exchange, divorce, estate, relocation)? That informs how much negotiation room exists.
- Schools are F-rated, which usually means shorter tenancies and higher turnover. Who's the typical renter profile here, and what's been the actual vacancy rate?
- Crime grade is F in this area — have there been break-ins, vandalism, or insurance claims at this property in the last 3 years? What carrier currently insures it and at what premium?
- What's the average days-on-market for RENTAL listings here right now (not sales)? A rising rental-DOM trend means longer vacancies and softer asking-rent achievability than the comps imply.
- What's the recent tenant-quality profile in this submarket — average credit score on applications, eviction rate, late-payment / NSF rate, and stable-employment percentage? A property-management company in the area should have these aggregated.
- How much new for-sale + rental construction is in the pipeline within 1–3 miles? Heavy new supply typically softens prices + rents 12–24 months out; constrained supply supports both.
Investment metrics
- 1% rule
- 2.16% ✓
- Cap rate
- 16.63%
- Cash-on-cash
- 36.91%
- DSCR
- 2.64
- GRM
- 3.8
CMA / ARV
- ARV (on-the-fly)
- $269,892
- Comps found
- 12
Show comp detail 12 sales within ~0.75 mi
| Address | Dist | Beds/Ba | Sqft | Sold | Price | $/sf | Match |
|---|---|---|---|---|---|---|---|
| 930 Church St | 0.00mi | 2/1.0 | 1,428 (0%) | 0mo | $110,000 | $77 | 100 |
| 117 E Steele St | 0.19mi | 2/2.0 | 1,333 (-7%) | 4mo | $268,000 | $201 | 72 |
| 112 E Steele St | 0.17mi | 2/2.0 | 1,238 (-13%) | 1mo | $305,000 | $246 | 65 |
| 227 W 11th St | 0.16mi | 3/2.0 (+1) | 1,277 (-11%) | 4mo | $225,000 | $176 | 62 |
| 806 N Craige St | 0.44mi | 3/2.0 (+1) | 1,505 (+5%) | 4mo | $270,000 | $179 | 58 |
| 1460 N Jackson St | 0.50mi | 3/2.0 (+1) | 1,296 (-9%) | 1mo | $275,000 | $212 | 51 |
| 431 N Caldwell St | 0.55mi | 3/2.0 (+1) | 1,236 (-13%) | 4mo | $233,500 | $189 | 40 |
| 427 N Caldwell St | 0.56mi | 3/2.0 (+1) | 1,236 (-13%) | 4mo | $233,500 | $189 | 39 |
| 1550 N Lee St | 0.55mi | 3/2.0 (+1) | 1,246 (-13%) | 6mo | $248,000 | $199 | 39 |
| 423 N Caldwell St | 0.57mi | 3/2.0 (+1) | 1,236 (-13%) | 4mo | $233,500 | $189 | 39 |
| 829 Green St | 0.69mi | 2/2.5 | 1,250 (-12%) | 6mo | $125,000 | $100 | 36 |
| 1200 Grady St | 0.70mi | 3/2.0 (+1) | 1,243 (-13%) | 2mo | $175,000 | $141 | 35 |
Match score weights: distance 35% · size 25% · config 20% · recency 20%. Top-matched comps best support the ARV.
Projected returns pro-forma
-3.0% appreciation · 3.0% rent growth · sell at horizon
- IRR
- 32.9%
- Equity multiple
- 2.39×
- Total profit
- $27,147
- Equity at exit
- $10,437
- IRR
- 39.9%
- Equity multiple
- 4.75×
- Total profit
- $73,454
- Equity at exit
- $6,052
Cash invested: $19,600 (down + closing). Projections, not guarantees.
Landlord ↔ Tenant lean methodology
- Overall (STATE)
- 85 Strongly Landlord-Friendly
- State North Carolina
- 85 Strongly Landlord-Friendly · R+3
- County
- — inherits STATE
- City
- — inherits STATE
ZIP-level market 28144
- Active inventory
- 291
- Price-to-rent
- 3.8×
Monthly cashflow live
- Estimated rent
- $1,515 high interval (Pro) →
- Mortgage (P&I)
- −$367
- Tax from tax record
- −$198 /mo · $2,376/yr
- Insurance
- −$29
- HOA
- −$0
- Vacancy / Maint / Mgmt
- −$318
- Net cashflow
- $603
Break-even live
UW: 25.0% down · 7.5% · 30yr · 1.5% tax · 5.0% vac · 8.0% maint · 8.0% mgmt
Financing live
Cash to close
- Down payment
- $17,500
- Closing costs
- $2,100
- Reserves months
- —
- Total cash needed
- —
Loan-product check · same deal, 3 products live
Conventional
25% down · 7.5% · 30yr
- Down + closing
- —
- Monthly P&I
- —
- Monthly cashflow
- —
- DSCR
- —
- Eligible?
- —
Personal DTI + credit; lowest rate.
DSCR
20% down · 8.5% · 30yr
- Down + closing
- —
- Monthly P&I
- —
- Monthly cashflow
- —
- DSCR
- —
- Eligible?
- —
No personal income docs; deal must DSCR.
Hard money
10% down · 12.0% · 12mo
- Down + closing
- —
- Monthly P&I
- —
- Monthly cashflow
- —
- DSCR
- —
- Eligible?
- —
Short-term bridge; refi at stabilization.
Rent comps 20 comps
| Address | Beds | Baths | Sqft | Rent | $/sqft | DOM | Units | Dist |
|---|---|---|---|---|---|---|---|---|
| 919 N Church St Salisbury, NC | 3.0 | 1.0 | 1600 | $1,549 | $0.97 | 23d | 1 | 0.04mi |
| 918 N Main St Salisbury, NC | 3.0 | 2.5 | 1548 | $1,750 | $1.13 | 23d | 1 | 0.07mi |
| 706 N Main St Salisbury, NC | 3.0 | 2.0 | 1176 | $1,700 | $1.45 | 17d | 1 | 0.25mi |
| 119 W 15th St Unit 119 Salisbury, NC | 2.0 | 1.5 | 950 | $1,200 | $1.26 | 4d | 1 | 0.58mi |
| 1225 Beard St Salisbury, NC | 3.0 | 2.0 | 1138 | $1,495 | $1.31 | 23d | 1 | 0.62mi |
| 1225 Beard St Salisbury, NC | 3.0 | 2.0 | 1138 | $1,495 | $1.31 | 2d | 1 | 0.62mi |
| 829 Green St Salisbury, NC | 3.0 | 2.0 | 1250 | $1,600 | $1.28 | 23d | 1 | 0.68mi |
| 1200 Grady St Unit Labs Salisbury, NC | 3.0 | 2.0 | 1242 | $1,395 | $1.12 | 4d | 1 | 0.70mi |
| 1101 Kenly St Salisbury, NC | 3.0 | 2.0 | 1026 | $1,599 | $1.56 | 23d | 1 | 0.76mi |
| 821 E Lafayette St Salisbury, NC | 2.0 | 1.0 | 900 | $1,050 | $1.17 | 17d | 1 | 0.78mi |
| 821 E Lafayette St Unit 821 Salisbury, NC | 2.0 | 1.0 | 900 | $1,025 | $1.14 | 4d | 1 | 0.78mi |
| 823 E Lafayette St Salisbury, NC | 2.0 | 1.0 | 900 | $1,050 | $1.17 | 2d | 1 | 0.78mi |
| 823 E Lafayette St Unit 1 Salisbury, NC | 2.0 | 1.0 | 900 | $1,025 | $1.14 | 2d | 1 | 0.78mi |
| 201 E Innes St #204 Salisbury, NC | 2.0 | 2.0 | 912 | $1,650 | $1.81 | 23d | 1 | 0.81mi |
| 718 Park Ave Salisbury, NC | 3.0 | 2.0 | 1199 | $1,700 | $1.42 | 17d | 1 | 0.83mi |
| 321 Woodson St Salisbury, NC | 1.0–3.0 | 1.0–2.5 | 1091 | $1,370 | $1.26 | 12d | 13 | 0.87mi |
| 406 Mahaley Ave Apt 1 Salisbury, NC | 2.0 | 1.0 | 900 | $1,195 | $1.33 | 23d | 1 | 1.05mi |
| 304 Mahaley Ave Salisbury, NC | 1.0 | 1.0 | 950 | $900 | $0.95 | 12d | 1 | 1.16mi |
| 202 N Merritt Ave Salisbury, NC | 3.0 | 1.5 | 1591 | $1,495 | $0.94 | 20d | 1 | 1.18mi |
| 322 W McCubbins St Salisbury, NC | 2.0 | 1.0 | 900 | $1,050 | $1.17 | 3d | 1 | 1.38mi |
Listing history 7 events
-
2026-04-24status Pending
-
2026-04-22$70,000 Active
-
2021-06-08historical Active Under Contract
-
2021-06-02historical
-
2021-05-24$70,000 Active
-
2020-08-19soldstatus $105,305
-
2009-03-17soldstatus $65,000
ⓘ Source: listings_history table (triggers on properties + properties_extension) + one-shot
backfill from property_details.listing_events for pre-trigger history.
Tax reassessment forecast NC · Resets to sale price
- Current annual tax
- $2,376 · $198/mo
- Projected year-2 tax
- $2,376 · $198/mo
- Expected delta
- $0/yr ($0/mo · 0.0%)
ⓘ Screening estimate from a state-policy table — verify with the county assessor before closing.
Climate risk First Street
- Flood 1/10 Low FEMA zone X (unshaded) · 0% chance over 30 yrs
- Wildfire 1/10 Low
- Heat 5/10 Major 7 d/yr ≥104°F today · 17 d/yr by 30 yrs out
- Wind 4/10 Moderate 13% chance of damaging wind over 30 yrs
- Air quality 3/10 Moderate 2 unhealthy d/yr today · 3 by 30 yrs out
Nearby sold comps map
Loading sold comps map…
Walkable amenities ~0.75 mi
Loading nearby amenities…
Taxation est. · year 1
- Rental income
- $18,184
- − Mortgage interest
- −$3,921
- − Property taxes
- −$2,376
- − Insurance
- −$350
- − Repairs & maintenance
- −$1,455
- − Management
- −$1,455
- − Depreciation
- −$2,036
- Taxable income
- $6,592
- Est. tax owed @ 24.0%
- −$1,582
- After-tax cash flow
- $5,653/yr
For passive investors: Depreciation is non-cash, so a rental often shows a tax loss while cash-flowing — sheltering income. Rental losses are passive: they offset passive income freely, and up to $25,000/yr can offset ordinary (W-2) income if you actively participate and your MAGI is under $100k (phasing out to $0 by $150k); unused losses carry forward. On sale, claimed depreciation is recaptured at up to 25%, and gains may owe capital-gains tax (a 1031 exchange can defer both). Figures are a year-1 estimate at your 24.0% rate — not tax advice; consult a CPA.
Schools (NCES district)
- District
- Rowan-Salisbury Schools
- NCES district ID
- 3704050
- Math proficiency
- 26% ▲ 2.00%
- Reading proficiency
- 35% ▲ 1.00%
- Median HH income
- $43,953
- Composite
- 26.01/100
- National rank
- #7317
- State rank
- #142 of 178 in NC
Livability — Salisbury
- Score
- 64/100
- State rank
- #365
- US rank
- #14533
Category grades
Schools grade is shown separately in the Schools card above.
Census & demographics
- Census place
- Salisbury, NC
- County
- Rowan County · 103,630 people
- City population
- 85,081
- Metro
- Charlotte-Concord-Gastonia, NC-SC
- Population (ZIP)
- 27,977
- Household income
- $52,568
- Rent vs Own
- Severe rent burden
- 1438.0
Population outlook (Rowan County) Hauer SSP2
- Today (2025)
- 140,430 people
- By 2030
- 140,193 · -0.2%
- By 2040
- 137,617 · -2.0%
- By 2050
- 131,826 · -6.1%
- By 2075
- 115,123 · -18.0%
- By 2100
- 92,774 · -33.9%
Race, ethnicity, and origin ACS 2023
- Neighborhood character
- Diverse neighborhood (Simpson 0.63)
- Race & ethnicity
- White 49% Black 35% Hispanic / Latino 12% Two or more races 7%
- Hispanic origin (detail)
- Mexican 4% Puerto Rican 2%
- Common ancestry
- Serbian 3% Slovak 2% Lithuanian 1%
- Foreign-born
- 5% · Canada
- Languages at home
- 91% English-only · Spanish 7% Other Indo-European 1%
Political lean MEDSL · Rowan
- 2024 margin
- Solid R (+35.9) · D 31.6% · R 67.5%
- 2008→2024 swing
- -13.1pp toward R · 2008: -22.8pp · 2024: -35.9pp
- All cycles
- 2024: R+35.9 2020: R+35.7 2016: R+36.8 2012: R+26.0 2008: R+22.8
Not yet ingested
- Civics
- —
Market trends
- HPI YoY
- ▼ -217.00%
- Current HPI
- 276.1097
- Rent YoY
- —
- Metro
- Charlotte-Concord-Gastonia, NC-SC
- State GDP YoY
- ▲ 3.28%
- F500 in state
- 26
Industry mix (Fortune 500 HQ in NC)
| Industry | F500 HQs | Revenue |
|---|---|---|
| Financial Services | 2 | $213B |
|
||
| Retail | 2 | $95B |
|
||
| Industrial Conglomerate | 1 | $38B |
|
||
| Metals / Steel | 1 | $35B |
|
||
| Utilities | 1 | $30B |
|
||
| Industrial Machinery | 1 | $19B |
|
||
Price history
+7.7% since first listed7 events — show timeline
- 2026-04-24 Pending — CANOPYMLS as Distributed by MLS Grid
- 2026-04-22 Listed $70,000 CANOPYMLS as Distributed by MLS Grid
- 2021-06-08 Contingent — CANOPYMLS as Distributed by MLS Grid
- 2021-06-02 Delisted — CANOPYMLS as Distributed by MLS Grid
- 2021-05-24 Listed $70,000 CANOPYMLS as Distributed by MLS Grid
- 2020-08-19 Sold (Public Records) $105,305 Public Records
- 2009-03-17 Sold (Public Records) $65,000 Public Records
Property tax history
+5.6%/yrLatest (2025): $2,376 · +0.0% YoY. Source: county tax records.
Cash-flow waterfall
monthlySold comps — $/sqft
last 12 mo · ≤1 miLoading sold comps…