 🏗️ New Construction
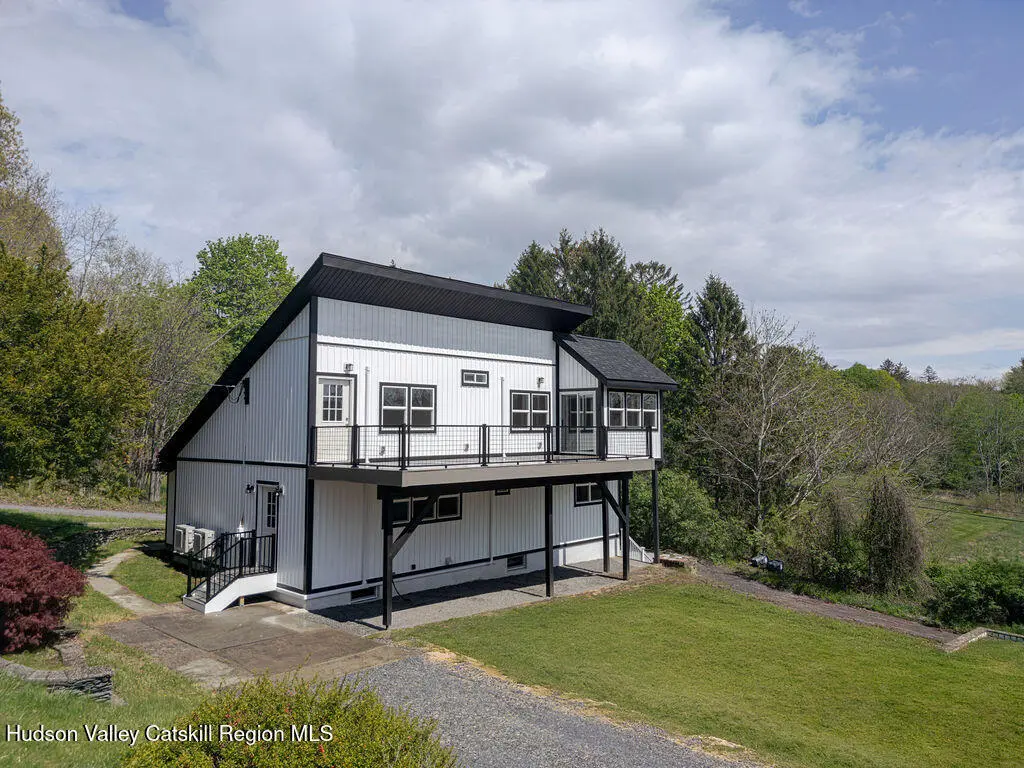
6 Wang Dr · Copake Lake, NY
Flood risk 1/10 · Minimal
- FEMA flood zone
- X
- Chance of flooding over 30 yrs
- 0.0%
- Est. flood insurance / yr
- $473 – $860
Fire risk 3/10 · Minor
- Est. fire insurance / yr
- $691 – $1,283
Heat risk 3/10 · Minor
- Hot days now (above 93°F)
- 7 days/yr
- Hot days in 30 yrs
- 16 days/yr
Wind risk 4/10 · Minor
- Chance of severe wind over 30 yrs
- 11.0%
Air-quality risk 2/10 · Minimal
- Unhealthy air days now
- 1 days/yr
- Unhealthy air days in 30 yrs
- 2 days/yr
Risk factors via First Street. Map © Google.
Why this score? — see what drove the D grade
The composite is a weighted blend of 9 inputs, each scored 0–100. Each bar is that input's sub-score; the figure is the points it added to the 100-point composite (weight × sub-score).
- Appreciation +10.0/10.0
- Cash flow +7.9/30.0
- ARV discount +7.5/15.0
- Schools +4.5/10.0
- Livability +3.1/5.0
- Rent growth +2.5/5.0
- Condition / age +2.5/5.0
- DSCR +1.9/10.0
- 1% rule +1.4/10.0
$925,000
🖨 Deal sheet 📄 Offer letter ✓ Due diligence
Listing remarks
This is a full renovation inside and out. Beautiful lake views, a dock, great neighborhood and location The main floor begins with a formal entry foyer, an open-plan kitchen, and a living room featuring preserved original wide-plank wood floors and a dramatic double-height wood-paneled ceiling that opens to an expansive great room. A main-level primary suite allows for easy single-floor living. The lower level adds a second living/recreational room, while the top floor offers two additional bedrooms and a third large room with corner windows overlooking the water -- ideal as a study, studio, or guest space. A large south-facing deck takes full advantage of the home's best feature: pe
Key facts
- 0.31 acre lot
- Garage
- Built 2026
Property features AI
Finance
- HOA & community: Community amenities include lake access and golf
Exterior
- Parking: Attached garage (1 car)
- Utilities: Private well water; Septic tank sewer; 200+ amp electric service
- Home design: Single-family residence; House with three or more levels; New construction; Facing/directions not specified; Entry level not specified
- Construction: Metal roof; Concrete perimeter foundation; Structure type: House; Built as new construction
- Exterior features: Deck; Dock; Has view; Private dirt road access (private maintained road)
Interior
- Kitchen: Electric range; Dishwasher; Microwave; Free-standing refrigerator
- Bedrooms: 7 total rooms (bedroom count not specified)
- Flooring: Ceramic tile; Hardwood; Laminate
- Bathrooms: 2 full bathrooms
- Heating & cooling: Central heating; Baseboard heating; Electric heating; Ductless heating/cooling; Heat pump; Has cooling
- Interior features: Insulated double-pane windows; Two wood-burning fireplaces (living room and family room); Partially finished walk-out basement with concrete perimeter
- Laundry & utility: Washer and dryer; Laundry on lower level
Neighborhood map
What this means for you Summary
Snapshot
- This is a 3-bed/1.0-bath single-family listed at $925k.
Deal economics
- At list price, monthly cash flow is $-998 ($-12k/yr) — negative.
- To cash-flow at today's rent, offer at most $748k (19.1% below list).
- To meet the 1% rule (rent ≥ 1% of price), the offer needs to be $588k (36.4% below list).
- Recommended offer: $588k (36.4% below list) — sets the bar for 1% rule.
- Cap rate 5.0% vs local median 2.4% in Copake Lake — top-decile yield for the area; either an underpriced asset or a hidden risk that comps aren't pricing in. Stress-test before assuming the spread holds.
Location & tenants
- Location reads 62/100 on livability (#841 in NY) — a middle-class / working-renter tenant base. Strengths: employment A+, housing A+; Watch: schools D+, amenities F, commute F.
- Taconic Hills Central School District (rural): math 53% / reading 51% proficiency, ranked #335 of 590 in NY (top 57%) — acceptable for families but not a draw, mixed tenant base, ~2y average lease.
- Market conditions: 42 active listings in the ZIP; 136 units permitted in Columbia County in 2024 (0 in 5+ unit buildings).
Forward outlook
- In year one you build about $99k of equity ($6k loan paydown + $92k appreciation (10.0% local appreciation)).
- Columbia County population projected at -22% by 2050 — secular population decline; favor cash flow + early exit over multi-decade hold.
- By year 2, paydown + projected appreciation supports a ~$159k cash-out refi (75% LTV) — recoverable capital for the next deal without selling this one.
Negotiation context
- It's been on market 37 days — a 3% lower offer ($897k) is reasonable based on typical stale-listing flexibility.
- 2 sale attempts since 3y ago with the ask held roughly flat each time — persistent listings suggest the price (not the market) is what's stuck; bring a comps-based counter.
- Current owner paid $320k; list at $925k implies a 189% gain — meaningful room to come down on a strong offer.
Questions for the listing agent
- What do current leases actually rent for vs. the listed asking? Can we see a recent rent roll and the last 12 months of T-12 income?
- It's been on market 37 days. Have you received any prior offers? Is the seller open to a 36% concession, seller financing, or rate buy-down credit?
- Is there a deadline driving the sale (1031 exchange, divorce, estate, relocation)? That informs how much negotiation room exists.
- Schools are D-rated, which usually means shorter tenancies and higher turnover. Who's the typical renter profile here, and what's been the actual vacancy rate?
- The area grade is low — what's the realistic commute time and amenity access for the typical tenant pool here? Any planned neighborhood developments (good or bad) we should know about?
- What's the average days-on-market for RENTAL listings here right now (not sales)? A rising rental-DOM trend means longer vacancies and softer asking-rent achievability than the comps imply.
- What's the recent tenant-quality profile in this submarket — average credit score on applications, eviction rate, late-payment / NSF rate, and stable-employment percentage? A property-management company in the area should have these aggregated.
- How much new for-sale + rental construction is in the pipeline within 1–3 miles? Heavy new supply typically softens prices + rents 12–24 months out; constrained supply supports both.
Investment metrics
- 1% rule
- 0.64% ✗
- Cap rate
- 5.00%
- Cash-on-cash
- -4.63%
- DSCR
- 0.79
- GRM
- 13.1
CMA / ARV
- ARV (median comp)
- $924,257
- List price
- $925,000
- Delta
- 0.08%
- Verdict
- FAIR
- Comps
- 14 within 1.0 mi
Show comp detail 5 sales within ~0.75 mi
| Address | Dist | Beds/Ba | Sqft | Sold | Price | $/sf | Match |
|---|---|---|---|---|---|---|---|
| 41 Pond Hill Rd | 0.42mi | 3/2.0 | 1,560 (-5%) | 1mo | $490,000 | $314 | 67 |
| 12 Pauline Pl | 0.03mi | 2/2.5 (-1) | 1,454 (-12%) | 4mo | $550,000 | $378 | 64 |
| 117 Spring St | 0.61mi | 2/2.0 (-1) | 1,832 (+11%) | 5mo | $415,000 | $227 | 39 |
| 27 Lake Vw | 0.54mi | 3/2.0 | 1,887 (+15%) | 16mo | $276,720 | $147 | 34 |
| 45 Oriole Rd | 0.36mi | 2/2.5 (-1) | 1,440 (-12%) | 23mo | $320,000 | $222 | 32 |
Match score weights: distance 35% · size 25% · config 20% · recency 20%. Top-matched comps best support the ARV.
Projected returns pro-forma
10.0% appreciation · 3.0% rent growth · sell at horizon
- IRR
- 21.0%
- Equity multiple
- 2.70×
- Total profit
- $439,442
- Equity at exit
- $832,644
- IRR
- 19.0%
- Equity multiple
- 6.19×
- Total profit
- $1,343,342
- Equity at exit
- $1,795,629
Cash invested: $258,792 (down + closing). Projections, not guarantees.
Landlord ↔ Tenant lean methodology
- Overall (STATE)
- 15 Strongly Tenant-Friendly
- State New York
- 15 Strongly Tenant-Friendly · D+10
- County
- — inherits STATE
- City
- — inherits STATE
ZIP-level market 12521
- Home prices YoY
- 23.4%
- Active inventory
- 42
- Price-to-rent
- 13.1×
Monthly cashflow live
- Estimated rent
- $5,883 medium interval (Pro) →
- Mortgage (P&I)
- −$4,847
- Tax from tax record
- −$413 /mo · $4,960/yr
- Insurance
- −$385
- HOA
- −$0
- Vacancy / Maint / Mgmt
- −$1,235
- Net cashflow
- $-998
Break-even live
UW: 25.0% down · 7.5% · 30yr · 1.5% tax · 5.0% vac · 8.0% maint · 8.0% mgmt
Financing live
Cash to close
- Down payment
- $231,064
- Closing costs
- $27,728
- Reserves months
- —
- Total cash needed
- —
Loan-product check · same deal, 3 products live
Conventional
25% down · 7.5% · 30yr
- Down + closing
- —
- Monthly P&I
- —
- Monthly cashflow
- —
- DSCR
- —
- Eligible?
- —
Personal DTI + credit; lowest rate.
DSCR
20% down · 8.5% · 30yr
- Down + closing
- —
- Monthly P&I
- —
- Monthly cashflow
- —
- DSCR
- —
- Eligible?
- —
No personal income docs; deal must DSCR.
Hard money
10% down · 12.0% · 12mo
- Down + closing
- —
- Monthly P&I
- —
- Monthly cashflow
- —
- DSCR
- —
- Eligible?
- —
Short-term bridge; refi at stabilization.
Listing history 20 events
-
2026-06-19days on market $925,000 Active 37 DOM
-
2026-06-18days on market $925,000 Active 36 DOM
-
2026-06-17days on market $925,000 Active 35 DOM
-
2026-06-16days on market $925,000 Active 34 DOM
-
2026-06-15days on market $925,000 Active 33 DOM
-
2026-06-14days on market $925,000 Active 31 DOM
-
2026-06-12days on market $925,000 Active 30 DOM
-
2026-06-09days on market $925,000 Active 27 DOM
-
2026-06-08days on market $925,000 Active 26 DOM
-
2026-06-07days on market $925,000 Active 25 DOM
-
2026-06-07days on market $925,000 Active 24 DOM
-
2026-06-04days on market $925,000 Active 21 DOM
-
2026-06-02days on market $925,000 Active 20 DOM
-
2026-06-01days on market $925,000 Active 19 DOM
-
2026-05-31days on market $925,000 Active 18 DOM
-
2026-05-31days on market $925,000 Active 17 DOM
-
2026-05-13$925,000 Active 1307-char remark
-
2026-05-12historical $925,000 1307-char remark
-
2024-06-21soldstatus $320,000
-
2023-06-22$375,000
ⓘ Source: listings_history table (triggers on properties + properties_extension) + one-shot
backfill from property_details.listing_events for pre-trigger history.
Tax reassessment forecast NY · Partial reset (capped growth)
- Current annual tax
- $4,960 · $413/mo
- Projected year-2 tax
- $10,296 · $858/mo
- Expected delta
- +$5,336/yr (+$445/mo · 107.6%)
ⓘ Screening estimate from a state-policy table — verify with the county assessor before closing.
Climate risk First Street
- Flood 1/10 Low FEMA zone X · 0% chance over 30 yrs
- Wildfire 3/10 Moderate
- Heat 3/10 Moderate 7 d/yr ≥93°F today · 16 d/yr by 30 yrs out
- Wind 4/10 Moderate 11% chance of damaging wind over 30 yrs
- Air quality 2/10 Low 1 unhealthy d/yr today · 2 by 30 yrs out
Nearby sold comps map
Loading sold comps map…
Walkable amenities ~0.75 mi
Loading nearby amenities…
Taxation est. · year 1
- Rental income
- $70,592
- − Mortgage interest
- −$51,773
- − Property taxes
- −$4,960
- − Insurance
- −$4,621
- − Repairs & maintenance
- −$5,647
- − Management
- −$5,647
- − Depreciation
- −$26,887
- Taxable loss
- −$28,944
- Est. tax savings @ 24.0%
- +$6,947
- After-tax cash flow
- $-5,030/yr
For passive investors: Depreciation is non-cash, so a rental often shows a tax loss while cash-flowing — sheltering income. Rental losses are passive: they offset passive income freely, and up to $25,000/yr can offset ordinary (W-2) income if you actively participate and your MAGI is under $100k (phasing out to $0 by $150k); unused losses carry forward. On sale, claimed depreciation is recaptured at up to 25%, and gains may owe capital-gains tax (a 1031 exchange can defer both). Figures are a year-1 estimate at your 24.0% rate — not tax advice; consult a CPA.
Schools (NCES district)
- District
- Taconic Hills Central School District
- NCES district ID
- 3628620
- Math proficiency
- 53% ▲ 10.00%
- Reading proficiency
- 51% ▲ 11.00%
- Median HH income
- $57,329
- Composite
- 45.16/100
- National rank
- #2676
- State rank
- #335 of 590 in NY
Livability — Copake Lake
- Score
- 62/100
- State rank
- #841
- US rank
- #16329
Category grades
Schools grade is shown separately in the Schools card above.
Census & demographics
- Census place
- Copake Lake, NY
- Population (ZIP)
- 1,874
Population outlook (Columbia County) Hauer SSP2
- Today (2025)
- 58,662 people
- By 2030
- 56,557 · -3.6%
- By 2040
- 51,324 · -12.5%
- By 2050
- 45,790 · -21.9%
- By 2075
- 35,232 · -39.9%
- By 2100
- 25,846 · -55.9%
Race, ethnicity, and origin ACS 2023
- Neighborhood character
- Predominantly White (81%)
- Race & ethnicity
- White 81% Two or more races 11% Hispanic / Latino 7% Black 1%
- Hispanic origin (detail)
- Mexican 1% Cuban 2%
- Common ancestry
- Romanian 3% Scotch-Irish 3% Slovak 2%
- Foreign-born
- 4% · Canada, Jamaica
- Languages at home
- 90% English-only · Spanish 8% Russian/Polish/Slavic 1% Other Indo-European 1%
Political lean MEDSL · Columbia
- 2024 margin
- D (+14.7) · D 57.4% · R 42.6%
- 2008→2024 swing
- +1.3pp toward D · 2008: 13.4pp · 2024: 14.7pp
- All cycles
- 2024: D+14.7 2020: D+16.7 2016: D+1.4 2012: D+11.7 2008: D+13.4
Not yet ingested
- Civics
- —
Market trends
- HPI YoY
- ▲ 83.58%
- Current HPI
- 441.0272
- Rent YoY
- —
- Metro
- —
- State GDP YoY
- ▲ 2.60%
- F500 in state
- 92
Industry mix (Fortune 500 HQ in NY)
| Industry | F500 HQs | Revenue |
|---|---|---|
| Financial Services | 10 | $950B |
|
||
| Consumer Goods | 9 | $162B |
|
||
| Insurance | 4 | $225B |
|
||
| Telecommunications | 2 | $144B |
|
||
| Pharmaceuticals | 2 | $112B |
|
||
| Media / Entertainment | 2 | $69B |
|
||
Price history
+146.7% since first listed4 events — show timeline
- 2026-05-13 Listed $925,000 HVCRMLS
- 2026-05-12 Coming Soon $925,000 HVCRMLS
- 2024-06-21 Sold (Public Records) $320,000 Public Records
- 2023-06-22 Listed $375,000 HVCRMLS
Property tax history
+1.5%/yrLatest (2025): $4,960 · +2.8% YoY. Source: county tax records.
Cash-flow waterfall
monthlySold comps — $/sqft
last 12 mo · ≤1 miLoading sold comps…