2424 S Cottonwood Ln · Tucson, AZ
Flood risk 4/10 · Minor
- FEMA flood zone
- AE
- Chance of flooding over 30 yrs
- 0.2%
- Est. flood insurance / yr
- $1,737 – $8,500
Fire risk 10/10 · Severe
- Est. fire insurance / yr
- $610 – $1,132
Heat risk 8/10 · Major
- Hot days now (above 107°F)
- 7 days/yr
- Hot days in 30 yrs
- 19 days/yr
Wind risk 1/10 · Minimal
- Chance of severe wind over 30 yrs
- —
Air-quality risk 1/10 · Minimal
- Unhealthy air days now
- 0 days/yr
- Unhealthy air days in 30 yrs
- 0 days/yr
Risk factors via First Street. Map © Google.
Why this score? — see what drove the B- grade
The composite is a weighted blend of 9 inputs, each scored 0–100. Each bar is that input's sub-score; the figure is the points it added to the 100-point composite (weight × sub-score).
- Cash flow +30.0/30.0
- 1% rule +10.0/10.0
- DSCR +10.0/10.0
- ARV discount +7.5/15.0
- Livability +3.7/5.0
- Rent growth +2.6/5.0
- Condition / age +2.5/5.0
- Schools +1.6/10.0
- Appreciation +0.0/10.0
$40,000
🖨 Deal sheet 📄 Offer letter ✓ Due diligence
Listing remarks
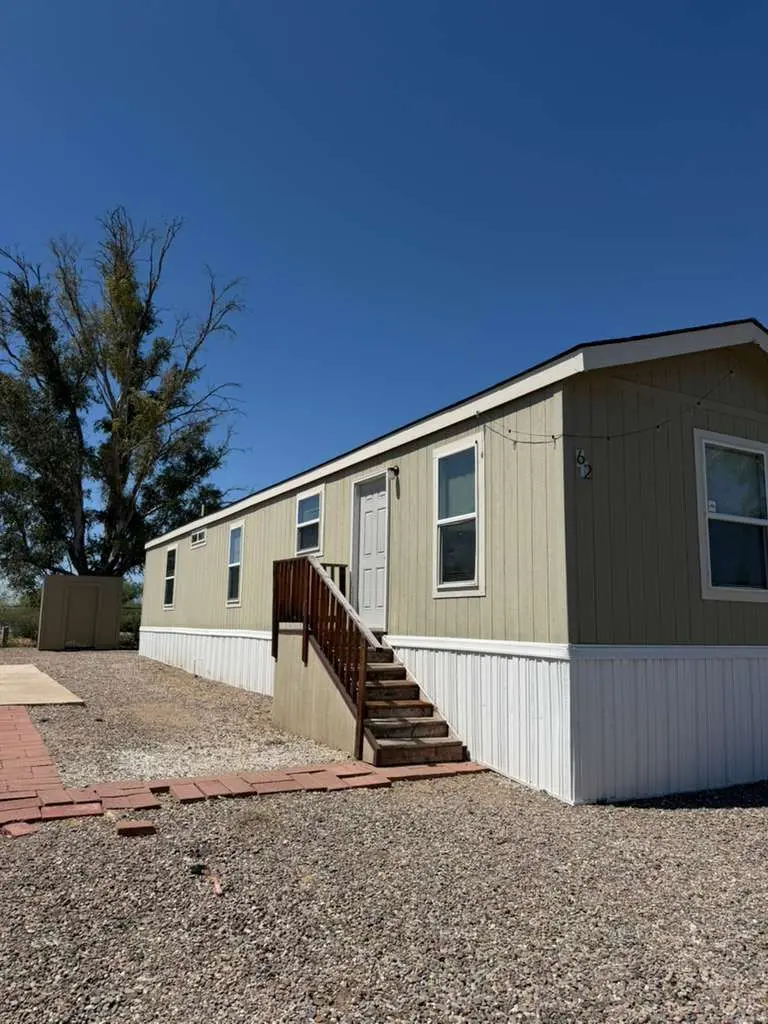
Welcome to your next home-this beautifully maintained 2017 residence offers 960 square feet of comfortable living space, thoughtfully designed with 2 bedrooms and 2 full bathrooms. Situated on a desirable corner lot, the home provides stunning mountain views from every room, creating a peaceful and scenic backdrop to everyday living. Inside, you'll find a functional layout enhanced by a convenient pantry and a full suite of appliances, including a dishwasher, range, refrigerator, and garbage disposal. Outside, the property features a carport for covered parking, awnings for added shade, and a storage shed for extra space. Located within a welcoming community, residents enjoy access to ameni
Key facts
- Pantry
- Carport
- Storage shed
Tags
Property features AI
Finance
- Other: Living area approximately 960
- Financial info: List price: $40,000
Exterior
- Utilities: Forced air heating; Central air conditioning
- Home design: Single-family property (spec plan: Verde Plaza)
- Exterior features: Shake roof
Interior
- Bedrooms: 2 bedrooms
- Bathrooms: 2 bathrooms
- Heating & cooling: Forced air heating; Central air conditioning
- Interior features: Dishwasher; Refrigerator; Disposal
Neighborhood map
What this means for you Summary
Snapshot
- This is a 2-bed/2.0-bath manufactured listed at $40k.
Deal economics
- At list price, monthly cash flow is $265 ($3k/yr) — positive.
- The deal already cash-flows at list — no discount required.
- Meets the 1% rule at list price ($1k rent vs $40k).
- Recommended offer: $39k (1.5% below list) — sets the bar for market timing.
- Cap rate 27.0% vs local median 3.7% in Tucson — top-decile yield for the area; either an underpriced asset or a hidden risk that comps aren't pricing in. Stress-test before assuming the spread holds.
Location & tenants
- Location reads 74/100 on livability (#17 in AZ, #4,502 nationally) — a middle-class / working-renter tenant base. Strengths: commute A+, cost of living A+, housing A+; Watch: health & safety C-, schools D+, crime F.
- Tucson Unified District (4403) (urban): math 14% / reading 23% proficiency, ranked #190 of 249 in AZ (top 76%) — low school quality limits family demand, transient renter base, plan for 1-2y turnover.
- Market conditions: Rents flat; 264 active listings in the ZIP; 26 comparable units currently listed for rent nearby; rentals at typical pace (median 21d on market — plan ~3-4 weeks tenant-placement turnaround); 5,268 units permitted in Pima County in 2024 (996 in 5+ unit buildings).
Forward outlook
- Local home prices are declining (-3.0%/yr); year-one equity from $277 of loan paydown is wiped out by about $1k of value loss. Plan a longer hold.
- Pima County population projected at +8% by 2050 — modest demand growth; plan on rents tracking national, not racing it.
- At projected returns (-3.0% appreciation + 0.2% rent growth), your $11k cash investment doubles in ~6 years — after that, you're playing with house money.
Negotiation context
- It's been on market 20 days — a 2% lower offer ($39k) is reasonable based on typical stale-listing flexibility.
Risks & watch-outs
- Watch-outs: flood insurance adds $427/mo.
- Climate carrying-cost: in FEMA flood zone AE (mandatory federal flood insurance); severe wildfire risk; extreme-heat days projected 7→19/yr by 2055 (HVAC capex compounding) — expect insurance premiums to compound above CPI over the hold.
Questions for the listing agent
- What's the actual annual flood-insurance premium (NFIP or private), and is the property in a SFHA with mandatory coverage?
- Is there a deadline driving the sale (1031 exchange, divorce, estate, relocation)? That informs how much negotiation room exists.
- Schools are D-rated, which usually means shorter tenancies and higher turnover. Who's the typical renter profile here, and what's been the actual vacancy rate?
- Crime grade is F in this area — have there been break-ins, vandalism, or insurance claims at this property in the last 3 years? What carrier currently insures it and at what premium?
- What's the average days-on-market for RENTAL listings here right now (not sales)? A rising rental-DOM trend means longer vacancies and softer asking-rent achievability than the comps imply.
- What's the recent tenant-quality profile in this submarket — average credit score on applications, eviction rate, late-payment / NSF rate, and stable-employment percentage? A property-management company in the area should have these aggregated.
- How much new for-sale + rental construction is in the pipeline within 1–3 miles? Heavy new supply typically softens prices + rents 12–24 months out; constrained supply supports both.
Investment metrics
- 1% rule
- 3.06% ✓
- Cap rate
- 27.05%
- Cash-on-cash
- 74.12%
- DSCR
- 4.30
- GRM
- 2.7
CMA / ARV
- ARV (on-the-fly)
- $122,880
- Comps found
- 2
Show comp detail 2 sales within ~0.75 mi
| Address | Dist | Beds/Ba | Sqft | Sold | Price | $/sf | Match |
|---|---|---|---|---|---|---|---|
| 2640 S Cottonwood Ln #40 | 0.25mi | 2/2.0 | 932 (-3%) | 7mo | $119,000 | $128 | 78 |
| 2640 S Cottonwood Ln #25 | 0.25mi | 2/1.0 | 832 (-13%) | 18mo | $85,500 | $103 | 47 |
Match score weights: distance 35% · size 25% · config 20% · recency 20%. Top-matched comps best support the ARV.
Projected returns pro-forma
-3.0% appreciation · 0.21% rent growth · sell at horizon
- IRR
- 17.3%
- Equity multiple
- 1.66×
- Total profit
- $7,347
- Equity at exit
- $5,964
- IRR
- 22.0%
- Equity multiple
- 2.46×
- Total profit
- $16,304
- Equity at exit
- $3,458
Cash invested: $11,200 (down + closing). Projections, not guarantees.
Landlord ↔ Tenant lean methodology
- Overall (STATE)
- 87 Strongly Landlord-Friendly
- State Arizona
- 87 Strongly Landlord-Friendly · R+3
- County
- — inherits STATE
- City
- — inherits STATE
ZIP-level market 85713
- Home prices YoY
- -24.5%
- Rents YoY
- 0.2%
- Active inventory
- 264
- Price-to-rent
- 2.7×
Monthly cashflow live
- Estimated rent
- $1,226 high interval (Pro) →
- Mortgage (P&I)
- −$210
- Tax est. 1.5%
- −$50 /mo · $600/yr
- Insurance
- −$17
- Flood insurance flood zone
- −$427 /mo · $5,118/yr
- HOA
- −$0
- Vacancy / Maint / Mgmt
- −$257
- Net cashflow
- $265
Break-even live
UW: 25.0% down · 7.5% · 30yr · 1.5% tax · 5.0% vac · 8.0% maint · 8.0% mgmt
Financing live
Cash to close
- Down payment
- $10,000
- Closing costs
- $1,200
- Reserves months
- —
- Total cash needed
- —
Loan-product check · same deal, 3 products live
Conventional
25% down · 7.5% · 30yr
- Down + closing
- —
- Monthly P&I
- —
- Monthly cashflow
- —
- DSCR
- —
- Eligible?
- —
Personal DTI + credit; lowest rate.
DSCR
20% down · 8.5% · 30yr
- Down + closing
- —
- Monthly P&I
- —
- Monthly cashflow
- —
- DSCR
- —
- Eligible?
- —
No personal income docs; deal must DSCR.
Hard money
10% down · 12.0% · 12mo
- Down + closing
- —
- Monthly P&I
- —
- Monthly cashflow
- —
- DSCR
- —
- Eligible?
- —
Short-term bridge; refi at stabilization.
Rent comps 26 comps
| Address | Beds | Baths | Sqft | Rent | $/sqft | DOM | Units | Dist |
|---|---|---|---|---|---|---|---|---|
| 1325 W Silverlake Rd Tucson, AZ | 2.0–3.0 | 2.0 | 990 | $1,400 | $1.41 | 11d | 2 | 0.18mi |
| 2410 S Mission Rd Tucson, AZ | 3.0 | 1.0–2.0 | 620 | $1,175 | $1.90 | 43d | 10 | 0.44mi |
| 1880 S San Antonio Dr Unit 1871SANJOSE Tucson, AZ | 2.0 | 1.0 | 850 | $1,050 | $1.24 | 3d | 1 | 0.49mi |
| 1880 S San Antonio Dr Unit 1851SANJOSE Tucson, AZ | 2.0 | 1.0 | 850 | $1,095 | $1.29 | 21d | 1 | 0.49mi |
| 1880 S San Antonio Dr Tucson, AZ | 2.0 | 1.0 | 850 | $1,095 | $1.29 | 23d | 2 | 0.49mi |
| 2800 S Mission Rd Tucson, AZ | 3.0 | 1.0–2.0 | 663 | $1,252 | $1.89 | 1d | 23 | 0.62mi |
| 1975 W 36th St Tucson, AZ | 1.0–2.0 | 1.0 | 667 | $1,284 | $1.92 | 3d | 1 | 0.93mi |
| 673 W 41st St #1 Tucson, AZ | 2.0 | 1.0 | 700 | $1,000 | $1.43 | 23d | 1 | 0.94mi |
| 1240 W Ajo Way Tucson, AZ | 2.0 | 1.0 | 530 | $850 | $1.60 | 3d | 7 | 1.14mi |
| 1502 W Ajo Way Tucson, AZ | 1.0–2.0 | 1.0 | 713 | $844 | $1.18 | 3d | 4 | 1.16mi |
| 238 W 33rd St Unit D Tucson, AZ | 1.0 | 1.0 | 550 | $695 | $1.26 | 43d | 1 | 1.20mi |
| 3601 S 16th Ave Tucson, AZ | 2.0 | 1.0 | 523 | $1,025 | $1.96 | 43d | 1 | 1.20mi |
| 416 W 44th St Unit 1 Tucson, AZ | 1.0 | 1.0 | 780 | $900 | $1.15 | 23d | 1 | 1.21mi |
| 3420 S Clark Ave Tucson, AZ | 3.0 | 2.0 | 1100 | $1,495 | $1.36 | 11d | 1 | 1.23mi |
| 3511 S 12th Ave Unit 1101 Tucson, AZ | 2.0 | 1.0 | 752 | $950 | $1.26 | 43d | 1 | 1.26mi |
| 3619 S 14th Ave Tucson, AZ | 2.0 | 1.0 | 869 | $1,410 | $1.62 | 43d | 1 | 1.27mi |
| 251 W 38th St Tucson, AZ | 3.0 | 2.0 | 1050 | $1,700 | $1.62 | 44d | 1 | 1.29mi |
| 251 W 38th St Tucson, AZ | 3.0 | 2.0 | 1050 | $1,800 | $1.71 | 14d | 1 | 1.29mi |
| 3450 S Liberty Ave Unit 2 Tucson, AZ | 3.0 | 2.0 | 950 | $1,475 | $1.55 | 43d | 1 | 1.35mi |
| 205 W 25th St Tucson, AZ | 2.0 | 1.0 | 800 | $1,350 | $1.69 | 43d | 1 | 1.36mi |
| 39 W 30th St Unit B Tucson, AZ | 2.0 | 1.0 | 820 | $874 | $1.07 | 17d | 1 | 1.39mi |
| 39 W 30th St Unit B Tucson, AZ | 2.0 | 1.0 | 820 | $874 | $1.07 | 43d | 1 | 1.39mi |
| 1213 S 9th Ave Tucson, AZ | 2.0 | 1.0 | 800 | $1,200 | $1.50 | 3d | 1 | 1.41mi |
| 2411 S 6th Ave Unit 8 Tucson, AZ | 2.0 | 1.0 | 700 | $845 | $1.21 | 21d | 1 | 1.45mi |
| 2411 S 6th Ave Unit 15 Tucson, AZ | 2.0 | 1.0 | 850 | $905 | $1.06 | 21d | 1 | 1.46mi |
| 2411 S 6th Ave Unit 16 Tucson, AZ | 2.0 | 1.0 | 850 | $1,025 | $1.21 | 21d | 1 | 1.46mi |
Listing history 14 events
-
2026-06-18days on market $40,000 Active 20 DOM
-
2026-06-17days on market $40,000 Active 19 DOM
-
2026-06-16days on market $40,000 Active 18 DOM
-
2026-06-15days on market $40,000 Active 17 DOM
-
2026-06-13days on market $40,000 Active 15 DOM
-
2026-06-10days on market $40,000 Active 12 DOM
-
2026-06-09days on market $40,000 Active 11 DOM
-
2026-06-08days on market $40,000 Active 10 DOM
-
2026-06-07days on market $40,000 Active 9 DOM
-
2026-06-05days on market $40,000 Active 6 DOM
-
2026-06-03days on market $40,000 Active 5 DOM
-
2026-06-02days on market $40,000 Active 4 DOM
-
2026-06-01days on market $40,000 Active 3 DOM
-
2026-05-31days on market $40,000 Active 2 DOM
ⓘ Source: listings_history table (triggers on properties + properties_extension) + one-shot
backfill from property_details.listing_events for pre-trigger history.
Climate risk First Street
- Flood 4/10 Moderate FEMA zone AE · 20% chance over 30 yrs
- Wildfire 10/10 Extreme
- Heat 8/10 Severe 7 d/yr ≥107°F today · 19 d/yr by 30 yrs out
- Wind 1/10 Low
- Air quality 1/10 Low 0 unhealthy d/yr today · 0 by 30 yrs out
Nearby sold comps map
Loading sold comps map…
Walkable amenities ~0.75 mi
Loading nearby amenities…
Taxation est. · year 1
- Rental income
- $14,708
- − Mortgage interest
- −$2,241
- − Property taxes
- −$600
- − Insurance
- −$5,318
- − Repairs & maintenance
- −$1,177
- − Management
- −$1,177
- − Depreciation
- −$1,164
- Taxable income
- $3,032
- Est. tax owed @ 24.0%
- −$728
- After-tax cash flow
- $2,456/yr
For passive investors: Depreciation is non-cash, so a rental often shows a tax loss while cash-flowing — sheltering income. Rental losses are passive: they offset passive income freely, and up to $25,000/yr can offset ordinary (W-2) income if you actively participate and your MAGI is under $100k (phasing out to $0 by $150k); unused losses carry forward. On sale, claimed depreciation is recaptured at up to 25%, and gains may owe capital-gains tax (a 1031 exchange can defer both). Figures are a year-1 estimate at your 24.0% rate — not tax advice; consult a CPA.
Schools (NCES district)
- District
- Tucson Unified District (4403)
- NCES district ID
- 0408800
- Math proficiency
- 14% ▼ -17.00%
- Reading proficiency
- 23% ▼ -11.00%
- Median HH income
- $40,962
- Composite
- 15.78/100
- National rank
- #9270
- State rank
- #190 of 249 in AZ
Livability — Tucson
- Score
- 74/100
- State rank
- #17
- US rank
- #4502
Category grades
Schools grade is shown separately in the Schools card above.
Census & demographics
- Census place
- Tucson, AZ
- County
- Pima County · 1,012,107 people
- City population
- 839,336
- Metro
- Tucson, AZ
- Population (ZIP)
- 46,439
- Household income
- $53,152
- Rent vs Own
- Severe rent burden
- 1517.0
Population outlook (Pima County) Hauer SSP2
- Today (2025)
- 1,066,056 people
- By 2030
- 1,086,684 · +1.9%
- By 2040
- 1,117,160 · +4.8%
- By 2050
- 1,149,778 · +7.9%
- By 2075
- 1,271,480 · +19.3%
- By 2100
- 1,321,160 · +23.9%
Race, ethnicity, and origin ACS 2023
- Neighborhood character
- Predominantly Hispanic (70%)
- Race & ethnicity
- Hispanic / Latino 70% Two or more races 30% White 21% Native American 5% Black 3% Asian 1%
- Hispanic origin (detail)
- Mexican 67%
- Common ancestry
- Italian 1% Lithuanian 1% Portuguese 1%
- Foreign-born
- 19% · Canada, China
- Languages at home
- 49% English-only · Spanish 49%
Political lean MEDSL · Pima
- 2024 margin
- D (+15.2) · D 57.0% · R 41.8% · Other 1.2%
- 2008→2024 swing
- +9.1pp toward D · 2008: 6.1pp · 2024: 15.2pp
- All cycles
- 2024: D+15.2 2020: D+18.7 2016: D+13.5 2012: D+5.8 2008: D+6.1
Not yet ingested
- Civics
- —
Market trends
- HPI YoY
- ▼ -107.07%
- Current HPI
- 329.8338
- Rent YoY
- ▲ 0.21%
- Metro
- Tucson, AZ
- State GDP YoY
- ▲ 4.54%
- F500 in state
- 20
Industry mix (Fortune 500 HQ in AZ)
| Industry | F500 HQs | Revenue |
|---|---|---|
| Technology | 2 | $13B |
|
||
| Mining / Metals | 1 | $23B |
|
||
| Environmental Services | 1 | $16B |
|
||
| Metals / Steel | 1 | $14B |
|
||
| Technology Distribution | 1 | $9B |
|
||
| Homebuilding | 1 | $8B |
|
||
Cash-flow waterfall
monthlySold comps — $/sqft
last 12 mo · ≤1 miLoading sold comps…