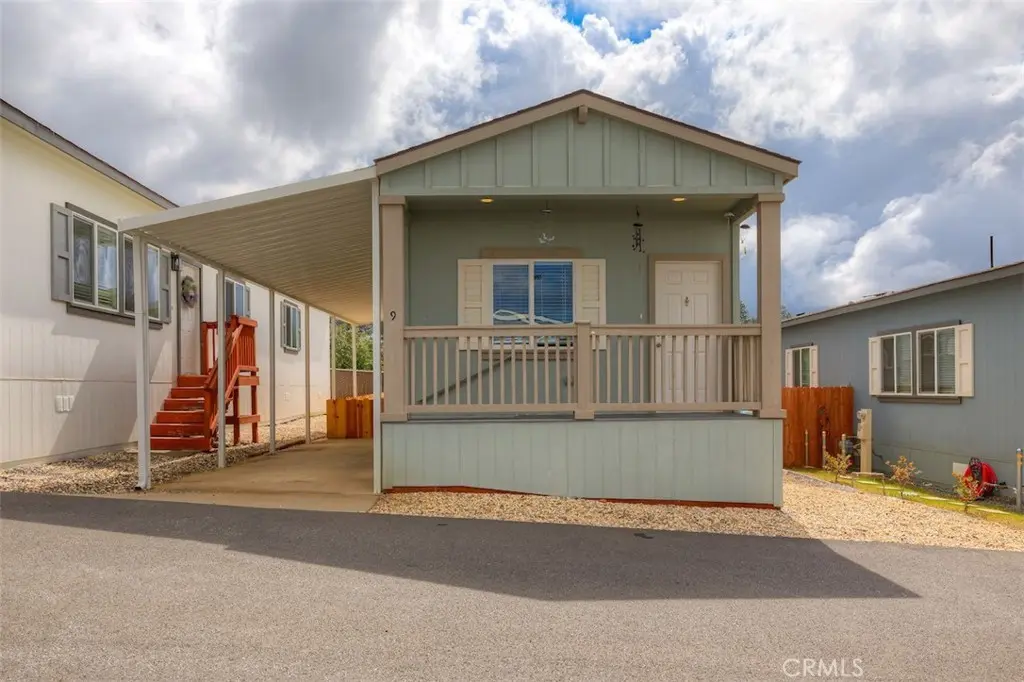
1354 Elliott Rd #9 · Paradise, CA
Flood risk 1/10 · Minimal
- FEMA flood zone
- X (unshaded)
- Chance of flooding over 30 yrs
- 0.0%
- Est. flood insurance / yr
- $507 – $1,088
Fire risk 7/10 · Major
- Est. fire insurance / yr
- $659 – $1,223
Heat risk 5/10 · Moderate
- Hot days now (above 100°F)
- 7 days/yr
- Hot days in 30 yrs
- 18 days/yr
Wind risk 1/10 · Minimal
- Chance of severe wind over 30 yrs
- —
Air-quality risk 10/10 · Severe
- Unhealthy air days now
- 37 days/yr
- Unhealthy air days in 30 yrs
- 42 days/yr
Risk factors via First Street. Map © Google.
Why this score? — see what drove the B grade
The composite is a weighted blend of 9 inputs, each scored 0–100. Each bar is that input's sub-score; the figure is the points it added to the 100-point composite (weight × sub-score).
- Cash flow +30.0/30.0
- DSCR +10.0/10.0
- 1% rule +9.9/10.0
- ARV discount +7.5/15.0
- Schools +5.0/10.0
- Rent growth +4.1/5.0
- Livability +3.1/5.0
- Condition / age +2.5/5.0
- Appreciation +0.0/10.0
$80,000
🖨 Deal sheet 📄 Offer letter ✓ Due diligence
Listing remarks
Welcome to this well-maintained 2-bedroom, 2-bathroom manufactured home located in a desirable all-age park, offering comfort, convenience, and easy living. With approximately 900 square feet of thoughtfully designed living space, this home is move-in ready and perfect for a variety of lifestyles. Step inside to discover a bright and inviting open-concept floor plan where the living, dining, and kitchen areas flow seamlessly together, creating a welcoming atmosphere for both everyday living and entertaining. Natural light fills the home, enhancing the warm and comfortable feel throughout. The kitchen is both functional and stylish, featuring modern appliances, ample cabinetry, and a gas sto
Key facts
- Modern appliances
- Gas stove
- Private retreat
Tags
Property features AI
Finance
- Other: Manager approval required for sale/rental
- Financial info: Land lease: $650 monthly (park)
- HOA & community: Park name: Paradise Mobile Estates; Onsite property management; Pet rules (contact manager for approval); Community features: Foothills
Exterior
- Parking: Attached carport with 2 covered carport spaces; 2 uncovered parking spaces (4 total)
- Utilities: Natural gas connected; Electricity connected; Water connected (District/Public); Sewer connected (community septic)
- Home design: Single (mobile) home — Fairpoint model; One story; Turnkey condition; Mobile home remains
- Construction: Year built (from public records)
- Exterior features: Front porch; Open patio; Awning; Rain gutters; Wood fencing
Interior
- Kitchen: Kitchen open to family room; Garbage disposal; Microwave; Refrigerator; Gas range; Freezer; Dishwasher; Gas water heater
- Bedrooms: Main floor bedrooms
- Bathrooms: Two full bathrooms; Main floor full bath; Walk-in shower; Shower in tub; Bathtub; Vanity area
- Heating & cooling: Central cooling; Central furnace heating
- Interior features: Ceiling fan; Blinds; One level (single story); Main floor primary bedroom; All bedrooms on main level
- Laundry & utility: Washer hookup; Electric dryer hookup (220V in laundry); Laundry located in closet
Neighborhood map
What this means for you Summary
Snapshot
- This is a 2-bed/2.0-bath manufactured listed at $80k.
Deal economics
- At list price, monthly cash flow is $445 ($5k/yr) — positive.
- The deal already cash-flows at list — no discount required.
- Meets the 1% rule at list price ($1k rent vs $80k).
- Recommended offer: $79k (1.5% below list) — sets the bar for market timing.
- Cap rate 13.0% vs local median 2.6% in Paradise — top-decile yield for the area; either an underpriced asset or a hidden risk that comps aren't pricing in. Stress-test before assuming the spread holds.
Location & tenants
- Location reads 61/100 on livability (#541 in CA) — a middle-class / working-renter tenant base. Strengths: schools A-, housing B+, crime B; Watch: employment C-, amenities F, commute F.
- Market conditions: Rents rising fast (+6.4%/yr); 481 active listings in the ZIP; 6 comparable units currently listed for rent nearby; rentals at typical pace (median 22d on market — plan ~3-4 weeks tenant-placement turnaround); 946 units permitted in Butte County in 2024 (254 in 5+ unit buildings).
Forward outlook
- Local home prices are declining (-3.0%/yr); year-one equity from $553 of loan paydown is wiped out by about $2k of value loss. Plan a longer hold.
- Butte County population projected at +10% by 2050 — modest demand growth; plan on rents tracking national, not racing it.
- At projected returns (-3.0% appreciation + 6.4% rent growth), your $22k cash investment doubles in ~5 years — after that, you're playing with house money.
Negotiation context
- It's been on market 21 days — a 2% lower offer ($79k) is reasonable based on typical stale-listing flexibility.
- 2 sale attempts with the ask held roughly flat each time — persistent listings suggest the price (not the market) is what's stuck; bring a comps-based counter.
Risks & watch-outs
- Climate carrying-cost: major wildfire risk; extreme-heat days projected 7→18/yr by 2055 (HVAC capex compounding) — expect insurance premiums to compound above CPI over the hold.
Questions for the listing agent
- Is there a deadline driving the sale (1031 exchange, divorce, estate, relocation)? That informs how much negotiation room exists.
- Schools are A-rated — typically a magnet for longer-tenancy family renters. What's the average tenant stay here, and is there a school-zone premium baked into asking?
- What's the average days-on-market for RENTAL listings here right now (not sales)? A rising rental-DOM trend means longer vacancies and softer asking-rent achievability than the comps imply.
- What's the recent tenant-quality profile in this submarket — average credit score on applications, eviction rate, late-payment / NSF rate, and stable-employment percentage? A property-management company in the area should have these aggregated.
- How much new for-sale + rental construction is in the pipeline within 1–3 miles? Heavy new supply typically softens prices + rents 12–24 months out; constrained supply supports both.
Investment metrics
- 1% rule
- 1.49% ✓
- Cap rate
- 12.97%
- Cash-on-cash
- 23.83%
- DSCR
- 2.06
- GRM
- 5.6
CMA / ARV
- ARV (on-the-fly)
- $206,100
- Comps found
- 4
Show comp detail 4 sales within ~0.75 mi
| Address | Dist | Beds/Ba | Sqft | Sold | Price | $/sf | Match |
|---|---|---|---|---|---|---|---|
| 1432 Gordon | 0.23mi | 2/2.0 | 960 (+7%) | 2mo | $220,000 | $229 | 76 |
| 1348 Elliott #8 | 0.05mi | 2/1.0 | 840 (-7%) | 9mo | $79,000 | $94 | 75 |
| 1348 Elliott #2 | 0.00mi | 2/1.0 | 780 (-13%) | 2mo | $97,990 | $126 | 72 |
| 5583 Angel Dr | 0.58mi | 2/2.0 | 876 (-3%) | 8mo | $205,000 | $234 | 62 |
Match score weights: distance 35% · size 25% · config 20% · recency 20%. Top-matched comps best support the ARV.
Projected returns pro-forma
-3.0% appreciation · 6.37% rent growth · sell at horizon
- IRR
- 20.5%
- Equity multiple
- 1.87×
- Total profit
- $19,528
- Equity at exit
- $11,928
- IRR
- 30.8%
- Equity multiple
- 4.20×
- Total profit
- $71,771
- Equity at exit
- $6,917
Cash invested: $22,400 (down + closing). Projections, not guarantees.
Landlord ↔ Tenant lean methodology
- Overall (STATE)
- 18 Strongly Tenant-Friendly
- State California
- 18 Strongly Tenant-Friendly · D+13
- County
- — inherits STATE
- City
- — inherits STATE
ZIP-level market 95969
- Rents YoY
- 6.4%
- Active inventory
- 481
- Price-to-rent
- 5.6×
Monthly cashflow live
- Estimated rent
- $1,190 high interval (Pro) →
- Mortgage (P&I)
- −$420
- Tax from tax record
- −$43 /mo · $510/yr
- Insurance
- −$33
- HOA
- −$0
- Vacancy / Maint / Mgmt
- −$250
- Net cashflow
- $445
Break-even live
UW: 25.0% down · 7.5% · 30yr · 1.5% tax · 5.0% vac · 8.0% maint · 8.0% mgmt
Financing live
Cash to close
- Down payment
- $20,000
- Closing costs
- $2,400
- Reserves months
- —
- Total cash needed
- —
Loan-product check · same deal, 3 products live
Conventional
25% down · 7.5% · 30yr
- Down + closing
- —
- Monthly P&I
- —
- Monthly cashflow
- —
- DSCR
- —
- Eligible?
- —
Personal DTI + credit; lowest rate.
DSCR
20% down · 8.5% · 30yr
- Down + closing
- —
- Monthly P&I
- —
- Monthly cashflow
- —
- DSCR
- —
- Eligible?
- —
No personal income docs; deal must DSCR.
Hard money
10% down · 12.0% · 12mo
- Down + closing
- —
- Monthly P&I
- —
- Monthly cashflow
- —
- DSCR
- —
- Eligible?
- —
Short-term bridge; refi at stabilization.
Rent comps 6 comps
| Address | Beds | Baths | Sqft | Rent | $/sqft | DOM | Units | Dist |
|---|---|---|---|---|---|---|---|---|
| 1561 Kay Ct Paradise, CA | 2.0 | 1.0 | 892 | $898 | $1.01 | 13d | 1 | 0.60mi |
| 1561 Kay Ct Unit D Paradise, CA | 2.0 | 1.0 | 892 | $898 | $1.01 | 21d | 1 | 0.60mi |
| 1090 Shadowbrook Way Paradise, CA | 1.0 | 1.0 | 640 | $1,150 | $1.80 | 13d | 2 | 0.73mi |
| 443 Nunneley Rd Apt D Paradise, CA | 1.0 | 1.0 | 560 | $1,250 | $2.23 | 44d | 1 | 1.16mi |
| 6377 Oak Way Unit B Paradise, CA | 1.0 | 1.0 | 551 | $1,295 | $2.35 | 13d | 1 | 1.28mi |
| 5848 Black Olive Dr Unit 758 Willow A Paradise, CA | 1.0 | 1.0 | 711 | $1,325 | $1.86 | 44d | 1 | 1.38mi |
Listing history 18 events
-
2026-06-19days on market $80,000 Active 21 DOM
-
2026-06-18days on market $80,000 Active 20 DOM
-
2026-06-17days on market $80,000 Active 19 DOM
-
2026-06-16days on market $80,000 Active 18 DOM
-
2026-06-15days on market $80,000 Active 17 DOM
-
2026-06-14days on market $80,000 Active 15 DOM
-
2026-06-13days on market $80,000 Active 14 DOM
-
2026-06-10days on market $80,000 Active 12 DOM
-
2026-06-09days on market $80,000 Active 11 DOM
-
2026-06-08days on market $80,000 Active 10 DOM
-
2026-06-07days on market $80,000 Active 9 DOM
-
2026-06-05days on market $80,000 Active 6 DOM
-
2026-06-03days on market $80,000 Active 5 DOM
-
2026-06-02days on market $80,000 Active 4 DOM
-
2026-06-01days on market $80,000 Active 3 DOM
-
2026-05-31days on market $80,000 Active 2 DOM
-
2026-05-30remarks 699-char remark
-
2026-05-30$80,000 Active 1 DOM
ⓘ Source: listings_history table (triggers on properties + properties_extension) + one-shot
backfill from property_details.listing_events for pre-trigger history.
Tax reassessment forecast CA · Resets to sale price
- Current annual tax
- $510 · $43/mo
- Projected year-2 tax
- $608 · $51/mo
- Expected delta
- +$98/yr (+$8/mo · 19.2%)
ⓘ Screening estimate from a state-policy table — verify with the county assessor before closing.
Climate risk First Street
- Flood 1/10 Low FEMA zone X (unshaded) · 0% chance over 30 yrs
- Wildfire 7/10 Severe
- Heat 5/10 Major 7 d/yr ≥100°F today · 18 d/yr by 30 yrs out
- Wind 1/10 Low
- Air quality 10/10 Extreme 37 unhealthy d/yr today · 42 by 30 yrs out
Nearby sold comps map
Loading sold comps map…
Walkable amenities ~0.75 mi
Loading nearby amenities…
Taxation est. · year 1
- Rental income
- $14,283
- − Mortgage interest
- −$4,481
- − Property taxes
- −$510
- − Insurance
- −$400
- − Repairs & maintenance
- −$1,143
- − Management
- −$1,143
- − Depreciation
- −$2,327
- Taxable income
- $4,279
- Est. tax owed @ 24.0%
- −$1,027
- After-tax cash flow
- $4,312/yr
For passive investors: Depreciation is non-cash, so a rental often shows a tax loss while cash-flowing — sheltering income. Rental losses are passive: they offset passive income freely, and up to $25,000/yr can offset ordinary (W-2) income if you actively participate and your MAGI is under $100k (phasing out to $0 by $150k); unused losses carry forward. On sale, claimed depreciation is recaptured at up to 25%, and gains may owe capital-gains tax (a 1031 exchange can defer both). Figures are a year-1 estimate at your 24.0% rate — not tax advice; consult a CPA.
Schools (NCES district)
No district data.
Livability — Paradise
- Score
- 61/100
- State rank
- #541
- US rank
- #18039
Category grades
Schools grade is shown separately in the Schools card above.
Census & demographics
- Census place
- Paradise, CA
- County
- Butte County · 175,030 people
- City population
- 8,339
- Metro
- Chico, CA
- Population (ZIP)
- 8,339
- Household income
- $69,067
- Rent vs Own
- Severe rent burden
- 218.0
Population outlook (Butte County) Hauer SSP2
- Today (2025)
- 237,527 people
- By 2030
- 243,804 · +2.6%
- By 2040
- 253,899 · +6.9%
- By 2050
- 262,561 · +10.5%
- By 2075
- 283,709 · +19.4%
- By 2100
- 282,689 · +19.0%
Race, ethnicity, and origin ACS 2023
- Neighborhood character
- Predominantly White (82%)
- Race & ethnicity
- White 82% Two or more races 11% Hispanic / Latino 8% Asian 2% Native American 1%
- Hispanic origin (detail)
- Mexican 7%
- Common ancestry
- Iranian 7% Lithuanian 4% Italian 2%
- Foreign-born
- 3% · Canada, China
- Languages at home
- 94% English-only · Spanish 4% Chinese 1%
Political lean MEDSL · Butte
- 2024 margin
- Toss-up / Even · D 46.8% · R 49.9% · Other 3.3%
- 2008→2024 swing
- -5.5pp toward R · 2008: 2.4pp · 2024: -3.1pp
- All cycles
- 2024: R+3.1 2020: D+1.7 2016: R+4.0 2012: R+3.9 2008: D+2.4
Not yet ingested
- Civics
- —
Market trends
- HPI YoY
- ▼ -410.40%
- Current HPI
- 102.8367
- Rent YoY
- ▲ 6.37%
- Metro
- Chico, CA
- State GDP YoY
- ▲ 3.21%
- F500 in state
- 116
Industry mix (Fortune 500 HQ in CA)
| Industry | F500 HQs | Revenue |
|---|---|---|
| Technology | 27 | $1,492B |
|
||
| Financial Services | 3 | $174B |
|
||
| Retail | 3 | $44B |
|
||
| Insurance | 3 | $26B |
|
||
| Media / Entertainment | 2 | $115B |
|
||
| Pharmaceuticals / Biotech | 2 | $62B |
|
||
Price history
-23.8% since first listed3 events — show timeline
- 2026-05-29 Listed $80,000 CRMLS
- 2025-09-05 Pending — CRMLS
- 2025-05-15 Listed $104,990 CRMLS
Property tax history
+6.1%/yrLatest (2018): $510 · -0.5% YoY. Source: county tax records.
Cash-flow waterfall
monthlySold comps — $/sqft
last 12 mo · ≤1 miLoading sold comps…