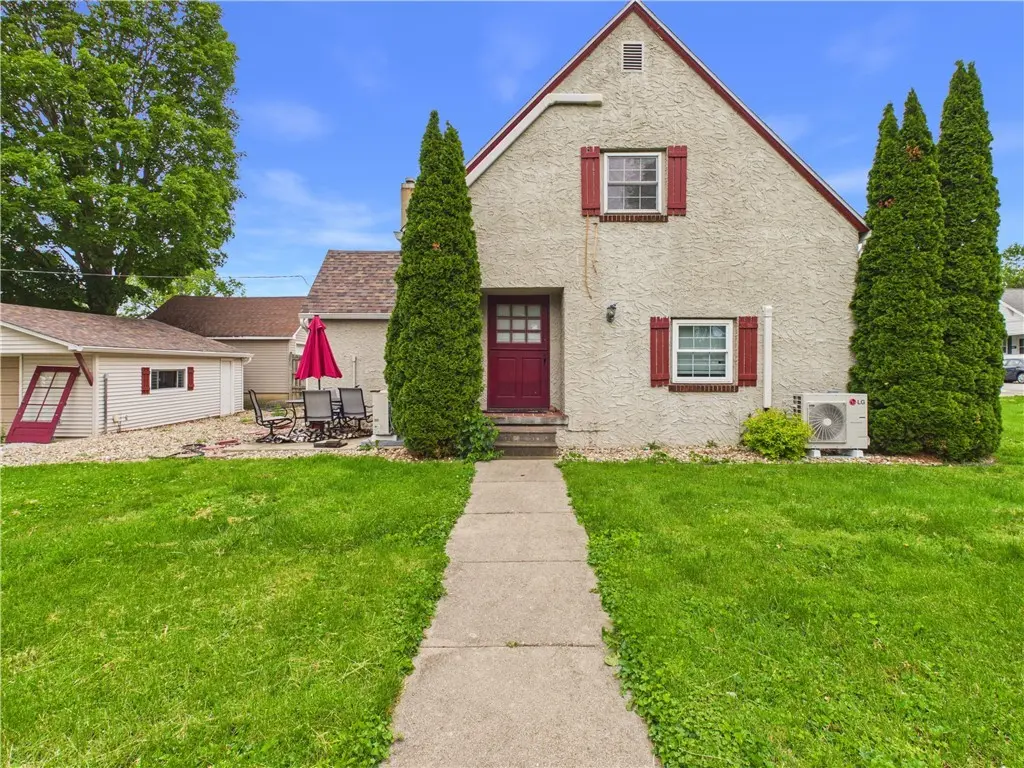
203 Dole St · Paris, IL
Flood risk 1/10 · Minimal
- FEMA flood zone
- X (unshaded)
- Chance of flooding over 30 yrs
- 0.0%
- Est. flood insurance / yr
- $473 – $860
Fire risk 1/10 · Minimal
- Est. fire insurance / yr
- $804 – $1,492
Heat risk 4/10 · Minor
- Hot days now (above 105°F)
- 7 days/yr
- Hot days in 30 yrs
- 19 days/yr
Wind risk 2/10 · Minimal
- Chance of severe wind over 30 yrs
- 1.0%
Air-quality risk 4/10 · Minor
- Unhealthy air days now
- 3 days/yr
- Unhealthy air days in 30 yrs
- 5 days/yr
Risk factors via First Street. Map © Google.
Why this score? — see what drove the D- grade
The composite is a weighted blend of 9 inputs, each scored 0–100. Each bar is that input's sub-score; the figure is the points it added to the 100-point composite (weight × sub-score).
- Cash flow +15.7/30.0
- DSCR +4.9/10.0
- 1% rule +4.5/10.0
- Livability +3.6/5.0
- Schools +2.8/10.0
- Rent growth +2.5/5.0
- Condition / age +2.5/5.0
- ARV discount +0.0/15.0
- Appreciation +0.0/10.0
$124,900
🖨 Deal sheet (PDF) 📄 Offer letter ✓ Due diligence
Listing remarks MLS
*** This home sits on a quiet street located on a corner lot. There are wood and beamed ceilings int the eat in kitchen and living room. This home has had numerous updates all done for you. Per owner in recent years, new windows, new roof on house, carport and detatched garage, new furnace and hot water heater, insulation in attic, newer flooring, walls painted. House, trim and shutters recently painted. Newer privacy fence and a deck. Updated baths and new counter tops in the kitchen. There is nothing to do but move in and start enjoying all this home has to offer. Call soon or this one will be gone!!!!
Key facts
- Attached carport
- Spacious corner lot
- Detached garage
Tags
Property features AI
Exterior
- Parking: Detached garage (2 spaces)
- Utilities: Public water; Public sewer; Electric water heater
- Home design: Single family residence; Two levels (2 stories)
- Construction: Built with other construction materials; Slab foundation
- Exterior features: Shingle roof; Gravel road access; Lot approximately 0.28 acres; Residential zoning
Interior
- Kitchen: Oven; Refrigerator; Electric water heater
- Bathrooms: 1 full bathroom; 1 half bathroom
- Heating & cooling: Ductless cooling; Ductless heating; Hot water heating
- Interior features: Fireplace (1)
- Laundry & utility: Washer; Dryer; Laundry on main level
Neighborhood map
What this means for you Summary
Snapshot
- This is a 3-bed/1.5-bath single-family listed at $125k.
Deal economics
- At list price, monthly cash flow is $56 ($672/yr) — positive.
- The deal already cash-flows at list — no discount required.
- To meet the 1% rule (rent ≥ 1% of price), the offer needs to be $118k (5.4% below list).
- Recommended offer: $118k (5.4% below list) — sets the bar for 1% rule.
Location & tenants
- Location reads 71/100 on livability (#342 in IL) — a middle-class / working-renter tenant base. Strengths: cost of living A+, housing A+, health & safety A+; Watch: employment D, crime F, amenities F.
- Paris-Union SD 95 (town): math 25% / reading 42% proficiency, ranked #227 of 620 in IL (top 37%) — families likely to look elsewhere, expect single-tenant / working-renter base with shorter leases.
- Zoned schools: Memorial Elementary School (286 students, 0% FRL); Mayo Middle School (math 30% / reading 54%, grade D-, #116 of 665 statewide, top 19%, 250 students, 0% FRL); Paris Cooperative High School 95 (math 8% / reading 22%, grade F, #473 of 693 statewide, top 69%, 367 students, 0% FRL) — zoned schools average 0% FRL vs 53% district-wide (53 pts lower); this property's tenant base skews higher-income than the district average.
- Market conditions: 83 active listings in the ZIP; 6 units permitted in Edgar County in 2024 (0 in 5+ unit buildings).
Forward outlook
- Local home prices are declining (-3.0%/yr); year-one equity from $864 of loan paydown is wiped out by about $4k of value loss. Plan a longer hold.
- Edgar County population projected at -30% by 2050 — secular population decline; favor cash flow + early exit over multi-decade hold.
Negotiation context
- Only 3 days on market — expect competitive offers; lowballing is unlikely to land.
- 2 sale attempts since 15y ago with the ask held roughly flat each time — persistent listings suggest the price (not the market) is what's stuck; bring a comps-based counter.
- Current owner paid $90k; 39% above their basis — modest negotiation headroom, anchor on the comps not their cost.
Questions for the listing agent
- Built in 1960 — when were the roof, HVAC, electrical panel, plumbing, and water heater last replaced?
- Is there a deadline driving the sale (1031 exchange, divorce, estate, relocation)? That informs how much negotiation room exists.
- Crime grade is F in this area — have there been break-ins, vandalism, or insurance claims at this property in the last 3 years? What carrier currently insures it and at what premium?
- The area grade is low — what's the realistic commute time and amenity access for the typical tenant pool here? Any planned neighborhood developments (good or bad) we should know about?
- What's the average days-on-market for RENTAL listings here right now (not sales)? A rising rental-DOM trend means longer vacancies and softer asking-rent achievability than the comps imply.
- What's the recent tenant-quality profile in this submarket — average credit score on applications, eviction rate, late-payment / NSF rate, and stable-employment percentage? A property-management company in the area should have these aggregated.
- How much new for-sale + rental construction is in the pipeline within 1–3 miles? Heavy new supply typically softens prices + rents 12–24 months out; constrained supply supports both.
Investment metrics
- 1% rule
- 0.95% ✗
- Cap rate
- 6.83%
- Cash-on-cash
- 1.92%
- DSCR
- 1.09
- GRM
- 8.8
CMA / ARV
- ARV (on-the-fly)
- $105,525
- Comps found
- 9
Show comp detail 9 sales within ~0.75 mi
| Address | Dist | Beds/Ba | Sqft | Sold | Price | $/sf | Match |
|---|---|---|---|---|---|---|---|
| 16 Poplar Dr | 0.69mi | 3/1.5 | 1,536 (-2%) | 0mo | $140,000 | $91 | 64 |
| 126 Blackburn St | 0.22mi | 3/1.5 | 1,464 (-7%) | 18mo | $93,000 | $64 | 63 |
| 719 Connelly St | 0.27mi | 3/1.0 | 1,346 (-14%) | 1mo | $115,000 | $85 | 60 |
| 702 N Main St | 0.36mi | 3/1.0 | 1,406 (-11%) | 8mo | $94,500 | $67 | 57 |
| 312 Parrish St | 0.48mi | 3/1.0 | 1,399 (-11%) | 14mo | $70,000 | $50 | 45 |
| 720 N High St | 0.48mi | 3/1.5 | 1,392 (-12%) | 19mo | $92,500 | $66 | 42 |
| 722 E Blackburn St | 0.72mi | 3/1.5 | 1,764 (+12%) | 7mo | $145,000 | $82 | 41 |
| 5 Curry Dr | 0.72mi | 3/1.5 | 1,450 (-8%) | 16mo | $140,000 | $97 | 40 |
| 414 N Central Ave | 0.65mi | 2/1.0 (-1) | 1,438 (-9%) | 11mo | $70,000 | $49 | 39 |
Match score weights: distance 35% · size 25% · config 20% · recency 20%. Top-matched comps best support the ARV.
Projected returns pro-forma
-3.0% appreciation · 3.0% rent growth · sell at horizon
- IRR
- -13.2%
- Equity multiple
- 0.52×
- Total profit
- $-16,646
- Equity at exit
- $18,623
- IRR
- -4.2%
- Equity multiple
- 0.72×
- Total profit
- $-9,794
- Equity at exit
- $10,799
Cash invested: $34,972 (down + closing). Projections, not guarantees.
Landlord ↔ Tenant lean methodology
- Overall (STATE)
- 43 Moderately Tenant-Leaning
- State Illinois
- 43 Moderately Tenant-Leaning · D+7
- County
- — inherits STATE
- City
- — inherits STATE
ZIP-level market 61944
- Active inventory
- 83
- Price-to-rent
- 8.8×
Monthly cashflow live
- Estimated rent
- $1,182 medium interval (Pro) →
- Mortgage (P&I)
- −$655
- Tax from tax record
- −$171 /mo · $2,048/yr
- Insurance
- −$52
- HOA
- −$0
- Vacancy / Maint / Mgmt
- −$248
- Net cashflow
- $56
Break-even live
Sensitivity live
| Price | -10% $127 | -5% $91 | +0% $56 | +5% $21 | +10% $-15 |
|---|---|---|---|---|---|
| Rent | -10% $-37 | -5% $9 | +0% $56 | +5% $103 | +10% $149 |
| Rate | -1.0pp $119 | -0.5pp $88 | base $56 | +0.5pp $24 | +1.0pp $-9 |
UW: 25.0% down · 7.5% · 30yr · 1.5% tax · 5.0% vac · 8.0% maint · 8.0% mgmt
Financing live
Cash to close
- Down payment
- $31,225
- Closing costs
- $3,747
- Reserves months
- —
- Total cash needed
- —
Loan-product check · same deal, 3 products live
Conventional
25% down · 7.5% · 30yr
- Down + closing
- —
- Monthly P&I
- —
- Monthly cashflow
- —
- DSCR
- —
- Eligible?
- —
Personal DTI + credit; lowest rate.
DSCR
20% down · 8.5% · 30yr
- Down + closing
- —
- Monthly P&I
- —
- Monthly cashflow
- —
- DSCR
- —
- Eligible?
- —
No personal income docs; deal must DSCR.
Hard money
10% down · 12.0% · 12mo
- Down + closing
- —
- Monthly P&I
- —
- Monthly cashflow
- —
- DSCR
- —
- Eligible?
- —
Short-term bridge; refi at stabilization.
Listing history 3 events
-
2026-06-07statusdays on market $124,900 Pending 3 DOM
-
2026-06-02remarks 582-char remark
-
2026-06-02$124,900 Active 1 DOM
ⓘ Source: listings_history table (triggers on properties + properties_extension) + one-shot
backfill from property_details.listing_events for pre-trigger history.
Tax reassessment forecast IL · Partial reset (capped growth)
- Current annual tax
- $2,048 · $171/mo
- Projected year-2 tax
- $2,442 · $203/mo
- Expected delta
- +$393/yr (+$33/mo · 19.2%)
ⓘ Screening estimate from a state-policy table — verify with the county assessor before closing.
Climate risk First Street
- Flood 1/10 Low FEMA zone X (unshaded) · 0% chance over 30 yrs
- Wildfire 1/10 Low
- Heat 4/10 Moderate 7 d/yr ≥105°F today · 19 d/yr by 30 yrs out
- Wind 2/10 Low 100% chance of damaging wind over 30 yrs
- Air quality 4/10 Moderate 3 unhealthy d/yr today · 5 by 30 yrs out
Nearby sold comps map
Loading sold comps map…
Walkable amenities ~0.75 mi
Loading nearby amenities…
Taxation est. · year 1
- Rental income
- $14,183
- − Mortgage interest
- −$6,996
- − Property taxes
- −$2,048
- − Insurance
- −$624
- − Repairs & maintenance
- −$1,135
- − Management
- −$1,135
- − Depreciation
- −$3,633
- Taxable loss
- −$1,389
- Est. tax savings @ 24.0%
- +$333
- After-tax cash flow
- $1,005/yr
For passive investors: Depreciation is non-cash, so a rental often shows a tax loss while cash-flowing — sheltering income. Rental losses are passive: they offset passive income freely, and up to $25,000/yr can offset ordinary (W-2) income if you actively participate and your MAGI is under $100k (phasing out to $0 by $150k); unused losses carry forward. On sale, claimed depreciation is recaptured at up to 25%, and gains may owe capital-gains tax (a 1031 exchange can defer both). Figures are a year-1 estimate at your 24.0% rate — not tax advice; consult a CPA.
Schools (NCES district)
- District
- Paris-Union SD 95
- NCES district ID
- 1730750
- Math proficiency
- 25% ▼ -4.00%
- Reading proficiency
- 42% ▼ -7.00%
- Median HH income
- $36,294
- Composite
- 27.73/100
- National rank
- #6901
- State rank
- #227 of 620 in IL
Livability — Paris
- Score
- 71/100
- State rank
- #342
- US rank
- #6933
Category grades
Schools grade is shown separately in the Schools card above.
Census & demographics
- Census place
- Paris, IL
- City population
- 11,426
- Population (ZIP)
- 11,426
Population outlook (Edgar County) Hauer SSP2
- Today (2025)
- 15,960 people
- By 2030
- 14,978 · -6.2%
- By 2040
- 12,990 · -18.6%
- By 2050
- 11,087 · -30.5%
- By 2075
- 7,338 · -54.0%
- By 2100
- 4,526 · -71.6%
Race, ethnicity, and origin ACS 2023
- Neighborhood character
- Predominantly White (96%)
- Race & ethnicity
- White 96% Two or more races 3% Hispanic / Latino 1%
- Common ancestry
- Slovak 2% Serbian 2% Italian 1%
- Foreign-born
- 1%
- Languages at home
- 98% English-only · Spanish 1% Other Indo-European 1%
Political lean MEDSL · Edgar
- 2024 margin
- Solid R (+52.4) · D 23.0% · R 75.3% · Other 1.7%
- 2008→2024 swing
- -44.4pp toward R · 2008: -7.9pp · 2024: -52.4pp
- All cycles
- 2024: R+52.4 2020: R+52.5 2016: R+49.5 2012: R+32.8 2008: R+7.9
Not yet ingested
- Civics
- —
Market trends
- HPI YoY
- ▼ -66.48%
- Current HPI
- 108.1718
- Rent YoY
- —
- Metro
- —
- State GDP YoY
- ▲ 1.59%
- F500 in state
- 60
Industry mix (Fortune 500 HQ in IL)
| Industry | F500 HQs | Revenue |
|---|---|---|
| Insurance | 4 | $201B |
|
||
| Consumer Goods | 4 | $87B |
|
||
| Industrial Machinery | 3 | $64B |
|
||
| Healthcare | 2 | $55B |
|
||
| Retail / Pharmacy | 1 | $148B |
|
||
| Agriculture / Food | 1 | $86B |
|
||
Price history
+108.2% since first listed6 events — show timeline
- 2026-06-02 Listed $124,900 CIBR
- 2021-10-13 Sold (Public Records) $89,900 Public Records
- 2011-10-14 Sold (Public Records) $70,500 Public Records
- 2011-10-14 Sold (MLS) $70,500 MRED as Distributed by MLS Grid
- 2011-07-18 Listed $74,500 MRED as Distributed by MLS Grid
- 2003-05-02 Sold (Public Records) $60,000 Public Records
Property tax history
+3.2%/yrLatest (2024): $2,048 · +6.0% YoY. Source: county tax records.
Cash-flow waterfall
monthlySold comps — $/sqft
last 12 mo · ≤1 miLoading sold comps…