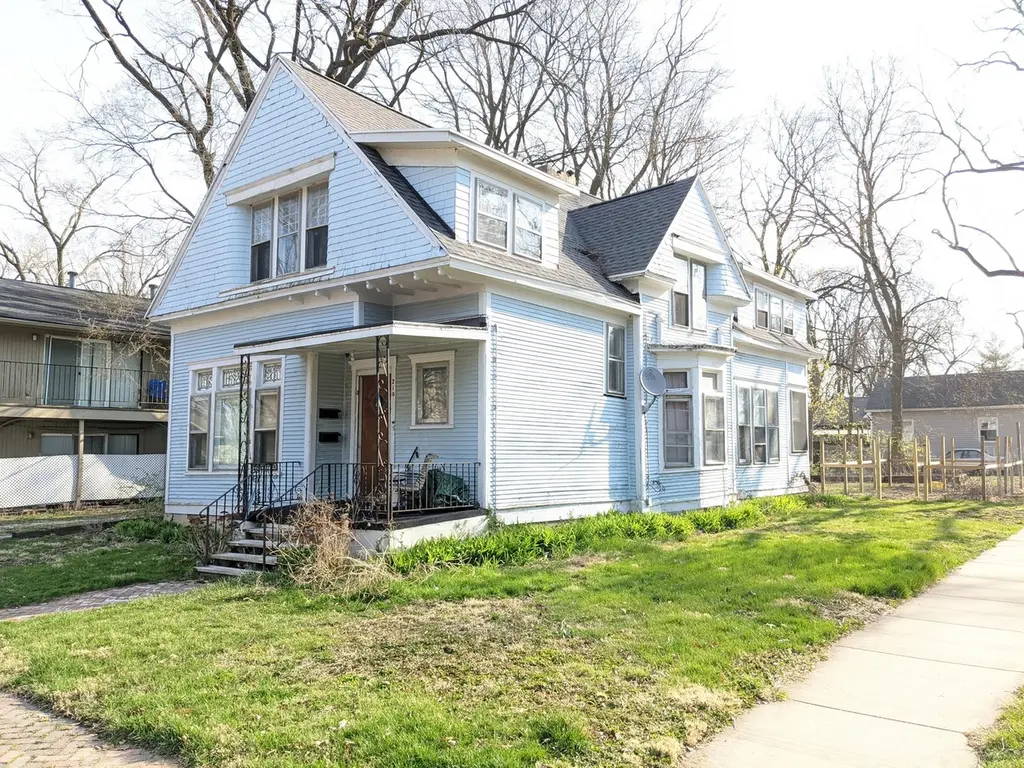
210 S Grove St · Urbana, IL
Flood risk 1/10 · Minimal
- FEMA flood zone
- X (unshaded)
- Chance of flooding over 30 yrs
- 0.0%
- Est. flood insurance / yr
- $473 – $860
Fire risk 1/10 · Minimal
- Est. fire insurance / yr
- $804 – $1,492
Heat risk 3/10 · Minor
- Hot days now (above 104°F)
- 7 days/yr
- Hot days in 30 yrs
- 18 days/yr
Wind risk 2/10 · Minimal
- Chance of severe wind over 30 yrs
- 1.0%
Air-quality risk 2/10 · Minimal
- Unhealthy air days now
- 1 days/yr
- Unhealthy air days in 30 yrs
- 2 days/yr
Risk factors via First Street. Map © Google.
Why this score? — see what drove the D grade
The composite is a weighted blend of 9 inputs, each scored 0–100. Each bar is that input's sub-score; the figure is the points it added to the 100-point composite (weight × sub-score).
- Cash flow +14.7/30.0
- ARV discount +7.5/15.0
- Rent growth +5.0/5.0
- DSCR +4.5/10.0
- Livability +4.0/5.0
- 1% rule +3.9/10.0
- Condition / age +2.5/5.0
- Schools +1.0/10.0
- Appreciation +0.0/10.0
$190,000
🖨 Deal sheet (PDF) 📄 Offer letter ✓ Due diligence
Listing remarks MLS
House hack this converted duplex. Roof less than 10 years old. All upgraded electrical/wiring as well. Baseboard heat upstairs and new HVAC furnace downstairs in 2025. This up and down duplex is a great investment right on the bus line. Great walkability to downtown Urbana. Water billed back in the rent. Both units have laundry setups. Appliances with go with property. Property owner is a designated managing broker in the state of Illinois. Is being offered in a SFR 4 unit portfolio. Rest is in Villa Grove. 305 S Douglas, 310 E Vine,
Key facts
- Converted duplex
- Upgraded electrical
- New hvac furnace
Tags
Neighborhood map
What this means for you Summary
Snapshot
- This is a 4-bed/2.0-bath other listed at $190k.
Deal economics
- At list price, monthly cash flow is $49 ($588/yr) — positive.
- The deal already cash-flows at list — no discount required.
- To meet the 1% rule (rent ≥ 1% of price), the offer needs to be $169k (10.8% below list).
- Recommended offer: $167k (12.0% below list) — sets the bar for market timing.
- Cap rate 6.6% vs local median 3.6% in Urbana — top-decile yield for the area; either an underpriced asset or a hidden risk that comps aren't pricing in. Stress-test before assuming the spread holds.
Location & tenants
- Location reads 80/100 on livability (#110 in IL, #1,793 nationally) — a professional / high-income tenant draw. Strengths: amenities A+, commute A+, cost of living A+; Watch: employment D, schools D-, crime F.
- Urbana SD 116 (urban): math 11% / reading 13% proficiency, ranked #568 of 620 in IL (top 92%) — low school quality limits family demand, transient renter base, plan for 1-2y turnover; 64% free/reduced lunch — lower-income household profile, screen leases tightly.
- Market conditions: Rents rising fast (+11.8%/yr); 123 active listings in the ZIP; 17 comparable units currently listed for rent nearby; rentals at typical pace (median 23d on market — plan ~3-4 weeks tenant-placement turnaround); 573 units permitted in Champaign County in 2024 (359 in 5+ unit buildings).
- This rent runs 33% of the median local income ($62k/yr) — at the standard rent-burdened threshold; future hikes will face affordability resistance.
Forward outlook
- Local home prices are declining (-3.0%/yr); year-one equity from $1k of loan paydown is wiped out by about $6k of value loss. Plan a longer hold.
- Champaign County population projected at +15% by 2050 — modest demand growth; plan on rents tracking national, not racing it.
Negotiation context
- It's been on market 159 days — a 12% lower offer ($167k) is reasonable based on typical stale-listing flexibility.
- 7 sale attempts since 27y ago with the ask held roughly flat each time — persistent listings suggest the price (not the market) is what's stuck; bring a comps-based counter.
- Current owner paid $52k; list at $190k implies a 265% gain — meaningful room to come down on a strong offer.
Risks & watch-outs
- Watch-outs: built in 1893 — expect roof / HVAC / electrical / plumbing capex.
Questions for the listing agent
- It's been on market 159 days. Have you received any prior offers? Is the seller open to a 12% concession, seller financing, or rate buy-down credit?
- Built in 1893 — when were the roof, HVAC, electrical panel, plumbing, and water heater last replaced?
- Why hasn't it sold? Are there any deal-killer items the seller is aware of (foundation, flood, title, zoning, code violations)?
- Is there a deadline driving the sale (1031 exchange, divorce, estate, relocation)? That informs how much negotiation room exists.
- Schools are D-rated, which usually means shorter tenancies and higher turnover. Who's the typical renter profile here, and what's been the actual vacancy rate?
- Crime grade is F in this area — have there been break-ins, vandalism, or insurance claims at this property in the last 3 years? What carrier currently insures it and at what premium?
- The area grade is low — what's the realistic commute time and amenity access for the typical tenant pool here? Any planned neighborhood developments (good or bad) we should know about?
- What's the average days-on-market for RENTAL listings here right now (not sales)? A rising rental-DOM trend means longer vacancies and softer asking-rent achievability than the comps imply.
- What's the recent tenant-quality profile in this submarket — average credit score on applications, eviction rate, late-payment / NSF rate, and stable-employment percentage? A property-management company in the area should have these aggregated.
- How much new for-sale + rental construction is in the pipeline within 1–3 miles? Heavy new supply typically softens prices + rents 12–24 months out; constrained supply supports both.
Investment metrics
- 1% rule
- 0.89% ✗
- Cap rate
- 6.60%
- Cash-on-cash
- 1.11%
- DSCR
- 1.05
- GRM
- 9.3
CMA / ARV
- ARV (median comp)
- $797,280
- List price
- $190,000
- Delta
- -76.17%
- Verdict
- UNDERPRICED
- Comps
- 6 within 2.0 mi
Projected returns pro-forma
-3.0% appreciation · 8.0% rent growth · sell at horizon
- IRR
- -9.2%
- Equity multiple
- 0.65×
- Total profit
- $-18,703
- Equity at exit
- $28,330
- IRR
- 5.9%
- Equity multiple
- 1.54×
- Total profit
- $28,521
- Equity at exit
- $16,428
Cash invested: $53,200 (down + closing). Projections, not guarantees.
Landlord ↔ Tenant lean methodology
- Overall (STATE)
- 43 Moderately Tenant-Leaning
- State Illinois
- 43 Moderately Tenant-Leaning · D+7
- County
- — inherits STATE
- City
- — inherits STATE
ZIP-level market 61802
- Home prices YoY
- -20.5%
- Rents YoY
- 11.8%
- Active inventory
- 123
- Price-to-rent
- 9.3×
Monthly cashflow live
- Estimated rent
- $1,694 high interval (Pro) →
- Mortgage (P&I)
- −$996
- Tax from tax record
- −$214 /mo · $2,563/yr
- Insurance
- −$79
- HOA
- −$0
- Vacancy / Maint / Mgmt
- −$356
- Net cashflow
- $49
Break-even live
Sensitivity live
| Price | -10% $157 | -5% $103 | +0% $49 | +5% $-5 | +10% $-59 |
|---|---|---|---|---|---|
| Rent | -10% $-85 | -5% $-18 | +0% $49 | +5% $116 | +10% $183 |
| Rate | -1.0pp $145 | -0.5pp $97 | base $49 | +0.5pp $0 | +1.0pp $-50 |
UW: 25.0% down · 7.5% · 30yr · 1.5% tax · 5.0% vac · 8.0% maint · 8.0% mgmt
Financing live
Cash to close
- Down payment
- $47,500
- Closing costs
- $5,700
- Reserves months
- —
- Total cash needed
- —
Loan-product check · same deal, 3 products live
Conventional
25% down · 7.5% · 30yr
- Down + closing
- —
- Monthly P&I
- —
- Monthly cashflow
- —
- DSCR
- —
- Eligible?
- —
Personal DTI + credit; lowest rate.
DSCR
20% down · 8.5% · 30yr
- Down + closing
- —
- Monthly P&I
- —
- Monthly cashflow
- —
- DSCR
- —
- Eligible?
- —
No personal income docs; deal must DSCR.
Hard money
10% down · 12.0% · 12mo
- Down + closing
- —
- Monthly P&I
- —
- Monthly cashflow
- —
- DSCR
- —
- Eligible?
- —
Short-term bridge; refi at stabilization.
Rent comps 17 comps
| Address | Beds | Baths | Sqft | Rent | $/sqft | DOM | Units | Dist |
|---|---|---|---|---|---|---|---|---|
| 502 E Washington St Urbana, IL | 3.0 | 2.0 | 1667 | $2,000 | $1.20 | 22d | 1 | 0.36mi |
| 1001 E Washington St Urbana, IL | 3.0 | 1.0 | — | $1,350 | — | 22d | 1 | 0.45mi |
| 1001 E Washington St Unit 1 Urbana, IL | 3.0 | 1.0 | — | $1,350 | — | 14d | 1 | 0.45mi |
| 1604 S Maple St Urbana, IL | 3.0 | 2.5 | 1660 | $2,195 | $1.32 | 45d | 1 | 0.84mi |
| 1109 Austin Dr Urbana, IL | 3.0 | 1.0 | 1300 | $1,350 | $1.04 | 22d | 1 | 0.89mi |
| 104 N Lincoln Ave Urbana, IL | 4.0 | 2.0 | 867 | $469 | $0.54 | 45d | 1 | 0.96mi |
| 1601 E Florida Ave Urbana, IL | 2.0–3.0 | 2.0–3.0 | 949 | $1,459 | $1.54 | 14d | 1 | 1.10mi |
| 1806 S Cottage Grove Ave Urbana, IL | 2.0–3.0 | 1.5–2.0 | 1000 | $1,295 | $1.29 | 14d | 3 | 1.10mi |
| 615 E Colorado Ave Unit B Urbana, IL | 3.0 | 1.5 | 1056 | $1,495 | $1.42 | 14d | 1 | 1.14mi |
| 615 E Colorado Ave Unit B Urbana, IL | 3.0 | 1.5 | 1056 | $1,395 | $1.32 | 45d | 1 | 1.14mi |
| 1102 E Colorado Ave Urbana, IL | 2.0–3.0 | 1.0–2.0 | — | $1,195 | — | 14d | 1 | 1.16mi |
| 2106 Rainbow Vw Urbana, IL | 3.0 | 1.0 | — | $1,650 | — | 14d | 1 | 1.20mi |
| 1202 N Lincoln Ave Urbana, IL | 3.0 | 1.0 | 1150 | $1,395 | $1.21 | 22d | 1 | 1.26mi |
| 1907 E Florida Ave Unit A Urbana, IL | 3.0 | 1.5 | 1250 | $1,550 | $1.24 | 22d | 1 | 1.27mi |
| 1907 E Florida Ave Urbana, IL | 3.0 | 2.0 | 1250 | $1,550 | $1.24 | 22d | 1 | 1.27mi |
| 1803 Golfview Dr Urbana, IL | 4.0 | 2.0 | 2482 | $2,400 | $0.97 | 45d | 1 | 1.29mi |
| 2307 Lantern Hill Dr Urbana, IL | 3.0 | 1.0 | 905 | $1,500 | $1.66 | 45d | 1 | 1.33mi |
Listing history 35 events
-
2026-06-18days on market $190,000 Active 159 DOM
-
2026-06-17days on market $190,000 Active 158 DOM
-
2026-06-16days on market $190,000 Active 157 DOM
-
2026-06-15days on market $190,000 Active 156 DOM
-
2026-06-14days on market $190,000 Active 154 DOM
-
2026-06-13days on market $190,000 Active 153 DOM
-
2026-06-10days on market $190,000 Active 151 DOM
-
2026-06-09days on market $190,000 Active 150 DOM
-
2026-06-08days on market $190,000 Active 149 DOM
-
2026-06-07days on market $190,000 Active 148 DOM
-
2026-06-03days on market $190,000 Active 144 DOM
-
2026-06-02days on market $190,000 Active 143 DOM
-
2026-06-01days on market $190,000 Active 142 DOM
-
2026-05-31days on market $190,000 Active 141 DOM
-
2026-05-30days on market $190,000 Active 140 DOM
-
2026-01-10$190,000 Active 547-char remark
Show marketing remark (547 chars)
House hack this converted duplex. Roof less than 10 years old. All upgraded electrical/wiring as well. Baseboard heat upstairs and new HVAC furnace downstairs in 2025. This up and down duplex is a great investment right on the bus line. Great walkability to downtown Urbana. Water billed back in the rent. Both units have laundry setups. Appliances with go with property. Property owner is a designated managing broker in the state of Illinois. Is being offered in a SFR 4 unit portfolio. Rest is in Villa Grove. 305 S Douglas, 310 E Vine,
-
2022-09-08historical
-
2022-04-23price
-
2022-02-14status Active
-
2022-01-21status Active Under Contract
-
2021-05-12price
-
2021-04-05New
-
2006-06-02soldstatus $52,000
-
2005-11-28historical
-
2005-09-06$59,900
-
2005-08-12soldstatus $50,000
-
2005-08-12soldstatus $50,000
-
2005-08-05historical
-
2005-01-11$62,900
-
2004-06-30historical
-
2004-03-10
-
1999-08-19soldstatus $47,000
-
1999-08-17soldstatus $47,000
-
1999-07-17historical
-
1999-06-09$59,000
ⓘ Source: listings_history table (triggers on properties + properties_extension) + one-shot
backfill from property_details.listing_events for pre-trigger history.
Tax reassessment forecast IL · Partial reset (capped growth)
- Current annual tax
- $2,563 · $214/mo
- Projected year-2 tax
- $3,438 · $287/mo
- Expected delta
- +$875/yr (+$73/mo · 34.1%)
ⓘ Screening estimate from a state-policy table — verify with the county assessor before closing.
Climate risk First Street
- Flood 1/10 Low FEMA zone X (unshaded) · 0% chance over 30 yrs
- Wildfire 1/10 Low
- Heat 3/10 Moderate 7 d/yr ≥104°F today · 18 d/yr by 30 yrs out
- Wind 2/10 Low 100% chance of damaging wind over 30 yrs
- Air quality 2/10 Low 1 unhealthy d/yr today · 2 by 30 yrs out
Nearby sold comps map
Loading sold comps map…
Walkable amenities ~0.75 mi
Loading nearby amenities…
Taxation est. · year 1
- Rental income
- $20,326
- − Mortgage interest
- −$10,643
- − Property taxes
- −$2,563
- − Insurance
- −$950
- − Repairs & maintenance
- −$1,626
- − Management
- −$1,626
- − Depreciation
- −$5,527
- Taxable loss
- −$2,609
- Est. tax savings @ 24.0%
- +$626
- After-tax cash flow
- $1,214/yr
For passive investors: Depreciation is non-cash, so a rental often shows a tax loss while cash-flowing — sheltering income. Rental losses are passive: they offset passive income freely, and up to $25,000/yr can offset ordinary (W-2) income if you actively participate and your MAGI is under $100k (phasing out to $0 by $150k); unused losses carry forward. On sale, claimed depreciation is recaptured at up to 25%, and gains may owe capital-gains tax (a 1031 exchange can defer both). Figures are a year-1 estimate at your 24.0% rate — not tax advice; consult a CPA.
Schools (NCES district)
- District
- Urbana SD 116
- NCES district ID
- 1739960
- Math proficiency
- 11% ▼ -5.00%
- Reading proficiency
- 13% ▼ -7.00%
- Median HH income
- $33,678
- Composite
- 9.72/100
- National rank
- #9830
- State rank
- #568 of 620 in IL
Livability — Urbana
- Score
- 80/100
- State rank
- #110
- US rank
- #1793
Category grades
Schools grade is shown separately in the Schools card above.
Census & demographics
- Census place
- Urbana, IL
- County
- Champaign County · 182,148 people
- City population
- 48,184
- Metro
- Champaign-Urbana, IL
- Population (ZIP)
- 20,293
- Household income
- $61,620
- Rent vs Own
- Severe rent burden
- 809.0
Population outlook (Champaign County) Hauer SSP2
- Today (2025)
- 223,848 people
- By 2030
- 231,416 · +3.4%
- By 2040
- 244,321 · +9.1%
- By 2050
- 256,432 · +14.6%
- By 2075
- 285,823 · +27.7%
- By 2100
- 296,406 · +32.4%
Race, ethnicity, and origin ACS 2023
- Neighborhood character
- Diverse neighborhood (Simpson 0.58)
- Race & ethnicity
- White 61% Black 18% Hispanic / Latino 11% Asian 7% Two or more races 6%
- Hispanic origin (detail)
- Mexican 7% Puerto Rican 1%
- Common ancestry
- Romanian 3% Lithuanian 2% Italian 1%
- Foreign-born
- 12% · China, Canada, South Korea
- Languages at home
- 83% English-only · Spanish 7% Other Indo-European 2% Chinese 2%
Political lean MEDSL · Champaign
- 2024 margin
- Strong D (+24.1) · D 61.3% · R 37.2% · Other 1.5%
- 2008→2024 swing
- +6.6pp toward D · 2008: 17.5pp · 2024: 24.1pp
- All cycles
- 2024: D+24.1 2020: D+22.8 2016: D+18.4 2012: D+6.8 2008: D+17.5
Not yet ingested
- Civics
- —
Market trends
- HPI YoY
- ▼ -53.21%
- Current HPI
- 206.3079
- Rent YoY
- ▲ 11.85%
- Metro
- Champaign-Urbana, IL
- State GDP YoY
- ▲ 1.59%
- F500 in state
- 60
Industry mix (Fortune 500 HQ in IL)
| Industry | F500 HQs | Revenue |
|---|---|---|
| Insurance | 4 | $201B |
|
||
| Consumer Goods | 4 | $87B |
|
||
| Industrial Machinery | 3 | $64B |
|
||
| Healthcare | 2 | $55B |
|
||
| Retail / Pharmacy | 1 | $148B |
|
||
| Agriculture / Food | 1 | $86B |
|
||
Price history
+222.0% since first listed20 events — show timeline
- 2026-01-10 Listed $190,000 MRED as Distributed by MLS Grid
- 2022-09-08 Listing Removed — MRED as Distributed by MLS Grid
- 2022-04-23 Price Changed — MRED as Distributed by MLS Grid
- 2022-02-14 Relisted — MRED as Distributed by MLS Grid
- 2022-01-21 Pending — MRED as Distributed by MLS Grid
- 2021-05-12 Price Changed — MRED as Distributed by MLS Grid
- 2021-04-05 Listed — MRED as Distributed by MLS Grid
- 2006-06-02 Sold (MLS) $52,000 MRED as Distributed by MLS Grid
- 2005-11-28 Listing Removed — MRED as Distributed by MLS Grid
- 2005-09-06 Listed $59,900 MRED as Distributed by MLS Grid
- 2005-08-12 Sold (MLS) $50,000 MRED as Distributed by MLS Grid
- 2005-08-12 Sold (Public Records) $50,000 Public Records
- 2005-08-05 Listing Removed — MRED as Distributed by MLS Grid
- 2005-01-11 Listed $62,900 MRED as Distributed by MLS Grid
- 2004-06-30 Listing Removed — MRED as Distributed by MLS Grid
- 2004-03-10 Listed — MRED as Distributed by MLS Grid
- 1999-08-19 Sold (Public Records) $47,000 Public Records
- 1999-08-17 Sold (MLS) $47,000 MRED as Distributed by MLS Grid
- 1999-07-17 Listing Removed — MRED as Distributed by MLS Grid
- 1999-06-09 Listed $59,000 MRED as Distributed by MLS Grid
Property tax history
+2.7%/yrLatest (2024): $2,563 · +6.3% YoY. Source: county tax records.
Cash-flow waterfall
monthlySold comps — $/sqft
last 12 mo · ≤1 miLoading sold comps…