3200 Langdon Rd · Pueblo, CO
Flood risk 1/10 · Minimal
- FEMA flood zone
- X (unshaded)
- Chance of flooding over 30 yrs
- 0.0%
- Est. flood insurance / yr
- $473 – $860
Fire risk 5/10 · Moderate
- Est. fire insurance / yr
- $939 – $1,743
Heat risk 4/10 · Minor
- Hot days now (above 96°F)
- 7 days/yr
- Hot days in 30 yrs
- 18 days/yr
Wind risk 2/10 · Minimal
- Chance of severe wind over 30 yrs
- —
Air-quality risk 1/10 · Minimal
- Unhealthy air days now
- 0 days/yr
- Unhealthy air days in 30 yrs
- 0 days/yr
Risk factors via First Street. Map © Google.
Why this score? — see what drove the D- grade
The composite is a weighted blend of 9 inputs, each scored 0–100. Each bar is that input's sub-score; the figure is the points it added to the 100-point composite (weight × sub-score).
- Cash flow +10.3/30.0
- ARV discount +7.5/15.0
- Livability +3.7/5.0
- DSCR +3.0/10.0
- Schools +3.0/10.0
- 1% rule +2.8/10.0
- Rent growth +2.6/5.0
- Condition / age +2.5/5.0
- Appreciation +0.0/10.0
$159,500
🖨 Deal sheet (PDF) 📄 Offer letter ✓ Due diligence
Listing remarks
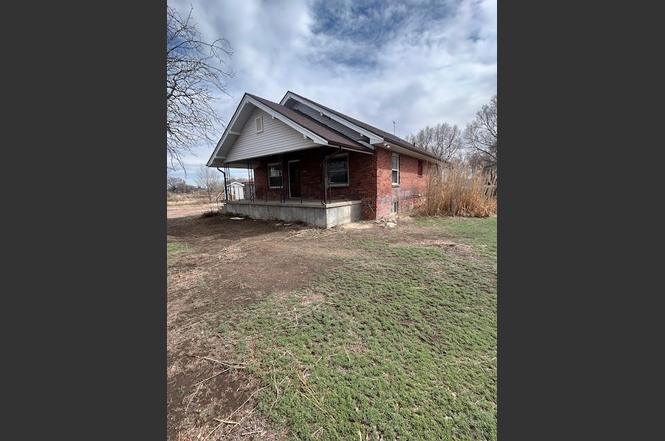
$75,500 OFF the original asking price! Call today to see this nice sized brick rancher with two bedrooms on the main level and 2 bedrooms in the basement. Large front room and spacious room sizes throughout. You will love the ginormous family room, .81 Acres, and large outbuilding. She does need some TLC.
Key facts
- Brick rancher
- .81 acres
- Large outbuilding
Tags
Property features AI
Finance
- HOA & community: No association amenities
Exterior
- Parking: No garage
- Utilities: Well water
- Home design: Single family residence; Residential property
- Construction: Frame and brick construction; Composition roof
- Exterior features: Covered deck/patio; Shed(s) on the property; Irregular-shaped lot
Interior
- Kitchen: No appliances included
- Bedrooms: 2 bedrooms on the main level
- Flooring: Laminate flooring; Tile flooring; Vinyl flooring
- Bathrooms: 2 full bathrooms total; 1 bathroom on the main level
- Fireplace: One wood-burning stove in the living room
- Heating & cooling: Baseboard heating; Hot water heating; Wall cooling unit(s)
- Interior features: Master bedroom on the main level; Storm windows; Finished full basement
- Laundry & utility: Laundry in the basement
Neighborhood map
What this means for you Summary
Snapshot
- This is a 2-bed/2.0-bath single-family listed at $160k.
Deal economics
- At list price, monthly cash flow is $-87 ($-1k/yr) — negative.
- To cash-flow at today's rent, offer at most $144k (9.6% below list).
- To meet the 1% rule (rent ≥ 1% of price), the offer needs to be $124k (22.2% below list).
- Recommended offer: $124k (22.2% below list) — sets the bar for 1% rule.
- Cap rate 5.6% vs local median 2.6% in Pueblo — top-decile yield for the area; either an underpriced asset or a hidden risk that comps aren't pricing in. Stress-test before assuming the spread holds.
Location & tenants
- Location reads 73/100 on livability (#45 in CO) — a middle-class / working-renter tenant base. Strengths: amenities A+, commute A+, cost of living A+; Watch: schools D-, crime F, employment F.
- Pueblo County School District 70 (suburban): math 24% / reading 43% proficiency, ranked #40 of 86 in CO (top 46%) — families likely to look elsewhere, expect single-tenant / working-renter base with shorter leases.
- Market conditions: Rents flat; 22 active listings in the ZIP; 269 units permitted in Pueblo County in 2024 (0 in 5+ unit buildings).
- This rent runs 31% of the median local income ($48k/yr) — at the standard rent-burdened threshold; future hikes will face affordability resistance.
Forward outlook
- Local home prices are declining (-3.0%/yr); year-one equity from $1k of loan paydown is wiped out by about $5k of value loss. Plan a longer hold.
- Pueblo County population projected at +10% by 2050 — modest demand growth; plan on rents tracking national, not racing it.
Negotiation context
- It's been on market 81 days — a 6% lower offer ($150k) is reasonable based on typical stale-listing flexibility.
- 7 sale attempts since 19y ago; this cycle's ask has dropped $76k (32%) from the opening price — seller is motivated, your offer sets the floor, not the list.
Risks & watch-outs
- Watch-outs: built in 1928 — expect roof / HVAC / electrical / plumbing capex.
- Climate carrying-cost: moderate wildfire risk — expect insurance premiums to compound above CPI over the hold.
Questions for the listing agent
- What do current leases actually rent for vs. the listed asking? Can we see a recent rent roll and the last 12 months of T-12 income?
- It's been on market 81 days. Have you received any prior offers? Is the seller open to a 22% concession, seller financing, or rate buy-down credit?
- Built in 1928 — when were the roof, HVAC, electrical panel, plumbing, and water heater last replaced?
- Why hasn't it sold? Are there any deal-killer items the seller is aware of (foundation, flood, title, zoning, code violations)?
- Is there a deadline driving the sale (1031 exchange, divorce, estate, relocation)? That informs how much negotiation room exists.
- Schools are D-rated, which usually means shorter tenancies and higher turnover. Who's the typical renter profile here, and what's been the actual vacancy rate?
- Crime grade is F in this area — have there been break-ins, vandalism, or insurance claims at this property in the last 3 years? What carrier currently insures it and at what premium?
- The area grade is low — what's the realistic commute time and amenity access for the typical tenant pool here? Any planned neighborhood developments (good or bad) we should know about?
- What's the average days-on-market for RENTAL listings here right now (not sales)? A rising rental-DOM trend means longer vacancies and softer asking-rent achievability than the comps imply.
- What's the recent tenant-quality profile in this submarket — average credit score on applications, eviction rate, late-payment / NSF rate, and stable-employment percentage? A property-management company in the area should have these aggregated.
- How much new for-sale + rental construction is in the pipeline within 1–3 miles? Heavy new supply typically softens prices + rents 12–24 months out; constrained supply supports both.
Investment metrics
- 1% rule
- 0.78% ✗
- Cap rate
- 5.64%
- Cash-on-cash
- -2.33%
- DSCR
- 0.90
- GRM
- 10.7
CMA / ARV
No comps found within radius.
Projected returns pro-forma
-3.0% appreciation · 0.44% rent growth · sell at horizon
- IRR
- -23.0%
- Equity multiple
- 0.23×
- Total profit
- $-34,477
- Equity at exit
- $23,782
- IRR
- -25.6%
- Equity multiple
- -0.10×
- Total profit
- $-49,278
- Equity at exit
- $13,791
Cash invested: $44,660 (down + closing). Projections, not guarantees.
Landlord ↔ Tenant lean methodology
- Overall (STATE)
- 38 Tenant-Leaning
- State Colorado
- 38 Tenant-Leaning · D+4
- County
- — inherits STATE
- City
- — inherits STATE
ZIP-level market 81001
- Rents YoY
- 0.4%
- Active inventory
- 22
- Price-to-rent
- 10.7×
Monthly cashflow live
- Estimated rent
- $1,240 medium interval (Pro) →
- Mortgage (P&I)
- −$836
- Tax from tax record
- −$163 /mo · $1,962/yr
- Insurance
- −$66
- HOA
- −$0
- Vacancy / Maint / Mgmt
- −$260
- Net cashflow
- $-87
Break-even live
Sensitivity live
| Price | -10% $4 | -5% $-41 | +0% $-87 | +5% $-132 | +10% $-177 |
|---|---|---|---|---|---|
| Rent | -10% $-185 | -5% $-136 | +0% $-87 | +5% $-38 | +10% $11 |
| Rate | -1.0pp $-6 | -0.5pp $-46 | base $-87 | +0.5pp $-128 | +1.0pp $-170 |
UW: 25.0% down · 7.5% · 30yr · 1.5% tax · 5.0% vac · 8.0% maint · 8.0% mgmt
Financing live
Cash to close
- Down payment
- $39,875
- Closing costs
- $4,785
- Reserves months
- —
- Total cash needed
- —
Loan-product check · same deal, 3 products live
Conventional
25% down · 7.5% · 30yr
- Down + closing
- —
- Monthly P&I
- —
- Monthly cashflow
- —
- DSCR
- —
- Eligible?
- —
Personal DTI + credit; lowest rate.
DSCR
20% down · 8.5% · 30yr
- Down + closing
- —
- Monthly P&I
- —
- Monthly cashflow
- —
- DSCR
- —
- Eligible?
- —
No personal income docs; deal must DSCR.
Hard money
10% down · 12.0% · 12mo
- Down + closing
- —
- Monthly P&I
- —
- Monthly cashflow
- —
- DSCR
- —
- Eligible?
- —
Short-term bridge; refi at stabilization.
Listing history 20 events
-
2026-05-08price $159,500
-
2026-04-28price $173,000
-
2026-04-14price $189,500
-
2026-03-06$235,000 Active
-
2025-05-05soldstatus $282,000
-
2024-08-28price $275,000
-
2024-08-07price $279,000
-
2024-07-24$290,000 Active
-
2023-05-16soldstatus $289,000 Closed
-
2023-04-25status Pending
-
2022-12-07status Active
-
2022-11-05status Pending
-
2022-10-26$289,000 Active
-
2009-04-22soldstatus $95,000
-
2009-04-20soldstatus $95,000
-
2009-02-12$99,900
-
2008-06-27$129,900
-
2007-07-06$137,500
-
1992-08-01soldstatus $45,000
-
1989-05-01soldstatus $65,400
ⓘ Source: listings_history table (triggers on properties + properties_extension) + one-shot
backfill from property_details.listing_events for pre-trigger history.
Tax reassessment forecast CO · Resets to sale price
- Current annual tax
- $1,962 · $163/mo
- Projected year-2 tax
- $1,962 · $163/mo
- Expected delta
- $0/yr ($0/mo · 0.0%)
ⓘ Screening estimate from a state-policy table — verify with the county assessor before closing.
Climate risk First Street
- Flood 1/10 Low FEMA zone X (unshaded) · 0% chance over 30 yrs
- Wildfire 5/10 Major
- Heat 4/10 Moderate 7 d/yr ≥96°F today · 18 d/yr by 30 yrs out
- Wind 2/10 Low
- Air quality 1/10 Low 0 unhealthy d/yr today · 0 by 30 yrs out
Nearby sold comps map
Loading sold comps map…
Walkable amenities ~0.75 mi
Loading nearby amenities…
Taxation est. · year 1
- Rental income
- $14,884
- − Mortgage interest
- −$8,934
- − Property taxes
- −$1,962
- − Insurance
- −$798
- − Repairs & maintenance
- −$1,191
- − Management
- −$1,191
- − Depreciation
- −$4,640
- Taxable loss
- −$3,832
- Est. tax savings @ 24.0%
- +$920
- After-tax cash flow
- $-119/yr
For passive investors: Depreciation is non-cash, so a rental often shows a tax loss while cash-flowing — sheltering income. Rental losses are passive: they offset passive income freely, and up to $25,000/yr can offset ordinary (W-2) income if you actively participate and your MAGI is under $100k (phasing out to $0 by $150k); unused losses carry forward. On sale, claimed depreciation is recaptured at up to 25%, and gains may owe capital-gains tax (a 1031 exchange can defer both). Figures are a year-1 estimate at your 24.0% rate — not tax advice; consult a CPA.
Schools (NCES district)
- District
- Pueblo County School District 70
- NCES district ID
- 0806150
- Math proficiency
- 24% ▼ -4.00%
- Reading proficiency
- 43% ▼ -2.00%
- Median HH income
- $59,438
- Composite
- 29.93/100
- National rank
- #6381
- State rank
- #40 of 86 in CO
Livability — Pueblo
- Score
- 73/100
- State rank
- #45
- US rank
- #5089
Category grades
Schools grade is shown separately in the Schools card above.
Census & demographics
- County
- Pueblo County · 151,887 people
- City population
- 151,887
- Metro
- Pueblo, CO
- Population (ZIP)
- 31,197
- Household income
- $48,417
- Rent vs Own
- Severe rent burden
- 1729.0
Population outlook (Pueblo County) Hauer SSP2
- Today (2025)
- 173,240 people
- By 2030
- 177,716 · +2.6%
- By 2040
- 185,125 · +6.9%
- By 2050
- 190,642 · +10.0%
- By 2075
- 201,611 · +16.4%
- By 2100
- 196,443 · +13.4%
Race, ethnicity, and origin ACS 2023
- Neighborhood character
- Diverse neighborhood (Simpson 0.58)
- Race & ethnicity
- Hispanic / Latino 52% White 39% Two or more races 13% Native American 4% Black 2%
- Hispanic origin (detail)
- Mexican 29% Puerto Rican 1%
- Common ancestry
- Slovak 2% Romanian 2% Lithuanian 1%
- Foreign-born
- 5% · Canada
- Languages at home
- 83% English-only · Spanish 16%
Political lean MEDSL · Pueblo
- 2024 margin
- Lean R (+5.1) · D 46.2% · R 51.3% · Other 2.5%
- 2008→2024 swing
- -20.1pp toward R · 2008: 15.0pp · 2024: -5.1pp
- All cycles
- 2024: R+5.1 2020: D+1.7 2016: D+0.3 2012: D+13.1 2008: D+15.0
Not yet ingested
- Civics
- —
Market trends
- HPI YoY
- ▼ -274.37%
- Current HPI
- 260.3839
- Rent YoY
- ▲ 0.44%
- Metro
- Pueblo, CO
- State GDP YoY
- ▲ 1.95%
- F500 in state
- 14
Industry mix (Fortune 500 HQ in CO)
| Industry | F500 HQs | Revenue |
|---|---|---|
| Technology Distribution | 1 | $31B |
|
||
| Food / Agriculture | 1 | $18B |
|
||
| Packaging | 1 | $14B |
|
||
| Healthcare | 1 | $13B |
|
||
| Energy | 1 | $10B |
|
||
| Technology | 1 | $4B |
|
||
Price history
+143.9% since first listed20 events — show timeline
- 2026-05-08 Price Changed $159,500 PARMLS
- 2026-04-28 Price Changed $173,000 PARMLS
- 2026-04-14 Price Changed $189,500 PARMLS
- 2026-03-06 Listed $235,000 PARMLS
- 2025-05-05 Sold (Public Records) $282,000 Public Records
- 2024-08-28 Price Changed $275,000 PARMLS
- 2024-08-07 Price Changed $279,000 PARMLS
- 2024-07-24 Listed $290,000 PARMLS
- 2023-05-16 Sold (MLS) $289,000 PARMLS
- 2023-04-25 Pending — PARMLS
- 2022-12-07 Relisted — PARMLS
- 2022-11-05 Pending — PARMLS
- 2022-10-26 Listed $289,000 PARMLS
- 2009-04-22 Sold (Public Records) $95,000 Public Records
- 2009-04-20 Sold (MLS) $95,000 PARMLS
- 2009-02-12 Listed $99,900 PARMLS
- 2008-06-27 Listed $129,900 PARMLS
- 2007-07-06 Listed $137,500 PARMLS
- 1992-08-01 Sold (Public Records) $45,000 Public Records
- 1989-05-01 Sold (Public Records) $65,400 Public Records
Property tax history
+10.1%/yrLatest (2025): $1,962 · +22.2% YoY. Source: county tax records.
Cash-flow waterfall
monthlySold comps — $/sqft
last 12 mo · ≤1 miLoading sold comps…