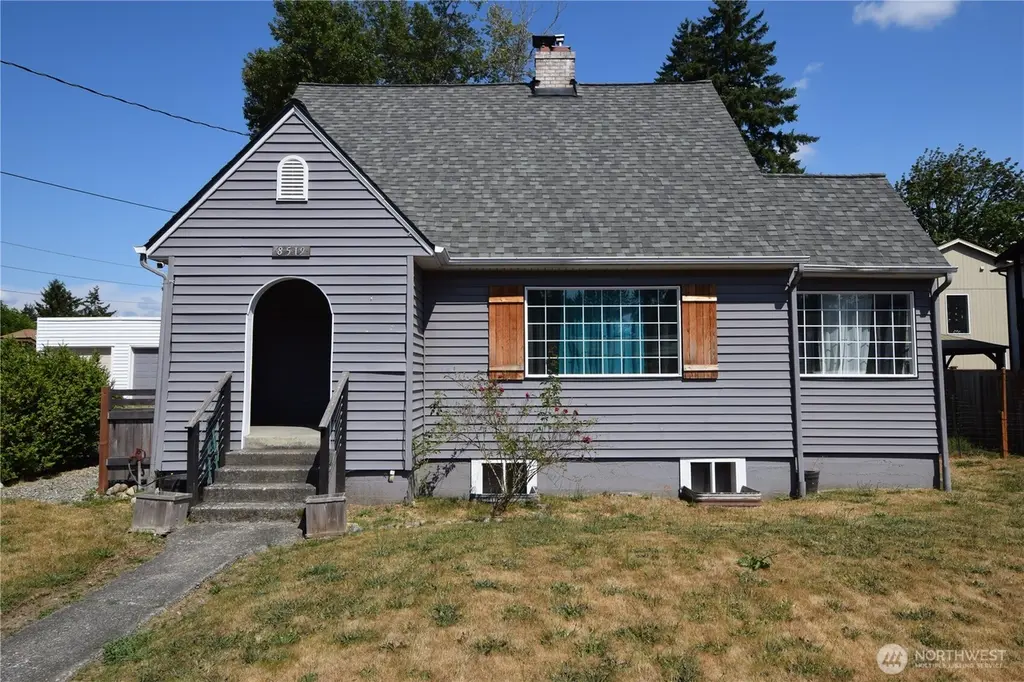
8519 Golden Given Dr E · Midland, WA
Flood risk 1/10 · Minimal
- FEMA flood zone
- X (unshaded)
- Chance of flooding over 30 yrs
- 0.0%
- Est. flood insurance / yr
- $473 – $860
Fire risk 1/10 · Minimal
- Est. fire insurance / yr
- $604 – $1,122
Heat risk 3/10 · Minor
- Hot days now (above 87°F)
- 7 days/yr
- Hot days in 30 yrs
- 14 days/yr
Wind risk 1/10 · Minimal
- Chance of severe wind over 30 yrs
- —
Air-quality risk 7/10 · Major
- Unhealthy air days now
- 10 days/yr
- Unhealthy air days in 30 yrs
- 12 days/yr
Risk factors via First Street. Map © Google.
Why this score? — see what drove the D grade
The composite is a weighted blend of 9 inputs, each scored 0–100. Each bar is that input's sub-score; the figure is the points it added to the 100-point composite (weight × sub-score).
- ARV discount +15.0/15.0
- Cash flow +8.1/30.0
- Schools +3.9/10.0
- Livability +3.6/5.0
- Rent growth +3.0/5.0
- 1% rule +2.9/10.0
- Condition / age +2.5/5.0
- DSCR +2.2/10.0
- Appreciation +0.0/10.0
$349,900
🖨 Deal sheet (PDF) 📄 Offer letter ✓ Due diligence
Listing remarks
Massive price drop, motivated Seller, subject to a short sale approval by lender. Live comfortably in this home remodeled in 2019. Those improvements include all the modern amenities homebuyers look for today. Some repairs will be needed. Toss your storage rent and store your stuff in the 2 car detached garage. Extra parking in the carports. Large fenced front and rear yard, perfect for pets. Multi-generational potential. High utility bills? Not here with efficient gas furnace. Quick shot to shopping, services, schools, work centers, commute routes and military base. Large lot with sewer connection creates an opportunity for DADU construction.
Key facts
- Remodeled in 2019
- Modern amenities
- Detached garage
Tags
Neighborhood map
What this means for you Summary
Snapshot
- This is a 4-bed/2.0-bath single-family listed at $350k.
Deal economics
- At list price, monthly cash flow is $-338 ($-4k/yr) — negative.
- To cash-flow at today's rent, offer at most $290k (17.1% below list).
- To meet the 1% rule (rent ≥ 1% of price), the offer needs to be $278k (20.6% below list).
- Recommended offer: $278k (20.6% below list) — sets the bar for 1% rule.
- Cap rate 5.1% vs local median 3.2% in Midland — top-decile yield for the area; either an underpriced asset or a hidden risk that comps aren't pricing in. Stress-test before assuming the spread holds.
Location & tenants
- Location reads 72/100 on livability (#208 in WA) — a middle-class / working-renter tenant base. Strengths: housing A+, health & safety A+; Watch: crime D, amenities F.
- Franklin Pierce School District (suburban): math 35% / reading 51% proficiency, ranked #197 of 291 in WA (top 68%) — families likely to look elsewhere, expect single-tenant / working-renter base with shorter leases.
- Zoned schools: Harvard Elementary (408 students, 75% FRL); Morris Ford Middle School (882 students, 64% FRL); Franklin Pierce High School (1,141 students, 59% FRL).
- Market conditions: Rents rising (+2.0%/yr); 237 active listings in the ZIP; 1 comparable units currently listed for rent nearby; solid renter incomes; 3,209 units permitted in Pierce County in 2024 (1,269 in 5+ unit buildings).
- This rent runs 36% of the median local income ($93k/yr) — at the standard rent-burdened threshold; future hikes will face affordability resistance.
Forward outlook
- Local home prices are declining (-3.0%/yr); year-one equity from $2k of loan paydown is wiped out by about $10k of value loss. Plan a longer hold.
- Pierce County population projected at +26% by 2050 — long-run rental-demand tailwind backs the buy-and-hold thesis.
Negotiation context
- It's been on market 309 days — a 12% lower offer ($308k) is reasonable based on typical stale-listing flexibility.
- 8 sale attempts since 21y ago; this cycle's ask has dropped $270k (44%) from the opening price — seller is motivated, your offer sets the floor, not the list.
Risks & watch-outs
- Watch-outs: built in 1929 — expect roof / HVAC / electrical / plumbing capex.
Questions for the listing agent
- What do current leases actually rent for vs. the listed asking? Can we see a recent rent roll and the last 12 months of T-12 income?
- It's been on market 309 days. Have you received any prior offers? Is the seller open to a 21% concession, seller financing, or rate buy-down credit?
- Built in 1929 — when were the roof, HVAC, electrical panel, plumbing, and water heater last replaced?
- Why hasn't it sold? Are there any deal-killer items the seller is aware of (foundation, flood, title, zoning, code violations)?
- Is there a deadline driving the sale (1031 exchange, divorce, estate, relocation)? That informs how much negotiation room exists.
- Schools are F-rated, which usually means shorter tenancies and higher turnover. Who's the typical renter profile here, and what's been the actual vacancy rate?
- Crime grade is D in this area — have there been break-ins, vandalism, or insurance claims at this property in the last 3 years? What carrier currently insures it and at what premium?
- The area grade is low — what's the realistic commute time and amenity access for the typical tenant pool here? Any planned neighborhood developments (good or bad) we should know about?
- What's the average days-on-market for RENTAL listings here right now (not sales)? A rising rental-DOM trend means longer vacancies and softer asking-rent achievability than the comps imply.
- What's the recent tenant-quality profile in this submarket — average credit score on applications, eviction rate, late-payment / NSF rate, and stable-employment percentage? A property-management company in the area should have these aggregated.
- How much new for-sale + rental construction is in the pipeline within 1–3 miles? Heavy new supply typically softens prices + rents 12–24 months out; constrained supply supports both.
Investment metrics
- 1% rule
- 0.79% ✗
- Cap rate
- 5.13%
- Cash-on-cash
- -4.15%
- DSCR
- 0.82
- GRM
- 10.5
CMA / ARV
- ARV (median comp)
- $653,498
- List price
- $349,900
- Delta
- -46.46%
- Verdict
- UNDERPRICED
- Comps
- 20 within 1.0 mi
Show comp detail 12 sales within ~0.75 mi
| Address | Dist | Beds/Ba | Sqft | Sold | Price | $/sf | Match |
|---|---|---|---|---|---|---|---|
| 1014 81st Street Ct E | 0.27mi | 4/2.5 | 2,683 (-3%) | 9mo | $590,000 | $220 | 73 |
| 921 81st Street Ct E | 0.31mi | 4/2.5 | 2,638 (-5%) | 9mo | $580,000 | $220 | 68 |
| 8723 13th Ct E | 0.24mi | 4/2.5 | 2,456 (-11%) | 1mo | $640,000 | $261 | 68 |
| 8507 13th Ave E | 0.17mi | 4/2.5 | 2,378 (-14%) | 5mo | $633,900 | $267 | 63 |
| 8614 13th Ave E | 0.14mi | 4/2.5 | 2,378 (-14%) | 11mo | $665,900 | $280 | 59 |
| 8516 13th Ave E | 0.14mi | 4/2.5 | 2,378 (-14%) | 12mo | $668,900 | $281 | 58 |
| 8602 13th Ave E | 0.14mi | 4/2.5 | 2,378 (-14%) | 14mo | $660,900 | $278 | 57 |
| 8517 13th Ave E | 0.17mi | 4/2.5 | 2,378 (-14%) | 13mo | $662,900 | $279 | 56 |
| 8601 13th Ave E | 0.17mi | 4/2.5 | 2,378 (-14%) | 13mo | $665,900 | $280 | 56 |
| 1322 87th St E | 0.18mi | 4/2.5 | 2,378 (-14%) | 14mo | $645,900 | $272 | 55 |
| 8609 13th Ave E | 0.17mi | 4/2.5 | 2,378 (-14%) | 14mo | $655,900 | $276 | 55 |
| 1720 80th St E | 0.57mi | 4/1.5 | 2,450 (-11%) | 8mo | $489,950 | $200 | 46 |
Match score weights: distance 35% · size 25% · config 20% · recency 20%. Top-matched comps best support the ARV.
Projected returns pro-forma
-3.0% appreciation · 2.05% rent growth · sell at horizon
- IRR
- -24.4%
- Equity multiple
- 0.18×
- Total profit
- $-80,776
- Equity at exit
- $52,171
- IRR
- -22.8%
- Equity multiple
- -0.10×
- Total profit
- $-108,234
- Equity at exit
- $30,253
Cash invested: $97,972 (down + closing). Projections, not guarantees.
Landlord ↔ Tenant lean methodology
- Overall (STATE)
- 28 Tenant-Leaning
- State Washington
- 28 Tenant-Leaning · D+8
- County
- — inherits STATE
- City
- — inherits STATE
ZIP-level market 98445
- Rents YoY
- 2.0%
- Active inventory
- 237
- Price-to-rent
- 10.5×
Monthly cashflow live
- Estimated rent
- $2,780 medium interval (Pro) →
- Mortgage (P&I)
- −$1,835
- Tax from tax record
- −$554 /mo · $6,644/yr
- Insurance
- −$146
- HOA
- −$0
- Vacancy / Maint / Mgmt
- −$584
- Net cashflow
- $-338
Break-even live
Sensitivity live
| Price | -10% $-140 | -5% $-239 | +0% $-338 | +5% $-438 | +10% $-537 |
|---|---|---|---|---|---|
| Rent | -10% $-558 | -5% $-448 | +0% $-338 | +5% $-229 | +10% $-119 |
| Rate | -1.0pp $-162 | -0.5pp $-249 | base $-338 | +0.5pp $-429 | +1.0pp $-521 |
UW: 25.0% down · 7.5% · 30yr · 1.5% tax · 5.0% vac · 8.0% maint · 8.0% mgmt
Financing live
Cash to close
- Down payment
- $87,475
- Closing costs
- $10,497
- Reserves months
- —
- Total cash needed
- —
Loan-product check · same deal, 3 products live
Conventional
25% down · 7.5% · 30yr
- Down + closing
- —
- Monthly P&I
- —
- Monthly cashflow
- —
- DSCR
- —
- Eligible?
- —
Personal DTI + credit; lowest rate.
DSCR
20% down · 8.5% · 30yr
- Down + closing
- —
- Monthly P&I
- —
- Monthly cashflow
- —
- DSCR
- —
- Eligible?
- —
No personal income docs; deal must DSCR.
Hard money
10% down · 12.0% · 12mo
- Down + closing
- —
- Monthly P&I
- —
- Monthly cashflow
- —
- DSCR
- —
- Eligible?
- —
Short-term bridge; refi at stabilization.
Rent comps 1 comps
| Address | Beds | Baths | Sqft | Rent | $/sqft | DOM | Units | Dist |
|---|---|---|---|---|---|---|---|---|
| 1425 82nd Street Ct E Tacoma, WA | 4.0 | 2.5 | 1934 | $2,495 | $1.29 | 0d | 1 | 0.37mi |
Listing history 41 events
-
2026-06-13statusdays on market $349,900 Pending 309 DOM
-
2026-06-09days on market $349,900 Active 307 DOM
-
2026-06-08days on market $349,900 Active 306 DOM
-
2026-06-07pricedays on market $349,900 Active 305 DOM
-
2026-06-04days on market $469,900 Active 302 DOM
-
2026-06-03days on market $469,900 Active 301 DOM
-
2026-06-02days on market $469,900 Active 300 DOM
-
2026-06-01days on market $469,900 Active 299 DOM
-
2026-05-31days on market $469,900 Active 298 DOM
-
2026-05-16price $487,900
-
2026-05-07price $489,900
-
2026-04-22status Active
-
2026-04-22price $492,000
-
2026-04-06status Pending
-
2025-12-19price $599,900
-
2025-10-20price $604,900
-
2025-10-06price $609,900
-
2025-09-19price $615,000
-
2025-07-21$620,000 Active
-
2020-08-07soldstatus $475,000 Sold
-
2020-07-07status Pending
-
2020-06-20historical Contingent
-
2020-06-11status Active
-
2020-06-07status Pending Inspection
-
2020-06-03$475,000 Active
-
2017-03-30soldstatus $330,000 Sold
-
2017-03-30soldstatus $330,000
-
2017-03-09status Pending
-
2017-02-10$339,999 Active
-
2012-08-31historical
-
2012-08-30soldstatus $169,950 Sold
-
2012-07-24status Pending
-
2012-07-18status Pending Inspection
-
2012-07-12price $169,950
-
2012-03-17status Active
-
2012-02-25status Pending
-
2012-02-16status Pending Inspection
-
2012-01-27$174,500 Active
-
2006-12-28soldstatus $400,000
-
2006-05-05soldstatus $400,000
-
2005-05-19$425,000
ⓘ Source: listings_history table (triggers on properties + properties_extension) + one-shot
backfill from property_details.listing_events for pre-trigger history.
Tax reassessment forecast WA · Resets to sale price
- Current annual tax
- $6,644 · $554/mo
- Projected year-2 tax
- $6,644 · $554/mo
- Expected delta
- $0/yr ($0/mo · 0.0%)
ⓘ Screening estimate from a state-policy table — verify with the county assessor before closing.
Climate risk First Street
- Flood 1/10 Low FEMA zone X (unshaded) · 0% chance over 30 yrs
- Wildfire 1/10 Low
- Heat 3/10 Moderate 7 d/yr ≥87°F today · 14 d/yr by 30 yrs out
- Wind 1/10 Low
- Air quality 7/10 Severe 10 unhealthy d/yr today · 12 by 30 yrs out
Nearby sold comps map
Loading sold comps map…
Walkable amenities ~0.75 mi
Loading nearby amenities…
Taxation est. · year 1
- Rental income
- $33,355
- − Mortgage interest
- −$19,600
- − Property taxes
- −$6,644
- − Insurance
- −$1,750
- − Repairs & maintenance
- −$2,668
- − Management
- −$2,668
- − Depreciation
- −$10,179
- Taxable loss
- −$10,154
- Est. tax savings @ 24.0%
- +$2,437
- After-tax cash flow
- $-1,625/yr
For passive investors: Depreciation is non-cash, so a rental often shows a tax loss while cash-flowing — sheltering income. Rental losses are passive: they offset passive income freely, and up to $25,000/yr can offset ordinary (W-2) income if you actively participate and your MAGI is under $100k (phasing out to $0 by $150k); unused losses carry forward. On sale, claimed depreciation is recaptured at up to 25%, and gains may owe capital-gains tax (a 1031 exchange can defer both). Figures are a year-1 estimate at your 24.0% rate — not tax advice; consult a CPA.
Schools (NCES district)
- District
- Franklin Pierce School District
- NCES district ID
- 5302940
- Math proficiency
- 35% ▬ 0.00%
- Reading proficiency
- 51% ▲ 2.00%
- Median HH income
- $49,240
- Composite
- 39.18/100
- National rank
- #8227
- State rank
- #197 of 291 in WA
Livability — Midland
- Score
- 72/100
- State rank
- #208
- US rank
- #5731
Category grades
Schools grade is shown separately in the Schools card above.
Census & demographics
- Census place
- Midland, WA
- County
- Pierce County · 788,257 people
- Metro
- Seattle-Tacoma-Bellevue, WA
- Population (ZIP)
- 33,684
- Household income
- $92,520
- Rent vs Own
- Severe rent burden
- 1085.0
Population outlook (Pierce County) Hauer SSP2
- Today (2025)
- 956,648 people
- By 2030
- 1,010,862 · +5.7%
- By 2040
- 1,113,170 · +16.4%
- By 2050
- 1,206,524 · +26.1%
- By 2075
- 1,436,425 · +50.2%
- By 2100
- 1,563,654 · +63.5%
Race, ethnicity, and origin ACS 2023
- Neighborhood character
- Diverse neighborhood (Simpson 0.69)
- Race & ethnicity
- White 53% Two or more races 17% Hispanic / Latino 14% Black 10% Asian 6% Native American 4% Pacific Islander 3%
- Hispanic origin (detail)
- Mexican 10%
- Common ancestry
- Portuguese 3% Lithuanian 2% Italian 2%
- Foreign-born
- 12% · Canada, South Korea, Vietnam
- Languages at home
- 81% English-only · Spanish 8% Other Asian/Pacific 3% Russian/Polish/Slavic 2%
Political lean MEDSL · Pierce
- 2024 margin
- D (+10.8) · D 53.9% · R 43.1% · Other 3.0%
- 2008→2024 swing
- -1.4pp toward R · 2008: 12.2pp · 2024: 10.8pp
- All cycles
- 2024: D+10.8 2020: D+11.2 2016: D+7.5 2012: D+11.0 2008: D+12.2
Not yet ingested
- Civics
- —
Market trends
- HPI YoY
- ▼ -471.23%
- Current HPI
- 316.202
- Rent YoY
- ▲ 2.05%
- Metro
- Seattle-Tacoma-Bellevue, WA
- State GDP YoY
- ▲ 4.65%
- F500 in state
- 22
Industry mix (Fortune 500 HQ in WA)
| Industry | F500 HQs | Revenue |
|---|---|---|
| Retail | 2 | $269B |
|
||
| Technology / Retail | 1 | $638B |
|
||
| Technology | 1 | $245B |
|
||
| Telecommunications | 1 | $38B |
|
||
| Food / Beverage | 1 | $36B |
|
||
| Automotive / Trucks | 1 | $34B |
|
||
Price history
+14.8% since first listed32 events — show timeline
- 2026-05-16 Price Changed $487,900 NWMLS as Distributed by MLS Grid
- 2026-05-07 Price Changed $489,900 NWMLS as Distributed by MLS Grid
- 2026-04-22 Relisted — NWMLS as Distributed by MLS Grid
- 2026-04-22 Price Changed $492,000 NWMLS as Distributed by MLS Grid
- 2026-04-06 Pending — NWMLS as Distributed by MLS Grid
- 2025-12-19 Price Changed $599,900 NWMLS as Distributed by MLS Grid
- 2025-10-20 Price Changed $604,900 NWMLS as Distributed by MLS Grid
- 2025-10-06 Price Changed $609,900 NWMLS as Distributed by MLS Grid
- 2025-09-19 Price Changed $615,000 NWMLS as Distributed by MLS Grid
- 2025-07-21 Listed $620,000 NWMLS as Distributed by MLS Grid
- 2020-08-07 Sold (MLS) $475,000 NWMLS as Distributed by MLS Grid
- 2020-07-07 Pending — NWMLS as Distributed by MLS Grid
- 2020-06-20 Contingent — NWMLS as Distributed by MLS Grid
- 2020-06-11 Relisted — NWMLS as Distributed by MLS Grid
- 2020-06-07 Pending — NWMLS as Distributed by MLS Grid
- 2020-06-03 Listed $475,000 NWMLS as Distributed by MLS Grid
- 2017-03-30 Sold (Public Records) $330,000 Public Records
- 2017-03-30 Sold (MLS) $330,000 NWMLS as Distributed by MLS Grid
- 2017-03-09 Pending — NWMLS as Distributed by MLS Grid
- 2017-02-10 Listed $339,999 NWMLS as Distributed by MLS Grid
- 2012-08-31 Delisted — NWMLS as Distributed by MLS Grid
- 2012-08-30 Sold (MLS) $169,950 NWMLS as Distributed by MLS Grid
- 2012-07-24 Pending — NWMLS as Distributed by MLS Grid
- 2012-07-18 Pending — NWMLS as Distributed by MLS Grid
- 2012-07-12 Price Changed $169,950 NWMLS as Distributed by MLS Grid
- 2012-03-17 Relisted — NWMLS as Distributed by MLS Grid
- 2012-02-25 Pending — NWMLS as Distributed by MLS Grid
- 2012-02-16 Pending — NWMLS as Distributed by MLS Grid
- 2012-01-27 Listed $174,500 NWMLS as Distributed by MLS Grid
- 2006-12-28 Sold (MLS) $400,000 NWMLS as Distributed by MLS Grid
- 2006-05-05 Sold (Public Records) $400,000 Public Records
- 2005-05-19 Listed $425,000 NWMLS as Distributed by MLS Grid
Property tax history
+5.7%/yrLatest (2026): $6,644 · +5.9% YoY. Source: county tax records.
Cash-flow waterfall
monthlySold comps — $/sqft
last 12 mo · ≤1 miLoading sold comps…