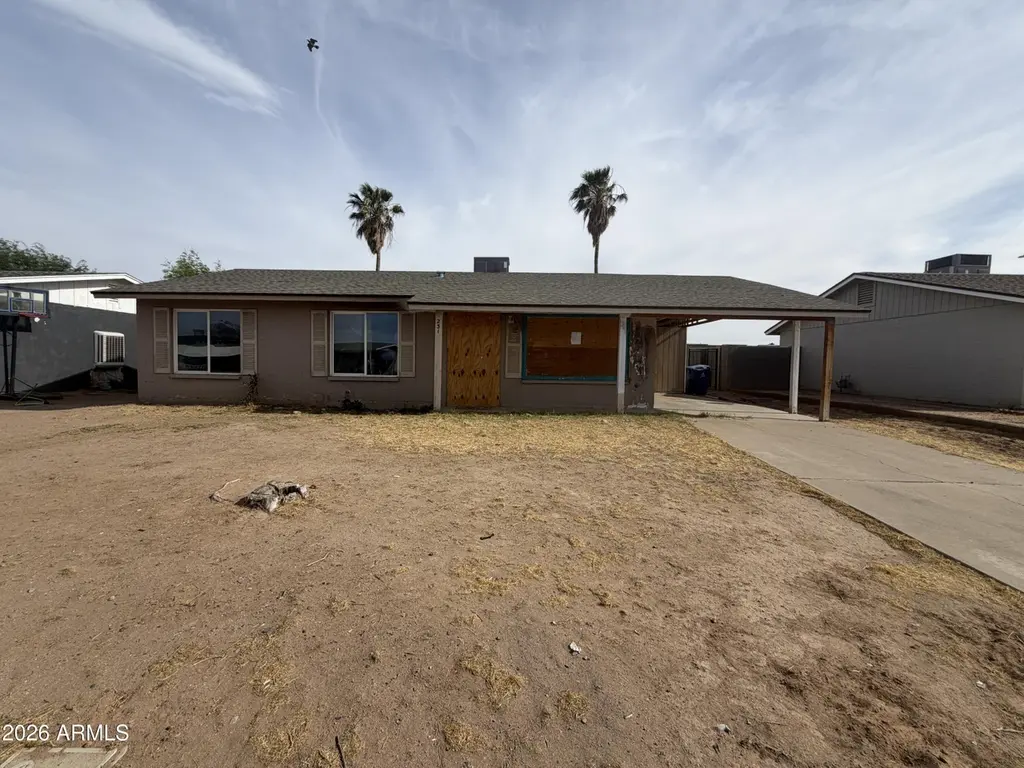
231 W Rhodes Ave · Avondale, AZ
Flood risk 1/10 · Minimal
- FEMA flood zone
- X (shaded)
- Chance of flooding over 30 yrs
- 0.0%
- Est. flood insurance / yr
- $507 – $1,088
Fire risk 5/10 · Moderate
- Est. fire insurance / yr
- $610 – $1,132
Heat risk 9/10 · Severe
- Hot days now (above 113°F)
- 7 days/yr
- Hot days in 30 yrs
- 18 days/yr
Wind risk 1/10 · Minimal
- Chance of severe wind over 30 yrs
- —
Air-quality risk 2/10 · Minimal
- Unhealthy air days now
- 0 days/yr
- Unhealthy air days in 30 yrs
- 1 days/yr
Risk factors via First Street. Map © Google.
Why this score? — see what drove the C grade
The composite is a weighted blend of 9 inputs, each scored 0–100. Each bar is that input's sub-score; the figure is the points it added to the 100-point composite (weight × sub-score).
- Cash flow +20.1/30.0
- ARV discount +15.0/15.0
- DSCR +6.4/10.0
- 1% rule +4.1/10.0
- Livability +3.6/5.0
- Schools +2.8/10.0
- Rent growth +2.6/5.0
- Condition / age +2.5/5.0
- Appreciation +0.0/10.0
$189,000
🖨 Deal sheet (PDF) 📄 Offer letter ✓ Due diligence
Listing remarks
Investor Special - Full Remodel Opportunity! Great opportunity in a desirable Avondale location for investors, flippers, or buyers looking for a full renovation project. This property is in need of a complete remodel and is being sold as-is, offering the perfect blank slate to reimagine and rebuild to your vision. Strong potential to add value in an established neighborhood with convenient access to I-10, nearby schools, shopping, and local amenities. Whether you're looking for your next flip or a long-term investment, this property offers the upside you've been searching for. Bring your contractor and creativity--endless possibilities await!
Key facts
- Complete remodel
- 6,100 sq ft lot
- 3 parking spots
Tags
Property features AI
Finance
- Other: Lot size recorded as 6,100 (source: Assessor)
- HOA & community: No association fees
Exterior
- Parking: 2 open parking spaces; 1 covered parking space; 1 carport space
- Utilities: City water; Public sewer
- Home design: Single-family residence; Fee simple ownership
- Construction: Painted block construction; Composition and tile roof
- Exterior features: Dirt front and dirt back yard; Block fencing; Biking/walking path nearby
Interior
- Bedrooms: Up to 3 possible bedrooms
- Bathrooms: 2 full bathrooms
- Heating & cooling: Cooling present (type listed as Other); No heating listed
- Interior features: No interior laundry hookups (none listed)
- Laundry & utility: No laundry features listed
Neighborhood map
What this means for you Summary
Snapshot
- This is a 3-bed/2.0-bath single-family listed at $189k.
Deal economics
- At list price, monthly cash flow is $237 ($3k/yr) — positive.
- The deal already cash-flows at list — no discount required.
- To meet the 1% rule (rent ≥ 1% of price), the offer needs to be $172k (9.2% below list).
- Recommended offer: $172k (9.2% below list) — sets the bar for 1% rule.
- Cap rate 7.8% vs local median 3.4% in Avondale — top-decile yield for the area; either an underpriced asset or a hidden risk that comps aren't pricing in. Stress-test before assuming the spread holds.
Location & tenants
- Location reads 72/100 on livability (#29 in AZ) — a middle-class / working-renter tenant base. Strengths: housing A+, commute A; Watch: health & safety C-, crime D+, amenities F.
- Agua Fria Union High School District (4289) (suburban): math 24% / reading 37% proficiency, ranked #99 of 249 in AZ (top 40%) — families likely to look elsewhere, expect single-tenant / working-renter base with shorter leases.
- Zoned schools: Agua Fria High School (math 15% / reading 26%, grade F, #222 of 381 statewide, top 59%, 1,652 students, 62% FRL).
- Market conditions: Rents flat; 316 active listings in the ZIP; 18 comparable units currently listed for rent nearby; rentals leasing fast (median 0d on market — plan ~1-2 weeks tenant-placement turnaround); solid renter incomes; 36,011 units permitted in Maricopa County in 2024 (12,801 in 5+ unit buildings).
Forward outlook
- Local home prices are declining (-3.0%/yr); year-one equity from $1k of loan paydown is wiped out by about $6k of value loss. Plan a longer hold.
- Maricopa County population projected at +38% by 2050 — long-run rental-demand tailwind backs the buy-and-hold thesis.
Negotiation context
- Only 6 days on market — expect competitive offers; lowballing is unlikely to land.
Risks & watch-outs
- Climate carrying-cost: moderate wildfire risk; extreme-heat days projected 7→18/yr by 2055 (HVAC capex compounding) — expect insurance premiums to compound above CPI over the hold.
Questions for the listing agent
- Built in 1974 — when were the roof, HVAC, electrical panel, plumbing, and water heater last replaced?
- Is there a deadline driving the sale (1031 exchange, divorce, estate, relocation)? That informs how much negotiation room exists.
- Crime grade is D in this area — have there been break-ins, vandalism, or insurance claims at this property in the last 3 years? What carrier currently insures it and at what premium?
- What's the average days-on-market for RENTAL listings here right now (not sales)? A rising rental-DOM trend means longer vacancies and softer asking-rent achievability than the comps imply.
- What's the recent tenant-quality profile in this submarket — average credit score on applications, eviction rate, late-payment / NSF rate, and stable-employment percentage? A property-management company in the area should have these aggregated.
- How much new for-sale + rental construction is in the pipeline within 1–3 miles? Heavy new supply typically softens prices + rents 12–24 months out; constrained supply supports both.
Investment metrics
- 1% rule
- 0.91% ✗
- Cap rate
- 7.80%
- Cash-on-cash
- 5.37%
- DSCR
- 1.24
- GRM
- 9.2
CMA / ARV
- ARV (on-the-fly)
- $305,760
- Comps found
- 12
Show comp detail 12 sales within ~0.75 mi
| Address | Dist | Beds/Ba | Sqft | Sold | Price | $/sf | Match |
|---|---|---|---|---|---|---|---|
| 33 W Whyman Ave | 0.40mi | 3/2.0 | 1,040 (0%) | 4mo | $298,000 | $287 | 77 |
| 319 S 7th St | 0.61mi | 3/2.0 | 1,053 (+1%) | 3mo | $225,000 | $214 | 68 |
| 728 S 3rd St | 0.40mi | 3/1.0 | 1,088 (+5%) | 13mo | $325,000 | $299 | 59 |
| 419 N Los Amigos Dr | 0.69mi | 3/1.0 | 1,040 (0%) | 17mo | $315,000 | $303 | 50 |
| 200 E Rose Ln | 0.38mi | 2/1.0 (-1) | 954 (-8%) | 14mo | $210,000 | $220 | 48 |
| 1209 S Central Ave | 0.59mi | 3/1.0 | 1,120 (+8%) | 10mo | $279,990 | $250 | 47 |
| 115 E Brooke Pl | 0.24mi | 4/3.0 (+1) | 1,168 (+12%) | 15mo | $345,000 | $295 | 46 |
| 200 S 4th St | 0.41mi | 2/2.0 (-1) | 934 (-10%) | 15mo | $325,000 | $348 | 46 |
| 501 E Kinderman Dr | 0.62mi | 3/1.0 | 1,100 (+6%) | 15mo | $240,000 | $218 | 45 |
| 153 E Buena Vista Ave | 0.53mi | 2/1.0 (-1) | 925 (-11%) | 9mo | $289,700 | $313 | 40 |
| 416 E Randy St | 0.43mi | 4/1.0 (+1) | 1,172 (+13%) | 17mo | $187,500 | $160 | 36 |
| 608 S 7th St | 0.60mi | 2/1.0 (-1) | 936 (-10%) | 15mo | $274,900 | $294 | 34 |
Match score weights: distance 35% · size 25% · config 20% · recency 20%. Top-matched comps best support the ARV.
Projected returns pro-forma
-3.0% appreciation · 0.34% rent growth · sell at horizon
- IRR
- -10.7%
- Equity multiple
- 0.62×
- Total profit
- $-20,110
- Equity at exit
- $28,181
- IRR
- -5.1%
- Equity multiple
- 0.70×
- Total profit
- $-15,861
- Equity at exit
- $16,341
Cash invested: $52,920 (down + closing). Projections, not guarantees.
Landlord ↔ Tenant lean methodology
- Overall (STATE)
- 87 Strongly Landlord-Friendly
- State Arizona
- 87 Strongly Landlord-Friendly · R+3
- County
- — inherits STATE
- City
- — inherits STATE
ZIP-level market 85323
- Home prices YoY
- -27.1%
- Rents YoY
- 0.3%
- Active inventory
- 316
- Price-to-rent
- 9.2×
Monthly cashflow live
- Estimated rent
- $1,716 high interval (Pro) →
- Mortgage (P&I)
- −$991
- Tax from tax record
- −$49 /mo · $586/yr
- Insurance
- −$79
- HOA
- −$0
- Vacancy / Maint / Mgmt
- −$360
- Net cashflow
- $237
Break-even live
Sensitivity live
| Price | -10% $344 | -5% $290 | +0% $237 | +5% $183 | +10% $130 |
|---|---|---|---|---|---|
| Rent | -10% $101 | -5% $169 | +0% $237 | +5% $305 | +10% $372 |
| Rate | -1.0pp $332 | -0.5pp $285 | base $237 | +0.5pp $188 | +1.0pp $138 |
UW: 25.0% down · 7.5% · 30yr · 1.5% tax · 5.0% vac · 8.0% maint · 8.0% mgmt
Financing live
Cash to close
- Down payment
- $47,250
- Closing costs
- $5,670
- Reserves months
- —
- Total cash needed
- —
Loan-product check · same deal, 3 products live
Conventional
25% down · 7.5% · 30yr
- Down + closing
- —
- Monthly P&I
- —
- Monthly cashflow
- —
- DSCR
- —
- Eligible?
- —
Personal DTI + credit; lowest rate.
DSCR
20% down · 8.5% · 30yr
- Down + closing
- —
- Monthly P&I
- —
- Monthly cashflow
- —
- DSCR
- —
- Eligible?
- —
No personal income docs; deal must DSCR.
Hard money
10% down · 12.0% · 12mo
- Down + closing
- —
- Monthly P&I
- —
- Monthly cashflow
- —
- DSCR
- —
- Eligible?
- —
Short-term bridge; refi at stabilization.
Rent comps 18 comps
| Address | Beds | Baths | Sqft | Rent | $/sqft | DOM | Units | Dist |
|---|---|---|---|---|---|---|---|---|
| 231 S 1st St Unit 1 Avondale, AZ | 2.0 | 1.0 | 1050 | $1,600 | $1.52 | 0d | 1 | 0.30mi |
| 102 S 4th Ave Avondale, AZ | 1.0–3.0 | 1.0–2.0 | 853 | $1,899 | $2.22 | 0d | 26 | 0.30mi |
| 812 S Greenleaf Ln Avondale, AZ | 3.0 | 1.0 | 800 | $1,399 | $1.75 | 0d | 1 | 0.36mi |
| 207 S 3rd St Unit 11 Avondale, AZ | 2.0 | 1.0 | 950 | $1,000 | $1.05 | 0d | 1 | 0.42mi |
| 12 E Hill Dr Avondale, AZ | 3.0 | 1.0 | 1319 | $1,600 | $1.21 | 0d | 1 | 0.48mi |
| 206 E Kinderman Dr Avondale, AZ | 4.0 | 2.0 | 1430 | $575 | $0.40 | 0d | 1 | 0.59mi |
| 312 E Kinderman Dr Unit 1 Avondale, AZ | 2.0 | 1.0 | 717 | $1,375 | $1.92 | 20d | 1 | 0.62mi |
| 103 E Brinker Dr Avondale, AZ | 3.0 | 1.0 | 900 | $1,300 | $1.44 | 0d | 3 | 0.74mi |
| 522 N 4th St Unit A Avondale, AZ | 2.0 | 1.0 | 858 | $1,150 | $1.34 | 0d | 1 | 0.80mi |
| 620 N Litchfield Rd Goodyear, AZ | 1.0–3.0 | 1.0–2.0 | 802 | $1,820 | $2.27 | 0d | 14 | 0.82mi |
| 526 N 4th St Unit B Avondale, AZ | 2.0 | 1.0 | 858 | $1,150 | $1.34 | 0d | 1 | 0.82mi |
| 302 E Lawrence Blvd #109 Avondale, AZ | 3.0 | 2.5 | 1340 | $2,100 | $1.57 | 0d | 1 | 0.86mi |
| 12721 W Buckeye Rd Avondale, AZ | 2.0–3.0 | 2.0 | 983 | $1,783 | $1.81 | 0d | 6 | 0.97mi |
| 833 N Litchfield Rd Goodyear, AZ | 3.0 | 2.0 | 1419 | $2,388 | $1.68 | 4d | 1 | 1.04mi |
| 1408 N Central Ave Avondale, AZ | 1.0–3.0 | 1.0–2.0 | 909 | $1,920 | $2.11 | 0d | 15 | 1.30mi |
| 333 E Van Buren St Avondale, AZ | 2.0 | 1.0–2.0 | 574 | $1,365 | $2.38 | 0d | 13 | 1.37mi |
| 1333 N Dysart Rd Avondale, AZ | 2.0 | 1.0–2.0 | 626 | $1,620 | $2.59 | 0d | 27 | 1.46mi |
| 1425 N Palo Verde Dr Goodyear, AZ | 2.0 | 1.0 | 847 | $1,250 | $1.48 | 0d | 4 | 1.47mi |
Listing history 6 events
-
2026-06-17status $189,000 Pending 6 DOM
-
2026-06-16days on market $189,000 Active 6 DOM
-
2026-06-15days on market $189,000 Active 5 DOM
-
2026-06-13days on market $189,000 Active 3 DOM
-
2026-06-13remarks 651-char remark
-
2026-06-13$189,000 Active 2 DOM
ⓘ Source: listings_history table (triggers on properties + properties_extension) + one-shot
backfill from property_details.listing_events for pre-trigger history.
Tax reassessment forecast AZ · Resets to sale price
- Current annual tax
- $586 · $49/mo
- Projected year-2 tax
- $1,247 · $104/mo
- Expected delta
- +$661/yr (+$55/mo · 112.8%)
ⓘ Screening estimate from a state-policy table — verify with the county assessor before closing.
Climate risk First Street
- Flood 1/10 Low FEMA zone X (shaded) · 0% chance over 30 yrs
- Wildfire 5/10 Major
- Heat 9/10 Extreme 7 d/yr ≥113°F today · 18 d/yr by 30 yrs out
- Wind 1/10 Low
- Air quality 2/10 Low 0 unhealthy d/yr today · 1 by 30 yrs out
Nearby sold comps map
Loading sold comps map…
Walkable amenities ~0.75 mi
Loading nearby amenities…
Taxation est. · year 1
- Rental income
- $20,590
- − Mortgage interest
- −$10,587
- − Property taxes
- −$586
- − Insurance
- −$945
- − Repairs & maintenance
- −$1,647
- − Management
- −$1,647
- − Depreciation
- −$5,498
- Taxable loss
- −$321
- Est. tax savings @ 24.0%
- +$77
- After-tax cash flow
- $2,918/yr
For passive investors: Depreciation is non-cash, so a rental often shows a tax loss while cash-flowing — sheltering income. Rental losses are passive: they offset passive income freely, and up to $25,000/yr can offset ordinary (W-2) income if you actively participate and your MAGI is under $100k (phasing out to $0 by $150k); unused losses carry forward. On sale, claimed depreciation is recaptured at up to 25%, and gains may owe capital-gains tax (a 1031 exchange can defer both). Figures are a year-1 estimate at your 24.0% rate — not tax advice; consult a CPA.
Schools (NCES district)
- District
- Agua Fria Union High School District (4289)
- NCES district ID
- 0400450
- Math proficiency
- 24% ▼ -32.00%
- Reading proficiency
- 37% ▼ -12.00%
- Median HH income
- $64,107
- Composite
- 27.92/100
- National rank
- #6865
- State rank
- #99 of 249 in AZ
Livability — Avondale
- Score
- 72/100
- State rank
- #29
- US rank
- #6100
Category grades
Schools grade is shown separately in the Schools card above.
Census & demographics
- Census place
- Avondale, AZ
- County
- Maricopa County · 4,537,380 people
- City population
- 86,122
- Metro
- Phoenix-Mesa-Chandler, AZ
- Population (ZIP)
- 47,043
- Household income
- $83,120
- Rent vs Own
- Severe rent burden
- 1506.0
Population outlook (Maricopa County) Hauer SSP2
- Today (2025)
- 4,979,203 people
- By 2030
- 5,378,229 · +8.0%
- By 2040
- 6,156,598 · +23.6%
- By 2050
- 6,872,376 · +38.0%
- By 2075
- 8,401,270 · +68.7%
- By 2100
- 9,247,439 · +85.7%
Race, ethnicity, and origin ACS 2023
- Neighborhood character
- Diverse neighborhood (Simpson 0.58)
- Race & ethnicity
- Hispanic / Latino 60% Two or more races 26% White 22% Black 13% Asian 2% Native American 2%
- Hispanic origin (detail)
- Mexican 52% Puerto Rican 1%
- Common ancestry
- Italian 2% Portuguese 1% Ukrainian 1%
- Foreign-born
- 19% · Canada, Vietnam
- Languages at home
- 53% English-only · Spanish 42% Arabic 1% Tagalog/Filipino 1%
Political lean MEDSL · Maricopa
- 2024 margin
- Toss-up / Even · D 47.7% · R 51.2% · Other 1.1%
- 2008→2024 swing
- +7.1pp toward D · 2008: -10.6pp · 2024: -3.5pp
- All cycles
- 2024: R+3.5 2020: D+2.2 2016: R+3.5 2012: R+12.0 2008: R+10.6
Not yet ingested
- Civics
- —
Market trends
- HPI YoY
- ▼ -118.44%
- Current HPI
- 319.3653
- Rent YoY
- ▲ 0.34%
- Metro
- Phoenix-Mesa-Chandler, AZ
- State GDP YoY
- ▲ 4.54%
- F500 in state
- 20
Industry mix (Fortune 500 HQ in AZ)
| Industry | F500 HQs | Revenue |
|---|---|---|
| Technology | 2 | $13B |
|
||
| Mining / Metals | 1 | $23B |
|
||
| Environmental Services | 1 | $16B |
|
||
| Metals / Steel | 1 | $14B |
|
||
| Technology Distribution | 1 | $9B |
|
||
| Homebuilding | 1 | $8B |
|
||
Price history
+11.5% since first listed2 events — show timeline
- 2026-06-10 Listed $189,000 ARMLS
- 2024-06-14 Sold (Public Records) $169,500 Public Records
Property tax history
+7.6%/yrLatest (2025): $586 · +7.6% YoY. Source: county tax records.
Cash-flow waterfall
monthlySold comps — $/sqft
last 12 mo · ≤1 miLoading sold comps…