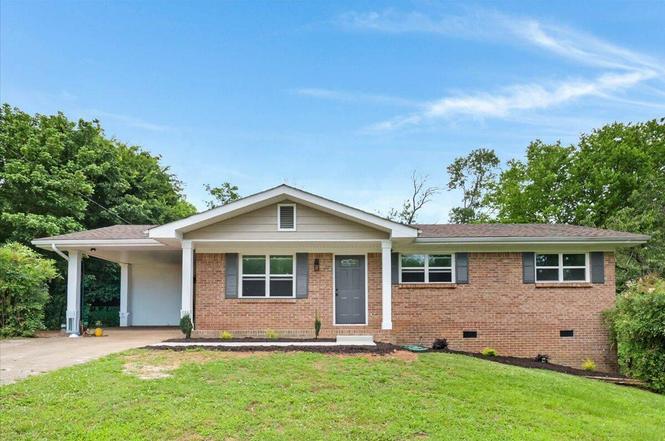
9618 W Vine St · Ooltewah, TN
Flood risk 1/10 · Minimal
- FEMA flood zone
- X (unshaded)
- Chance of flooding over 30 yrs
- 0.0%
- Est. flood insurance / yr
- $507 – $1,088
Fire risk 3/10 · Minor
- Est. fire insurance / yr
- $949 – $1,763
Heat risk 6/10 · Moderate
- Hot days now (above 104°F)
- 7 days/yr
- Hot days in 30 yrs
- 19 days/yr
Wind risk 4/10 · Minor
- Chance of severe wind over 30 yrs
- 10.0%
Air-quality risk 3/10 · Minor
- Unhealthy air days now
- 2 days/yr
- Unhealthy air days in 30 yrs
- 3 days/yr
Risk factors via First Street. Map © Google.
Why this score? — see what drove the D grade
The composite is a weighted blend of 9 inputs, each scored 0–100. Each bar is that input's sub-score; the figure is the points it added to the 100-point composite (weight × sub-score).
- Cash flow +15.6/30.0
- ARV discount +7.5/15.0
- DSCR +4.8/10.0
- Livability +3.3/5.0
- 1% rule +3.0/10.0
- Schools +2.7/10.0
- Condition / age +2.5/5.0
- Rent growth +2.3/5.0
- Appreciation +0.0/10.0
$275,000
🖨 Deal sheet 📄 Offer letter ✓ Due diligence
Listing remarks
Welcome to 9618 Vine Street in the heart of Ooltewah! This beautifully updated 3-bedroom, 1-bath home is tucked away on a quiet dead-end street, offering both privacy and convenience. Step inside to discover a completely refreshed interior featuring all-new drywall, fresh paint, and stylish finishes throughout. The kitchen has been thoughtfully updated with brand-new cabinetry, elegant quartz countertops, and stainless steel GE appliances, creating a modern space that's both functional and inviting. The bathroom has been upgraded with a beautifully tiled tub/shower combination, while major improvements such as a new HVAC system provide peace of mind for years to come. Outside, you'll enjoy
Key facts
- New drywall
- Quartz countertops
- Fresh paint
Tags
Property features AI
Finance
- Other: Property type: Residential - Single Family Residence; Lot is level with paved, public-maintained city street frontage (lot dimensions 85 x 125, acreage listed but excluded per instructions); Subdivision: Carolyn Acres
Exterior
- Parking: Carport (1 space); Driveway; Off-street parking
- Utilities: Public water; Septic tank sewer; Electricity connected; Phone connected; Water connected
- Home design: Single-family house; One level; Updated / remodeled
- Construction: Brick and metal siding exterior; Block foundation; Built/finished area listed as 960 (sq. ft. excluded per instructions)
- Exterior features: Deck; Covered porch; Porch; Partial fencing; Shingle roof; No additional exterior structures listed
Interior
- Kitchen: Dishwasher; Electric range; Microwave; Water heater
- Bedrooms: 6 total rooms (bedroom count not specified)
- Flooring: Vinyl
- Bathrooms: 1 full bathroom
- Heating & cooling: Central heating (electric); Central air conditioning
- Interior features: Eat-in kitchen
- Laundry & utility: Washer hookup (main level); Electric dryer hookup (main level)
Neighborhood map
What this means for you Summary
Snapshot
- This is a 3-bed/1.0-bath single-family listed at $275k.
Deal economics
- At list price, monthly cash flow is $118 ($1k/yr) — positive.
- The deal already cash-flows at list — no discount required.
- To meet the 1% rule (rent ≥ 1% of price), the offer needs to be $220k (19.9% below list).
- Recommended offer: $220k (19.9% below list) — sets the bar for 1% rule.
Location & tenants
- Location reads 66/100 on livability (#135 in TN) — a middle-class / working-renter tenant base. Strengths: cost of living A+, housing A+, crime A; Watch: amenities F, commute F, employment F.
- Hamilton County (urban): math 31% / reading 31% proficiency, ranked #42 of 139 in TN (top 30%) — families likely to look elsewhere, expect single-tenant / working-renter base with shorter leases.
- Zoned schools: Ooltewah Elementary (math 60% / reading 52%, grade C+, #82 of 952 statewide, top 9%, 874 students, 0% FRL); Ooltewah Middle School (math 20% / reading 21%, grade F, #194 of 333 statewide, top 59%, 519 students, 0% FRL); Ooltewah High School (math 9% / reading 39%, grade F, #144 of 332 statewide, top 43%, 1,266 students, 0% FRL) — zoned schools average 0% FRL vs 52% district-wide (52 pts lower); this property's tenant base skews higher-income than the district average.
- Market conditions: Rents soft (-0.8%/yr); 733 active listings in the ZIP; 3 comparable units currently listed for rent nearby; rentals at typical pace (median 14d on market — plan ~3-4 weeks tenant-placement turnaround); solid renter incomes; 2,133 units permitted in Hamilton County in 2024 (405 in 5+ unit buildings).
Forward outlook
- Local home prices are declining (-3.0%/yr); year-one equity from $2k of loan paydown is wiped out by about $8k of value loss. Plan a longer hold.
- Hamilton County population projected at +23% by 2050 — long-run rental-demand tailwind backs the buy-and-hold thesis.
Negotiation context
- Only 6 days on market — expect competitive offers; lowballing is unlikely to land.
- Current owner paid $135k; list at $275k implies a 104% gain — meaningful room to come down on a strong offer.
Risks & watch-outs
- Climate carrying-cost: extreme-heat days projected 7→19/yr by 2055 (HVAC capex compounding) — expect insurance premiums to compound above CPI over the hold.
Questions for the listing agent
- Built in 1972 — when were the roof, HVAC, electrical panel, plumbing, and water heater last replaced?
- Is there a deadline driving the sale (1031 exchange, divorce, estate, relocation)? That informs how much negotiation room exists.
- The area grade is low — what's the realistic commute time and amenity access for the typical tenant pool here? Any planned neighborhood developments (good or bad) we should know about?
- What's the average days-on-market for RENTAL listings here right now (not sales)? A rising rental-DOM trend means longer vacancies and softer asking-rent achievability than the comps imply.
- What's the recent tenant-quality profile in this submarket — average credit score on applications, eviction rate, late-payment / NSF rate, and stable-employment percentage? A property-management company in the area should have these aggregated.
- How much new for-sale + rental construction is in the pipeline within 1–3 miles? Heavy new supply typically softens prices + rents 12–24 months out; constrained supply supports both.
Investment metrics
- 1% rule
- 0.80% ✗
- Cap rate
- 6.81%
- Cash-on-cash
- 1.83%
- DSCR
- 1.08
- GRM
- 10.4
CMA / ARV
- ARV (on-the-fly)
- $107,520
- Comps found
- 1
Show comp detail 1 sale within ~0.75 mi
| Address | Dist | Beds/Ba | Sqft | Sold | Price | $/sf | Match |
|---|---|---|---|---|---|---|---|
| 5502 Pearl St | 0.49mi | 2/1.0 (-1) | 896 (-7%) | 4mo | $100,000 | $112 | 58 |
Match score weights: distance 35% · size 25% · config 20% · recency 20%. Top-matched comps best support the ARV.
Projected returns pro-forma
-3.0% appreciation · 0.0% rent growth · sell at horizon
- IRR
- -16.4%
- Equity multiple
- 0.43×
- Total profit
- $-43,666
- Equity at exit
- $41,003
- IRR
- -13.7%
- Equity multiple
- 0.30×
- Total profit
- $-53,892
- Equity at exit
- $23,777
Cash invested: $77,000 (down + closing). Projections, not guarantees.
Landlord ↔ Tenant lean methodology
- Overall (STATE)
- 87 Strongly Landlord-Friendly
- State Tennessee
- 87 Strongly Landlord-Friendly · R+13
- County
- — inherits STATE
- City
- — inherits STATE
ZIP-level market 37363
- Rents YoY
- -0.8%
- Active inventory
- 733
- Price-to-rent
- 10.4×
Monthly cashflow live
- Estimated rent
- $2,204 medium interval (Pro) →
- Mortgage (P&I)
- −$1,442
- Tax from tax record
- −$66 /mo · $798/yr
- Insurance
- −$115
- HOA
- −$0
- Vacancy / Maint / Mgmt
- −$463
- Net cashflow
- $118
Break-even live
UW: 25.0% down · 7.5% · 30yr · 1.5% tax · 5.0% vac · 8.0% maint · 8.0% mgmt
Financing live
Cash to close
- Down payment
- $68,750
- Closing costs
- $8,250
- Reserves months
- —
- Total cash needed
- —
Loan-product check · same deal, 3 products live
Conventional
25% down · 7.5% · 30yr
- Down + closing
- —
- Monthly P&I
- —
- Monthly cashflow
- —
- DSCR
- —
- Eligible?
- —
Personal DTI + credit; lowest rate.
DSCR
20% down · 8.5% · 30yr
- Down + closing
- —
- Monthly P&I
- —
- Monthly cashflow
- —
- DSCR
- —
- Eligible?
- —
No personal income docs; deal must DSCR.
Hard money
10% down · 12.0% · 12mo
- Down + closing
- —
- Monthly P&I
- —
- Monthly cashflow
- —
- DSCR
- —
- Eligible?
- —
Short-term bridge; refi at stabilization.
Rent comps 3 comps
| Address | Beds | Baths | Sqft | Rent | $/sqft | DOM | Units | Dist |
|---|---|---|---|---|---|---|---|---|
| 9211 Lawford Way Ooltewah, TN | 1.0–3.0 | 1.0–2.0 | 1100 | $2,219 | $2.02 | 14d | 12 | 0.97mi |
| 9198 Integra Hills Ln Ooltewah, TN | 1.0–3.0 | 1.0–2.0 | 1081 | $2,107 | $1.95 | 14d | 33 | 1.16mi |
| 5080 Apison Villas Cir Collegedale, TN | 2.0 | 2.0 | 1112 | $1,818 | $1.63 | 14d | 3 | 1.48mi |
Listing history 6 events
-
2026-06-18days on market $275,000 Active 6 DOM
-
2026-06-17days on market $275,000 Active 5 DOM
-
2026-06-16days on market $275,000 Active 4 DOM
-
2026-06-15days on market $275,000 Active 3 DOM
-
2026-06-14remarks 699-char remark
-
2026-06-14$275,000 Active 1 DOM
ⓘ Source: listings_history table (triggers on properties + properties_extension) + one-shot
backfill from property_details.listing_events for pre-trigger history.
Tax reassessment forecast TN · Resets to sale price
- Current annual tax
- $798 · $66/mo
- Projected year-2 tax
- $1,952 · $163/mo
- Expected delta
- +$1,155/yr (+$96/mo · 144.7%)
ⓘ Screening estimate from a state-policy table — verify with the county assessor before closing.
Climate risk First Street
- Flood 1/10 Low FEMA zone X (unshaded) · 0% chance over 30 yrs
- Wildfire 3/10 Moderate
- Heat 6/10 Major 7 d/yr ≥104°F today · 19 d/yr by 30 yrs out
- Wind 4/10 Moderate 10% chance of damaging wind over 30 yrs
- Air quality 3/10 Moderate 2 unhealthy d/yr today · 3 by 30 yrs out
Nearby sold comps map
Loading sold comps map…
Walkable amenities ~0.75 mi
Loading nearby amenities…
Taxation est. · year 1
- Rental income
- $26,443
- − Mortgage interest
- −$15,404
- − Property taxes
- −$798
- − Insurance
- −$1,375
- − Repairs & maintenance
- −$2,115
- − Management
- −$2,115
- − Depreciation
- −$8,000
- Taxable loss
- −$3,365
- Est. tax savings @ 24.0%
- +$808
- After-tax cash flow
- $2,219/yr
For passive investors: Depreciation is non-cash, so a rental often shows a tax loss while cash-flowing — sheltering income. Rental losses are passive: they offset passive income freely, and up to $25,000/yr can offset ordinary (W-2) income if you actively participate and your MAGI is under $100k (phasing out to $0 by $150k); unused losses carry forward. On sale, claimed depreciation is recaptured at up to 25%, and gains may owe capital-gains tax (a 1031 exchange can defer both). Figures are a year-1 estimate at your 24.0% rate — not tax advice; consult a CPA.
Schools (NCES district)
- District
- Hamilton County
- NCES district ID
- 4701590
- Math proficiency
- 31% ▼ -10.00%
- Reading proficiency
- 31% ▼ -3.00%
- Median HH income
- $47,456
- Composite
- 26.8/100
- National rank
- #7122
- State rank
- #42 of 139 in TN
Livability — Ooltewah
- Score
- 66/100
- State rank
- #135
- US rank
- #12264
Category grades
Schools grade is shown separately in the Schools card above.
Census & demographics
- Census place
- Ooltewah, TN
- County
- Hamilton County · 312,777 people
- City population
- 42,093
- Metro
- Chattanooga, TN-GA
- Population (ZIP)
- 42,093
- Household income
- $97,399
- Rent vs Own
- Severe rent burden
- 884.0
Population outlook (Hamilton County) Hauer SSP2
- Today (2025)
- 393,784 people
- By 2030
- 412,983 · +4.9%
- By 2040
- 449,502 · +14.1%
- By 2050
- 484,341 · +23.0%
- By 2075
- 565,746 · +43.7%
- By 2100
- 618,394 · +57.0%
Race, ethnicity, and origin ACS 2023
- Neighborhood character
- Predominantly White (79%)
- Race & ethnicity
- White 79% Black 9% Hispanic / Latino 7% Two or more races 4% Asian 2%
- Hispanic origin (detail)
- Mexican 3% Puerto Rican 1%
- Common ancestry
- Slovak 4% Italian 2% Romanian 2%
- Foreign-born
- 6% · Canada
- Languages at home
- 91% English-only · Spanish 5% German/W. Germanic 1% French/Haitian/Cajun 1%
Political lean MEDSL · Hamilton
- 2024 margin
- R (+13.1) · D 42.7% · R 55.7% · Other 1.6%
- 2008→2024 swing
- -1.2pp toward R · 2008: -11.8pp · 2024: -13.1pp
- All cycles
- 2024: R+13.1 2020: R+9.7 2016: R+16.6 2012: R+14.8 2008: R+11.8
Not yet ingested
- Civics
- —
Market trends
- HPI YoY
- ▼ -140.23%
- Current HPI
- 247.6005
- Rent YoY
- ▼ -0.79%
- Metro
- Chattanooga, TN-GA
- State GDP YoY
- ▲ 2.78%
- F500 in state
- 22
Industry mix (Fortune 500 HQ in TN)
| Industry | F500 HQs | Revenue |
|---|---|---|
| Healthcare | 3 | $91B |
|
||
| Retail | 3 | $72B |
|
||
| Transportation / Logistics | 1 | $88B |
|
||
| Paper / Packaging | 1 | $19B |
|
||
| Insurance | 1 | $13B |
|
||
| Energy | 1 | $12B |
|
||
Price history
+963.9% since first listed4 events — show timeline
- 2026-06-12 Listed $275,000 GCAR
- 2026-06-11 Coming Soon $275,000 GCAR
- 2026-04-13 Sold (Public Records) $135,000 Public Records
- 1994-05-20 Sold (Public Records) $25,849 Public Records
Property tax history
+5.2%/yrLatest (2025): $798 · +64.9% YoY. Source: county tax records.
Cash-flow waterfall
monthlySold comps — $/sqft
last 12 mo · ≤1 miLoading sold comps…