15500 Bubbling Wls #174 · Garnet, CA
Flood risk 1/10 · Minimal
- FEMA flood zone
- AO
- Chance of flooding over 30 yrs
- 0.0%
- Est. flood insurance / yr
- $848 – $2,087
Fire risk 5/10 · Moderate
- Est. fire insurance / yr
- $659 – $1,223
Heat risk 8/10 · Major
- Hot days now (above 111°F)
- 2 days/yr
- Hot days in 30 yrs
- 6 days/yr
Wind risk 1/10 · Minimal
- Chance of severe wind over 30 yrs
- —
Air-quality risk 5/10 · Moderate
- Unhealthy air days now
- 8 days/yr
- Unhealthy air days in 30 yrs
- 11 days/yr
Risk factors via First Street. Map © Google.
Why this score? — see what drove the C+ grade
The composite is a weighted blend of 9 inputs, each scored 0–100. Each bar is that input's sub-score; the figure is the points it added to the 100-point composite (weight × sub-score).
- Cash flow +30.0/30.0
- 1% rule +10.0/10.0
- DSCR +10.0/10.0
- ARV discount +3.8/15.0
- Rent growth +3.4/5.0
- Schools +2.7/10.0
- Livability +2.7/5.0
- Condition / age +2.5/5.0
- Appreciation +0.0/10.0
$65,000
🖨 Deal sheet 📄 Offer letter ✓ Due diligence
Listing remarks MLS
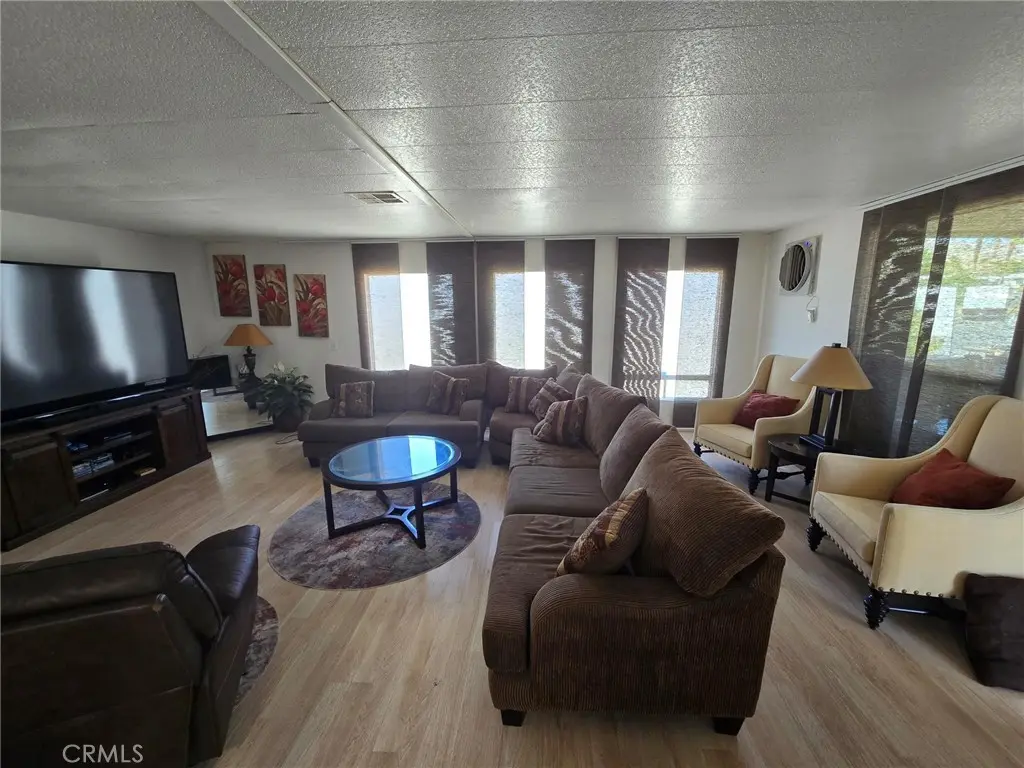
Super clean, open floor plan, with updated kitchen, newer a/c and heating. Newer front deck, corner lot with extra off-street parking and storage.
Key facts
- Open floor plan
- Storage
- Updated kitchen
Tags
Neighborhood map
What this means for you Summary
Snapshot
- This is a 2-bed/2.0-bath manufactured listed at $65k.
Deal economics
- At list price, monthly cash flow is $2k ($18k/yr) — positive.
- The deal already cash-flows at list — no discount required.
- Meets the 1% rule at list price ($3k rent vs $65k).
- Recommended offer: $61k (6.0% below list) — sets the bar for market timing.
- Cap rate 36.9% vs local median 6.0% in Garnet — top-decile yield for the area; either an underpriced asset or a hidden risk that comps aren't pricing in. Stress-test before assuming the spread holds.
Location & tenants
- Location reads 53/100 on livability (#971 in CA) — a working-class tenant base; expect higher turnover. Strengths: housing A+; Watch: cost of living D, schools F, crime F.
- Palm Springs Unified (suburban): math 21% / reading 42% proficiency, ranked #328 of 517 in CA (top 63%) — families likely to look elsewhere, expect single-tenant / working-renter base with shorter leases; 73% free/reduced lunch — lower-income household profile, screen leases tightly.
- Market conditions: Rents rising (+3.7%/yr); 515 active listings in the ZIP; 9 comparable units currently listed for rent nearby; rentals lingering (median 44d on market — plan ~5-8 weeks vacancy on turnover, expect pricing pressure); 89% of comp listings sitting > 30 days — soft ceiling on asking rent; 9,195 units permitted in Riverside County in 2024 (1,512 in 5+ unit buildings).
- At $2,670/mo this rent would consume 59% of the median local household income ($54k/yr) (locally 2095% of renters already pay >50% of income on rent) — very limited rent-growth headroom before tenants either downsize or default.
Forward outlook
- Local home prices are declining (-3.0%/yr); year-one equity from $449 of loan paydown is wiped out by about $2k of value loss. Plan a longer hold.
- Riverside County population projected at +22% by 2050 — long-run rental-demand tailwind backs the buy-and-hold thesis.
- At projected returns (-3.0% appreciation + 3.7% rent growth), your $18k cash investment doubles in ~2 years — after that, you're playing with house money.
Negotiation context
- It's been on market 61 days — a 6% lower offer ($61k) is reasonable based on typical stale-listing flexibility.
- 3 sale attempts since 25y ago with the ask held roughly flat each time — persistent listings suggest the price (not the market) is what's stuck; bring a comps-based counter.
Risks & watch-outs
- Watch-outs: flood insurance adds $122/mo.
- Climate carrying-cost: in FEMA flood zone AO (mandatory federal flood insurance); moderate wildfire risk; extreme-heat days projected 2→6/yr by 2055 (HVAC capex compounding) — expect insurance premiums to compound above CPI over the hold.
Questions for the listing agent
- It's been on market 61 days. Have you received any prior offers? Is the seller open to a 6% concession, seller financing, or rate buy-down credit?
- Built in 1972 — when were the roof, HVAC, electrical panel, plumbing, and water heater last replaced?
- What's the actual annual flood-insurance premium (NFIP or private), and is the property in a SFHA with mandatory coverage?
- Why hasn't it sold? Are there any deal-killer items the seller is aware of (foundation, flood, title, zoning, code violations)?
- Is there a deadline driving the sale (1031 exchange, divorce, estate, relocation)? That informs how much negotiation room exists.
- Schools are F-rated, which usually means shorter tenancies and higher turnover. Who's the typical renter profile here, and what's been the actual vacancy rate?
- Crime grade is F in this area — have there been break-ins, vandalism, or insurance claims at this property in the last 3 years? What carrier currently insures it and at what premium?
- What's the average days-on-market for RENTAL listings here right now (not sales)? A rising rental-DOM trend means longer vacancies and softer asking-rent achievability than the comps imply.
- What's the recent tenant-quality profile in this submarket — average credit score on applications, eviction rate, late-payment / NSF rate, and stable-employment percentage? A property-management company in the area should have these aggregated.
- How much new for-sale + rental construction is in the pipeline within 1–3 miles? Heavy new supply typically softens prices + rents 12–24 months out; constrained supply supports both.
Investment metrics
- 1% rule
- 4.11% ✓
- Cap rate
- 36.94%
- Cash-on-cash
- 109.44%
- DSCR
- 5.87
- GRM
- 2.0
CMA / ARV
- ARV (median comp)
- $60,000
- List price
- $65,000
- Delta
- 8.33%
- Verdict
- FAIR
- Comps
- 8 within 1.0 mi
Show comp detail 12 sales within ~0.75 mi
| Address | Dist | Beds/Ba | Sqft | Sold | Price | $/sf | Match |
|---|---|---|---|---|---|---|---|
| 15500 Bubbling Wells Rd #265 | 0.00mi | 2/2.0 | 1,440 (-2%) | 3mo | $45,000 | $31 | 95 |
| 15500 Bubbling Wells Rd #300 | 0.00mi | 2/2.0 | 1,440 (-2%) | 7mo | $55,000 | $38 | 91 |
| 15500 Bubbling Wells Rd #237 | 0.00mi | 2/2.0 | 1,440 (-2%) | 13mo | $40,000 | $28 | 86 |
| 15500 Bubbling Wells Rd #277 | 0.13mi | 2/2.0 | 1,536 (+5%) | 1mo | $55,000 | $36 | 84 |
| 15500 Bubbling Wells Rd #104 | 0.13mi | 2/2.0 | 1,440 (-2%) | 15mo | $125,000 | $87 | 78 |
| 15500 Bubbling Wells Rd #243 | 0.12mi | 3/2.0 (+1) | 1,344 (-8%) | 3mo | $69,500 | $52 | 73 |
| 15500 Bubbling Wells Rd #283 | 0.02mi | 2/2.0 | 1,344 (-8%) | 15mo | $75,000 | $56 | 73 |
| 15500 Bubbling Wells Rd #191 | 0.00mi | 2/2.0 | 1,344 (-8%) | 17mo | $126,000 | $94 | 72 |
| 15500 Bubbling Wells Rd #253 | 0.13mi | 2/2.0 | 1,610 (+10%) | 6mo | $48,000 | $30 | 72 |
| 15500 Bubbling Wells Rd #108 | 0.13mi | 2/2.0 | 1,296 (-12%) | 17mo | $95,000 | $73 | 61 |
| 67644 San Andreas St | 0.36mi | 3/2.0 (+1) | 1,586 (+8%) | 7mo | $275,000 | $173 | 58 |
| 16160 Avenida Mirola | 0.40mi | 3/2.0 (+1) | 1,344 (-8%) | 14mo | $318,000 | $237 | 51 |
Match score weights: distance 35% · size 25% · config 20% · recency 20%. Top-matched comps best support the ARV.
Projected returns pro-forma
-3.0% appreciation · 3.66% rent growth · sell at horizon
- IRR
- —
- Equity multiple
- 5.91×
- Total profit
- $89,299
- Equity at exit
- $9,692
- IRR
- —
- Equity multiple
- 12.63×
- Total profit
- $211,753
- Equity at exit
- $5,620
Cash invested: $18,200 (down + closing). Projections, not guarantees.
Landlord ↔ Tenant lean methodology
- Overall (STATE)
- 18 Strongly Tenant-Friendly
- State California
- 18 Strongly Tenant-Friendly · D+13
- County
- — inherits STATE
- City
- — inherits STATE
ZIP-level market 92240
- Home prices YoY
- -19.6%
- Rents YoY
- 3.7%
- Active inventory
- 515
- Price-to-rent
- 2.0×
Monthly cashflow live
- Estimated rent
- $2,670 high interval (Pro) →
- Mortgage (P&I)
- −$341
- Tax est. 1.5%
- −$81 /mo · $975/yr
- Insurance
- −$27
- Flood insurance flood zone
- −$122 /mo · $1,468/yr
- HOA
- −$0
- Vacancy / Maint / Mgmt
- −$561
- Net cashflow
- $1,538
Break-even live
UW: 25.0% down · 7.5% · 30yr · 1.5% tax · 5.0% vac · 8.0% maint · 8.0% mgmt
Financing live
Cash to close
- Down payment
- $16,250
- Closing costs
- $1,950
- Reserves months
- —
- Total cash needed
- —
Loan-product check · same deal, 3 products live
Conventional
25% down · 7.5% · 30yr
- Down + closing
- —
- Monthly P&I
- —
- Monthly cashflow
- —
- DSCR
- —
- Eligible?
- —
Personal DTI + credit; lowest rate.
DSCR
20% down · 8.5% · 30yr
- Down + closing
- —
- Monthly P&I
- —
- Monthly cashflow
- —
- DSCR
- —
- Eligible?
- —
No personal income docs; deal must DSCR.
Hard money
10% down · 12.0% · 12mo
- Down + closing
- —
- Monthly P&I
- —
- Monthly cashflow
- —
- DSCR
- —
- Eligible?
- —
Short-term bridge; refi at stabilization.
Rent comps 9 comps
| Address | Beds | Baths | Sqft | Rent | $/sqft | DOM | Units | Dist |
|---|---|---|---|---|---|---|---|---|
| 15490 Avenue Rambla Unit NA Desert Hot Springs, CA | 3.0 | 2.0 | 1088 | $2,600 | $2.39 | 24d | 1 | 0.19mi |
| 15490 Avenida Rambla Desert Hot Springs, CA | 3.0 | 2.0 | 1088 | $2,600 | $2.39 | 44d | 1 | 0.19mi |
| 16087 Bubbling Wells Rd Desert Hot Springs, CA | 3.0 | 2.0 | 1850 | $5,000 | $2.70 | 44d | 1 | 0.27mi |
| 15300 Palm Dr Desert Hot Springs, CA | 3.0 | 2.0 | 1458 | $2,800 | $1.92 | 44d | 1 | 0.99mi |
| 13440 Quinta Way Unit 2 Desert Hot Springs, CA | 2.0 | 2.0 | 1032 | $2,000 | $1.94 | 44d | 1 | 1.16mi |
| 68160 Calle Blanco Desert Hot Springs, CA | 3.0 | 2.0 | 1331 | $2,500 | $1.88 | 44d | 1 | 1.26mi |
| 13235 Mountain View Rd Unit 2 Desert Hot Springs, CA | 3.0 | 2.0 | 1400 | $2,400 | $1.71 | 44d | 1 | 1.28mi |
| 13553 Avenida La Vis Desert Hot Springs, CA | 3.0 | 2.0 | 1625 | $2,495 | $1.54 | 44d | 1 | 1.28mi |
| 12920 Inaja St Unit C Desert Hot Springs, CA | 2.0 | 2.0 | 1000 | $1,895 | $1.90 | 44d | 1 | 1.38mi |
Listing history 19 events
-
2026-06-18days on market $65,000 Active 61 DOM
-
2026-06-17days on market $65,000 Active 60 DOM
-
2026-06-16days on market $65,000 Active 59 DOM
-
2026-06-15days on market $65,000 Active 58 DOM
-
2026-06-13days on market $65,000 Active 56 DOM
-
2026-06-13days on market $65,000 Active 55 DOM
-
2026-06-09days on market $65,000 Active 52 DOM
-
2026-06-08days on market $65,000 Active 51 DOM
-
2026-06-07days on market $65,000 Active 50 DOM
-
2026-06-04days on market $65,000 Active 47 DOM
-
2026-06-03days on market $65,000 Active 46 DOM
-
2026-06-02days on market $65,000 Active 45 DOM
-
2026-06-01days on market $65,000 Active 44 DOM
-
2026-05-31days on market $65,000 Active 43 DOM
-
2026-04-18$65,000 Active 146-char remark
Show marketing remark (146 chars)
Super clean, open floor plan, with updated kitchen, newer a/c and heating. Newer front deck, corner lot with extra off-street parking and storage.
-
2003-05-01historical
-
2003-04-07$25,900
-
2001-11-30historical
-
2001-10-23$19,950
ⓘ Source: listings_history table (triggers on properties + properties_extension) + one-shot
backfill from property_details.listing_events for pre-trigger history.
Climate risk First Street
- Flood 1/10 Low FEMA zone AO · 0% chance over 30 yrs
- Wildfire 5/10 Major
- Heat 8/10 Severe 2 d/yr ≥111°F today · 6 d/yr by 30 yrs out
- Wind 1/10 Low
- Air quality 5/10 Major 8 unhealthy d/yr today · 11 by 30 yrs out
Nearby sold comps map
Loading sold comps map…
Walkable amenities ~0.75 mi
Loading nearby amenities…
Taxation est. · year 1
- Rental income
- $32,037
- − Mortgage interest
- −$3,641
- − Property taxes
- −$975
- − Insurance
- −$1,792
- − Repairs & maintenance
- −$2,563
- − Management
- −$2,563
- − Depreciation
- −$1,891
- Taxable income
- $18,612
- Est. tax owed @ 24.0%
- −$4,467
- After-tax cash flow
- $13,985/yr
For passive investors: Depreciation is non-cash, so a rental often shows a tax loss while cash-flowing — sheltering income. Rental losses are passive: they offset passive income freely, and up to $25,000/yr can offset ordinary (W-2) income if you actively participate and your MAGI is under $100k (phasing out to $0 by $150k); unused losses carry forward. On sale, claimed depreciation is recaptured at up to 25%, and gains may owe capital-gains tax (a 1031 exchange can defer both). Figures are a year-1 estimate at your 24.0% rate — not tax advice; consult a CPA.
Schools (NCES district)
- District
- Palm Springs Unified
- NCES district ID
- 0629550
- Math proficiency
- 21% ▼ -7.00%
- Reading proficiency
- 42% ▬ 0.00%
- Median HH income
- $43,638
- Composite
- 26.76/100
- National rank
- #7131
- State rank
- #328 of 517 in CA
Livability — Garnet
- Score
- 53/100
- State rank
- #971
- US rank
- #24574
Category grades
Schools grade is shown separately in the Schools card above.
Census & demographics
- Census place
- Garnet, CA
- County
- Riverside County · 2,287,001 people
- Metro
- Riverside-San Bernardino-Ontario, CA
- Population (ZIP)
- 41,615
- Household income
- $54,023
- Rent vs Own
- Severe rent burden
- 2095.0
Population outlook (Riverside County) Hauer SSP2
- Today (2025)
- 2,664,475 people
- By 2030
- 2,802,692 · +5.2%
- By 2040
- 3,050,904 · +14.5%
- By 2050
- 3,256,783 · +22.2%
- By 2075
- 3,655,058 · +37.2%
- By 2100
- 3,766,594 · +41.4%
Race, ethnicity, and origin ACS 2023
- Neighborhood character
- Majority Hispanic (64%)
- Race & ethnicity
- Hispanic / Latino 64% Two or more races 27% White 23% Black 7% Native American 2% Asian 2%
- Hispanic origin (detail)
- Mexican 53%
- Common ancestry
- Lithuanian 1% Romanian 1% Italian 1%
- Foreign-born
- 27% · Canada, Vietnam
- Languages at home
- 47% English-only · Spanish 50% Russian/Polish/Slavic 1%
Political lean MEDSL · Riverside
- 2024 margin
- Toss-up / Even · D 48.0% · R 49.3% · Other 2.6%
- 2008→2024 swing
- -3.6pp toward R · 2008: 2.3pp · 2024: -1.3pp
- All cycles
- 2024: R+1.3 2020: D+8.0 2016: D+4.3 2012: R+0.4 2008: D+2.3
Not yet ingested
- Civics
- —
Market trends
- HPI YoY
- ▼ -102.10%
- Current HPI
- 418.4691
- Rent YoY
- ▲ 3.66%
- Metro
- Riverside-San Bernardino-Ontario, CA
- State GDP YoY
- ▲ 3.21%
- F500 in state
- 116
Industry mix (Fortune 500 HQ in CA)
| Industry | F500 HQs | Revenue |
|---|---|---|
| Technology | 27 | $1,492B |
|
||
| Financial Services | 3 | $174B |
|
||
| Retail | 3 | $44B |
|
||
| Insurance | 3 | $26B |
|
||
| Media / Entertainment | 2 | $115B |
|
||
| Pharmaceuticals / Biotech | 2 | $62B |
|
||
Price history
+225.8% since first listed5 events — show timeline
- 2026-04-18 Listed $65,000 CRMLS
- 2003-05-01 Listing Removed — GPSMLS
- 2003-04-07 Listed $25,900 GPSMLS
- 2001-11-30 Listing Removed — GPSMLS
- 2001-10-23 Listed $19,950 GPSMLS
Property tax history
-3.8%/yrLatest (2025): $106 · -0.6% YoY. Source: county tax records.
Cash-flow waterfall
monthlySold comps — $/sqft
last 12 mo · ≤1 miLoading sold comps…