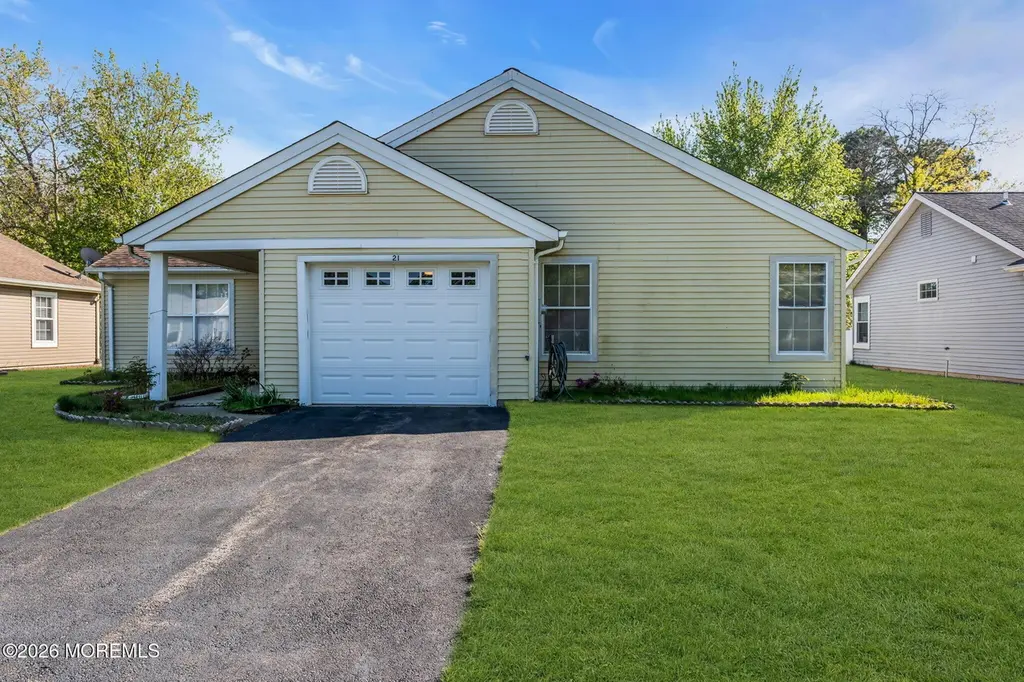
21 Hastings Dr · Forked River, NJ
Flood risk 1/10 · Minimal
- FEMA flood zone
- X (unshaded)
- Chance of flooding over 30 yrs
- 0.0%
- Est. flood insurance / yr
- $507 – $1,088
Fire risk 4/10 · Minor
- Est. fire insurance / yr
- $526 – $976
Heat risk 7/10 · Major
- Hot days now (above 98°F)
- 7 days/yr
- Hot days in 30 yrs
- 15 days/yr
Wind risk 6/10 · Moderate
- Chance of severe wind over 30 yrs
- 75.0%
Air-quality risk 2/10 · Minimal
- Unhealthy air days now
- 1 days/yr
- Unhealthy air days in 30 yrs
- 3 days/yr
Risk factors via First Street. Map © Google.
Why this score? — see what drove the C- grade
The composite is a weighted blend of 9 inputs, each scored 0–100. Each bar is that input's sub-score; the figure is the points it added to the 100-point composite (weight × sub-score).
- Cash flow +17.6/30.0
- ARV discount +14.4/15.0
- DSCR +5.5/10.0
- 1% rule +5.0/10.0
- Livability +3.1/5.0
- Schools +3.0/10.0
- Rent growth +2.5/5.0
- Condition / age +2.5/5.0
- Appreciation +0.0/10.0
$330,000
🖨 Deal sheet 📄 Offer letter ✓ Due diligence
Listing remarks
Welcome to Pheasant Run at Forked River, an Active Adult Community in Lacey Township. This Davenport model offers 1404 Sq. Ft. of comfortable living space, featuring both formal living and dining rooms and an eat-in kitchen. Residents of Pheasant Run can enjoy a beautiful clubhouse, outdoor pool, tennis and bocce courts and many other activities.
Key facts
- Outdoor pool
- Bocce courts
- Beautiful clubhouse
Tags
Property features AI
Finance
- HOA & community: Homeowners association; Quarterly association fee; Association amenities include exercise room, community room, clubhouse, pool, bocce, and common areas; Association fee covers common area and pool
Exterior
- Parking: Attached 1-car garage
- Utilities: Public sewer
- Home design: Model: Davenport; Fee simple ownership
- Exterior features: Shingle roof
Interior
- Kitchen: Dishwasher; Stove; Stove hood; Refrigerator
- Bedrooms: 2 bedrooms
- Flooring: Ceramic tile
- Bathrooms: 2 full bathrooms
- Heating & cooling: Forced air heating; Central air conditioning
- Interior features: Outdoor lighting; Washer included; Dryer included; Window treatments; Light fixtures; Attic fan; Garage door opener; Gas cooking
- Laundry & utility: Washer; Dryer
Neighborhood map
What this means for you Summary
Snapshot
- This is a 2-bed/2.0-bath single-family listed at $330k.
Deal economics
- At list price, monthly cash flow is $262 ($3k/yr) — positive.
- The deal already cash-flows at list — no discount required.
- To meet the 1% rule (rent ≥ 1% of price), the offer needs to be $329k (0.4% below list).
- Recommended offer: $320k (3.0% below list) — sets the bar for market timing.
- Cap rate 7.2% vs local median 3.2% in Forked River — top-decile yield for the area; either an underpriced asset or a hidden risk that comps aren't pricing in. Stress-test before assuming the spread holds.
Location & tenants
- Location reads 61/100 on livability (#464 in NJ) — a middle-class / working-renter tenant base. Strengths: housing A+, crime A-, employment A-; Watch: amenities F, commute F, cost of living F.
- Lacey Township School District (suburban): math 22% / reading 43% proficiency, ranked #299 of 472 in NJ (top 63%) — families likely to look elsewhere, expect single-tenant / working-renter base with shorter leases; only 19% free/reduced lunch — higher-income household profile.
- Market conditions: 190 active listings in the ZIP; 4,434 units permitted in Ocean County in 2024 (868 in 5+ unit buildings).
Forward outlook
- Local home prices are declining (-3.0%/yr); year-one equity from $2k of loan paydown is wiped out by about $10k of value loss. Plan a longer hold.
- Ocean County population projected to shrink 8% by 2050 — rents likely to lag national; underwrite the cash flow, not the appreciation.
Negotiation context
- It's been on market 38 days — a 3% lower offer ($320k) is reasonable based on typical stale-listing flexibility.
- Current owner paid $74k; list at $330k implies a 347% gain — meaningful room to come down on a strong offer.
Risks & watch-outs
- Climate carrying-cost: major wind risk, 75% chance of damaging wind over 30y; extreme-heat days projected 7→15/yr by 2055 (HVAC capex compounding) — expect insurance premiums to compound above CPI over the hold.
Questions for the listing agent
- It's been on market 38 days. Have you received any prior offers? Is the seller open to a 3% concession, seller financing, or rate buy-down credit?
- What does the HOA fee cover, when was the last increase, and are there any pending special assessments or reserve-fund shortfalls?
- Is there a deadline driving the sale (1031 exchange, divorce, estate, relocation)? That informs how much negotiation room exists.
- What's the average days-on-market for RENTAL listings here right now (not sales)? A rising rental-DOM trend means longer vacancies and softer asking-rent achievability than the comps imply.
- What's the recent tenant-quality profile in this submarket — average credit score on applications, eviction rate, late-payment / NSF rate, and stable-employment percentage? A property-management company in the area should have these aggregated.
- How much new for-sale + rental construction is in the pipeline within 1–3 miles? Heavy new supply typically softens prices + rents 12–24 months out; constrained supply supports both.
Investment metrics
- 1% rule
- 1.00% ✗
- Cap rate
- 7.25%
- Cash-on-cash
- 3.41%
- DSCR
- 1.15
- GRM
- 8.4
CMA / ARV
- ARV (median comp)
- $389,768
- List price
- $330,000
- Delta
- -15.33%
- Verdict
- UNDERPRICED
- Comps
- 20 within 1.0 mi
Show comp detail 12 sales within ~0.75 mi
| Address | Dist | Beds/Ba | Sqft | Sold | Price | $/sf | Match |
|---|---|---|---|---|---|---|---|
| 69 Canterbury Dr | 0.11mi | 2/2.0 | 1,405 (+0%) | 2mo | $385,000 | $274 | 93 |
| 5 Portsmouth | 0.16mi | 2/2.0 | 1,404 (0%) | 8mo | $335,000 | $239 | 86 |
| 1988 Brookdale Dr | 0.24mi | 2/2.0 | 1,416 (+1%) | 3mo | $425,000 | $300 | 85 |
| 4 Kent Ct | 0.26mi | 2/2.0 | 1,416 (+1%) | 3mo | $410,000 | $290 | 84 |
| 2099 Llewellyn Pkwy | 0.11mi | 2/2.0 | 1,470 (+5%) | 10mo | $440,000 | $299 | 78 |
| 2028 Brookdale Dr | 0.33mi | 2/2.0 | 1,405 (+0%) | 8mo | $345,000 | $246 | 78 |
| 38 Sheffield Dr | 0.58mi | 2/2.0 | 1,405 (+0%) | 3mo | $435,000 | $310 | 70 |
| 20 Norwick Dr | 0.29mi | 2/2.0 | 1,232 (-12%) | 0mo | $280,000 | $227 | 66 |
| 40 Canterbury Dr | 0.25mi | 2/2.0 | 1,224 (-13%) | 10mo | $361,800 | $296 | 59 |
| 1734 Lakeside Dr S | 0.72mi | 2/1.5 | 1,430 (+2%) | 9mo | $480,000 | $336 | 54 |
| 1660 Joffre Rd | 0.46mi | 3/2.0 (+1) | 1,560 (+11%) | 1mo | $530,000 | $340 | 54 |
| 1991 Glen Oak Dr | 0.73mi | 3/2.0 (+1) | 1,308 (-7%) | 5mo | $495,000 | $378 | 46 |
Match score weights: distance 35% · size 25% · config 20% · recency 20%. Top-matched comps best support the ARV.
Projected returns pro-forma
-3.0% appreciation · 3.0% rent growth · sell at horizon
- IRR
- -10.9%
- Equity multiple
- 0.60×
- Total profit
- $-36,689
- Equity at exit
- $49,204
- IRR
- -1.6%
- Equity multiple
- 0.89×
- Total profit
- $-10,105
- Equity at exit
- $28,532
Cash invested: $92,400 (down + closing). Projections, not guarantees.
Landlord ↔ Tenant lean methodology
- Overall (STATE)
- 21 Tenant-Leaning
- State New Jersey
- 21 Tenant-Leaning · D+6
- County
- — inherits STATE
- City
- — inherits STATE
ZIP-level market 08731
- Active inventory
- 190
- Price-to-rent
- 8.4×
Monthly cashflow live
- Estimated rent
- $3,287 medium interval (Pro) →
- Mortgage (P&I)
- −$1,731
- Tax from tax record
- −$396 /mo · $4,756/yr
- Insurance
- −$138
- HOA
- −$70
- Vacancy / Maint / Mgmt
- −$690
- Net cashflow
- $262
Break-even live
UW: 25.0% down · 7.5% · 30yr · 1.5% tax · 5.0% vac · 8.0% maint · 8.0% mgmt
Financing live
Cash to close
- Down payment
- $82,500
- Closing costs
- $9,900
- Reserves months
- —
- Total cash needed
- —
Loan-product check · same deal, 3 products live
Conventional
25% down · 7.5% · 30yr
- Down + closing
- —
- Monthly P&I
- —
- Monthly cashflow
- —
- DSCR
- —
- Eligible?
- —
Personal DTI + credit; lowest rate.
DSCR
20% down · 8.5% · 30yr
- Down + closing
- —
- Monthly P&I
- —
- Monthly cashflow
- —
- DSCR
- —
- Eligible?
- —
No personal income docs; deal must DSCR.
Hard money
10% down · 12.0% · 12mo
- Down + closing
- —
- Monthly P&I
- —
- Monthly cashflow
- —
- DSCR
- —
- Eligible?
- —
Short-term bridge; refi at stabilization.
HOA detail
- Monthly dues
- $70 · $840/yr
- Likely covers
- pool
Listing history 15 events
-
2026-06-18days on market $330,000 Active 38 DOM
-
2026-06-17days on market $330,000 Active 37 DOM
-
2026-06-16days on market $330,000 Active 36 DOM
-
2026-06-15days on market $330,000 Active 35 DOM
-
2026-06-13pricedays on market $330,000 Active 33 DOM
-
2026-06-09days on market $350,000 Active 29 DOM
-
2026-06-08days on market $350,000 Active 28 DOM
-
2026-06-07days on market $350,000 Active 27 DOM
-
2026-06-04days on market $350,000 Active 24 DOM
-
2026-06-03days on market $350,000 Active 23 DOM
-
2026-06-02days on market $350,000 Active 22 DOM
-
2026-06-01days on market $350,000 Active 21 DOM
-
2026-05-31days on market $350,000 Active 20 DOM
-
2026-05-11$350,000 Active 350-char remark
-
1986-03-31soldstatus $73,900
ⓘ Source: listings_history table (triggers on properties + properties_extension) + one-shot
backfill from property_details.listing_events for pre-trigger history.
Tax reassessment forecast NJ · Partial reset (capped growth)
- Current annual tax
- $4,756 · $396/mo
- Projected year-2 tax
- $6,487 · $541/mo
- Expected delta
- +$1,730/yr (+$144/mo · 36.4%)
ⓘ Screening estimate from a state-policy table — verify with the county assessor before closing.
Climate risk First Street
- Flood 1/10 Low FEMA zone X (unshaded) · 0% chance over 30 yrs
- Wildfire 4/10 Moderate
- Heat 7/10 Severe 7 d/yr ≥98°F today · 15 d/yr by 30 yrs out
- Wind 6/10 Major 75% chance of damaging wind over 30 yrs
- Air quality 2/10 Low 1 unhealthy d/yr today · 3 by 30 yrs out
Nearby sold comps map
Loading sold comps map…
Walkable amenities ~0.75 mi
Loading nearby amenities…
Taxation est. · year 1
- Rental income
- $39,443
- − Mortgage interest
- −$18,485
- − Property taxes
- −$4,756
- − Insurance
- −$1,650
- − Repairs & maintenance
- −$3,155
- − Management
- −$3,155
- − HOA
- −$840
- − Depreciation
- −$9,600
- Taxable loss
- −$2,199
- Est. tax savings @ 24.0%
- +$528
- After-tax cash flow
- $3,675/yr
For passive investors: Depreciation is non-cash, so a rental often shows a tax loss while cash-flowing — sheltering income. Rental losses are passive: they offset passive income freely, and up to $25,000/yr can offset ordinary (W-2) income if you actively participate and your MAGI is under $100k (phasing out to $0 by $150k); unused losses carry forward. On sale, claimed depreciation is recaptured at up to 25%, and gains may owe capital-gains tax (a 1031 exchange can defer both). Figures are a year-1 estimate at your 24.0% rate — not tax advice; consult a CPA.
Schools (NCES district)
- District
- Lacey Township School District
- NCES district ID
- 3408100
- Math proficiency
- 22% ▼ -18.00%
- Reading proficiency
- 43% ▼ -11.00%
- Median HH income
- $73,331
- Composite
- 30.42/100
- National rank
- #6242
- State rank
- #299 of 472 in NJ
Livability — Forked River
- Score
- 61/100
- State rank
- #464
- US rank
- #17753
Category grades
Schools grade is shown separately in the Schools card above.
Census & demographics
- Population (ZIP)
- 21,136
Population outlook (Ocean County) Hauer SSP2
- Today (2025)
- 586,991 people
- By 2030
- 581,403 · -1.0%
- By 2040
- 564,913 · -3.8%
- By 2050
- 538,149 · -8.3%
- By 2075
- 468,845 · -20.1%
- By 2100
- 350,297 · -40.3%
Race, ethnicity, and origin ACS 2023
- Neighborhood character
- Predominantly White (82%)
- Race & ethnicity
- White 82% Hispanic / Latino 15% Two or more races 6%
- Hispanic origin (detail)
- Mexican 2% Puerto Rican 8%
- Common ancestry
- Romanian 12% Slovak 2% Scotch-Irish 2%
- Foreign-born
- 6% · Canada
- Languages at home
- 92% English-only · Spanish 4% Other Indo-European 1% Russian/Polish/Slavic 1%
Political lean MEDSL · Ocean
- 2024 margin
- Solid R (+36.0) · D 31.4% · R 67.4% · Other 1.2%
- 2008→2024 swing
- -17.6pp toward R · 2008: -18.4pp · 2024: -36.0pp
- All cycles
- 2024: R+36.0 2020: R+28.7 2016: R+34.0 2012: R+17.7 2008: R+18.4
Not yet ingested
- Civics
- —
Market trends
- HPI YoY
- ▼ -328.91%
- Current HPI
- 352.355
- Rent YoY
- —
- Metro
- —
- State GDP YoY
- ▲ 2.05%
- F500 in state
- 34
Industry mix (Fortune 500 HQ in NJ)
| Industry | F500 HQs | Revenue |
|---|---|---|
| Consumer Goods | 3 | $31B |
|
||
| Pharmaceuticals | 2 | $153B |
|
||
| Technology | 2 | $21B |
|
||
| Insurance | 2 | $20B |
|
||
| Healthcare | 2 | $19B |
|
||
| Financial Services | 1 | $70B |
|
||
Price history
+346.5% since first listed3 events — show timeline
- 2026-06-11 Price Changed $330,000 MOMLS
- 2026-05-11 Listed $350,000 MOMLS
- 1986-03-31 Sold (Public Records) $73,900 Public Records
Property tax history
+4.5%/yrLatest (2025): $4,756 · +7.9% YoY. Source: county tax records.
Cash-flow waterfall
monthlySold comps — $/sqft
last 12 mo · ≤1 miLoading sold comps…