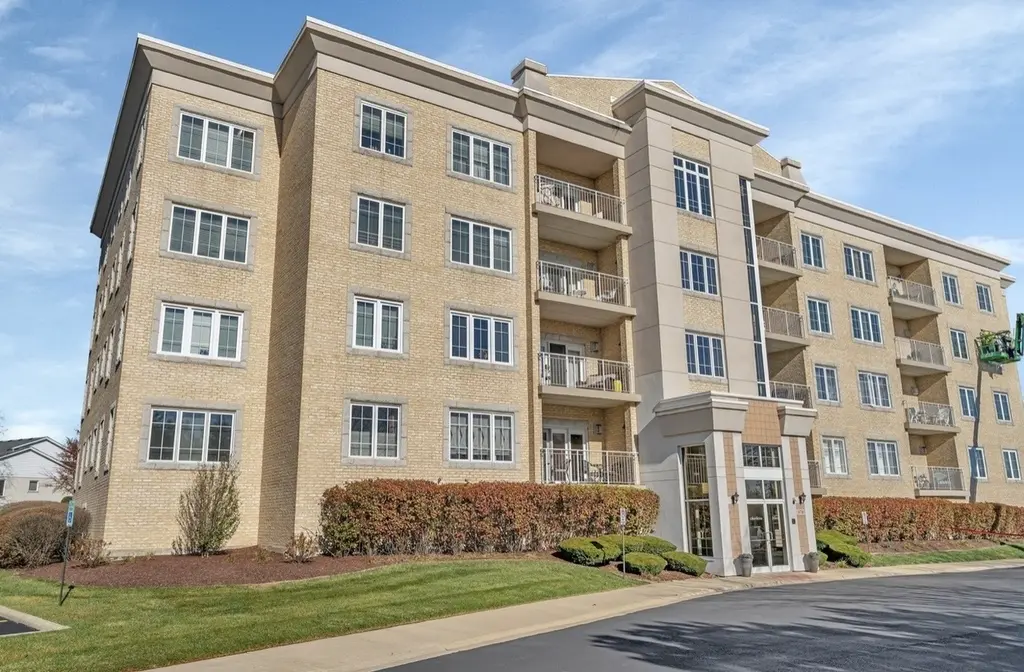
9730 Koch Ct Unit 2F · Orland Park, IL
Flood risk 1/10 · Minimal
- FEMA flood zone
- X (unshaded)
- Chance of flooding over 30 yrs
- 0.0%
- Est. flood insurance / yr
- $507 – $1,088
Fire risk 1/10 · Minimal
- Est. fire insurance / yr
- $804 – $1,492
Heat risk 3/10 · Minor
- Hot days now (above 102°F)
- 7 days/yr
- Hot days in 30 yrs
- 15 days/yr
Wind risk 2/10 · Minimal
- Chance of severe wind over 30 yrs
- 0.0%
Air-quality risk 2/10 · Minimal
- Unhealthy air days now
- 1 days/yr
- Unhealthy air days in 30 yrs
- 1 days/yr
Risk factors via First Street. Map © Google.
Why this score? — see what drove the D- grade
The composite is a weighted blend of 9 inputs, each scored 0–100. Each bar is that input's sub-score; the figure is the points it added to the 100-point composite (weight × sub-score).
- Cash flow +10.1/30.0
- ARV discount +7.5/15.0
- 1% rule +4.5/10.0
- Livability +4.2/5.0
- Schools +3.4/10.0
- DSCR +2.9/10.0
- Rent growth +2.5/5.0
- Condition / age +2.5/5.0
- Appreciation +0.0/10.0
$299,999
🖨 Deal sheet (PDF) 📄 Offer letter ✓ Due diligence
Listing remarks MLS
Orland Park premier luxury 2br/2ba condo! Stunning glass elevator bldg w/ underground heated parking garage! Bright, spacious rooms and baths, gorgeous granite kitchen with separate dining area, fireplace, 9 ft ceilings, balcony, washer/dryer and more! Must see! Vacant, easy to show. As-is.
Key facts
- Covered balcony
- In unit laundry room
- New appliances
Tags
Property features AI
Finance
- Other: Building contains 24 units; Living area per assessor
- HOA & community: Monthly association fee of $305 covering insurance, exterior maintenance, lawn care, trash service and snow removal; Association amenities include storage, service elevators, elevators and security door locks; Pets not allowed
Exterior
- Parking: Attached heated garage with garage door opener (1 garage space; 1 total parking)
- Security: Building has security door locks
- Utilities: Water from Lake Michigan / public; Public sewer with storm sewer
- Home design: Attached single condo; Entry on 2nd level; Approximately 21–25 years old; Rehab completed in 2018
- Construction: Brick construction
- Exterior features: Balcony; Condo setting
Interior
- Kitchen: Range; Microwave; Dishwasher; Refrigerator
- Bedrooms: Master bedroom (main level) — 20 x 14, includes full bath; Additional bedroom (main level) — 12 x 12
- Flooring: Engineered hardwood in living room, dining room, kitchen and bedrooms
- Bathrooms: 2 full bathrooms
- Heating & cooling: Natural gas forced-air heating; Central air conditioning
- Interior features: 5 total rooms; Balcony; Gas-log fireplace with gas starter in family room
- Laundry & utility: In-unit laundry (washer and dryer included)
Neighborhood map
What this means for you Summary
Snapshot
- This is a 2-bed/2.0-bath condo listed at $300k.
Deal economics
- At list price, monthly cash flow is $-178 ($-2k/yr) — negative.
- To cash-flow at today's rent, offer at most $269k (10.5% below list).
- To meet the 1% rule (rent ≥ 1% of price), the offer needs to be $286k (4.7% below list).
- Recommended offer: $269k (10.5% below list) — sets the bar for cash-flow.
- Cap rate 5.6% vs local median 4.5% in Orland Park — meaningfully above typical; check what's discounted (condition, days-on-market, listing class) to confirm the premium yield is real.
Location & tenants
- Location reads 85/100 on livability (#29 in IL, #529 nationally) — a professional / high-income tenant draw. Strengths: crime A+, amenities A+, commute A+.
- Cons Hsd 230 (suburban): math 35% / reading 39% proficiency, ranked #146 of 620 in IL (top 24%) — families likely to look elsewhere, expect single-tenant / working-renter base with shorter leases.
- Zoned schools: Fernway Park Elem School (math 32% / reading 17%, grade F, #850 of 2,056 statewide, top 45%, 348 students, 0% FRL); Prairie View Middle School (math 43% / reading 43%, grade D-, #107 of 665 statewide, top 16%, 605 students, 0% FRL); Victor J Andrew High School (math 32% / reading 36%, grade F, #147 of 693 statewide, top 22%, 2,259 students, 0% FRL).
- Market conditions: 118 active listings in the ZIP; 9 comparable units currently listed for rent nearby; rentals leasing fast (median 12d on market — plan ~1-2 weeks tenant-placement turnaround); 6,272 units permitted in Cook County in 2024 (4,658 in 5+ unit buildings).
Forward outlook
- Local home prices are declining (-3.0%/yr); year-one equity from $2k of loan paydown is wiped out by about $9k of value loss. Plan a longer hold.
Negotiation context
- Only 9 days on market — expect competitive offers; lowballing is unlikely to land.
- 2 sale attempts since 17y ago with the ask held roughly flat each time — persistent listings suggest the price (not the market) is what's stuck; bring a comps-based counter.
- Current owner paid $198k; list at $300k implies a 52% gain — meaningful room to come down on a strong offer.
Questions for the listing agent
- What do current leases actually rent for vs. the listed asking? Can we see a recent rent roll and the last 12 months of T-12 income?
- What does the HOA fee cover, when was the last increase, and are there any pending special assessments or reserve-fund shortfalls?
- Any open or pending special assessments — roof, HVAC, plumbing, elevator, façade? What's the per-unit balance and payoff schedule, and is the seller paying it off at close or rolling it to the buyer?
- Is there a deadline driving the sale (1031 exchange, divorce, estate, relocation)? That informs how much negotiation room exists.
- The area grade is low — what's the realistic commute time and amenity access for the typical tenant pool here? Any planned neighborhood developments (good or bad) we should know about?
- What's the average days-on-market for RENTAL listings here right now (not sales)? A rising rental-DOM trend means longer vacancies and softer asking-rent achievability than the comps imply.
- What's the recent tenant-quality profile in this submarket — average credit score on applications, eviction rate, late-payment / NSF rate, and stable-employment percentage? A property-management company in the area should have these aggregated.
- How much new apartment / multifamily construction is in the pipeline within 1–3 miles? Heavy new supply (>2% of stock underway) typically softens rents 12–24 months out; light construction supports rent growth.
Investment metrics
- 1% rule
- 0.95% ✗
- Cap rate
- 5.58%
- Cash-on-cash
- -2.54%
- DSCR
- 0.89
- GRM
- 8.7
CMA / ARV
No comps found within radius.
Projected returns pro-forma
-3.0% appreciation · 3.0% rent growth · sell at horizon
- IRR
- -20.4%
- Equity multiple
- 0.29×
- Total profit
- $-59,679
- Equity at exit
- $44,731
- IRR
- -13.3%
- Equity multiple
- 0.22×
- Total profit
- $-65,475
- Equity at exit
- $25,938
Cash invested: $84,000 (down + closing). Projections, not guarantees.
Landlord ↔ Tenant lean methodology
- Overall (STATE)
- 43 Moderately Tenant-Leaning
- State Illinois
- 43 Moderately Tenant-Leaning · D+7
- County
- — inherits STATE
- City
- — inherits STATE
ZIP-level market 60467
- Home prices YoY
- -30.4%
- Active inventory
- 118
- Price-to-rent
- 8.7×
Monthly cashflow live
- Estimated rent
- $2,860 high interval (Pro) →
- Mortgage (P&I)
- −$1,573
- Tax from tax record
- −$434 /mo · $5,210/yr
- Insurance
- −$125
- HOA
- −$305
- Vacancy / Maint / Mgmt
- −$601
- Net cashflow
- $-178
Break-even live
Sensitivity live
| Price | -10% $-8 | -5% $-93 | +0% $-178 | +5% $-263 | +10% $-348 |
|---|---|---|---|---|---|
| Rent | -10% $-404 | -5% $-291 | +0% $-178 | +5% $-65 | +10% $48 |
| Rate | -1.0pp $-27 | -0.5pp $-102 | base $-178 | +0.5pp $-256 | +1.0pp $-335 |
UW: 25.0% down · 7.5% · 30yr · 1.5% tax · 5.0% vac · 8.0% maint · 8.0% mgmt
Financing live
Cash to close
- Down payment
- $75,000
- Closing costs
- $9,000
- Reserves months
- —
- Total cash needed
- —
Loan-product check · same deal, 3 products live
Conventional
25% down · 7.5% · 30yr
- Down + closing
- —
- Monthly P&I
- —
- Monthly cashflow
- —
- DSCR
- —
- Eligible?
- —
Personal DTI + credit; lowest rate.
DSCR
20% down · 8.5% · 30yr
- Down + closing
- —
- Monthly P&I
- —
- Monthly cashflow
- —
- DSCR
- —
- Eligible?
- —
No personal income docs; deal must DSCR.
Hard money
10% down · 12.0% · 12mo
- Down + closing
- —
- Monthly P&I
- —
- Monthly cashflow
- —
- DSCR
- —
- Eligible?
- —
Short-term bridge; refi at stabilization.
Rent comps 9 comps
| Address | Beds | Baths | Sqft | Rent | $/sqft | DOM | Units | Dist |
|---|---|---|---|---|---|---|---|---|
| 16610 Liberty Cir Unit 1N Orland Park, IL | 2.0 | 2.0 | 1200 | $2,400 | $2.00 | 0d | 1 | 0.34mi |
| 9147 Boardwalk Ter Orland Hills, IL | 3.0 | 2.0 | 2076 | $3,500 | $1.69 | 22d | 1 | 0.72mi |
| 9309 Wherry Ln Orland Park, IL | 2.0 | 2.5 | 1500 | $2,525 | $1.68 | 26d | 1 | 1.21mi |
| 16450 Cherry Hill Ave Tinley Park, IL | 3.0 | 2.0 | 1370 | $3,100 | $2.26 | 9d | 1 | 1.45mi |
| 15826 Farm Hill Dr Orland Park, IL | 3.0 | 1.5 | 1500 | $2,500 | $1.67 | 12d | 1 | 1.46mi |
| 9234 Windsor Pkwy Tinley Park, IL | 3.0 | 2.0 | 1800 | $3,200 | $1.78 | 16d | 1 | 1.47mi |
| 10608 Alice Mae Ct Orland Park, IL | 3.0 | 3.5 | 2200 | $3,708 | $1.69 | 26d | 1 | 1.49mi |
| 16180 Apple Ln #2 Tinley Park, IL | 3.0 | 2.5 | 1250 | $2,900 | $2.32 | 6d | 1 | 1.49mi |
| 10600 Alice Mae Ct Unit 10604 Orland Park, IL | 3.0 | 3.5 | 2200 | $3,300 | $1.50 | 1d | 1 | 1.49mi |
HOA detail condo
- Monthly dues
- $305 · $3,660/yr
- Assessments
- None detected in remarks — confirm with the listing agent.
Listing history 7 events
-
2026-05-18status Pending
-
2026-05-11historical Contingent - Continue to Show
-
2026-05-09$299,999 Active
-
2009-09-30soldstatus $198,000 Closed Sale 291-char remark
Show marketing remark (291 chars)
Orland Park premier luxury 2br/2ba condo! Stunning glass elevator bldg w/ underground heated parking garage! Bright, spacious rooms and baths, gorgeous granite kitchen with separate dining area, fireplace, 9 ft ceilings, balcony, washer/dryer and more! Must see! Vacant, easy to show. As-is.
-
2009-09-05historical Contingent 291-char remark
Show marketing remark (291 chars)
Orland Park premier luxury 2br/2ba condo! Stunning glass elevator bldg w/ underground heated parking garage! Bright, spacious rooms and baths, gorgeous granite kitchen with separate dining area, fireplace, 9 ft ceilings, balcony, washer/dryer and more! Must see! Vacant, easy to show. As-is.
-
2009-08-28$189,500 New 291-char remark
Show marketing remark (291 chars)
Orland Park premier luxury 2br/2ba condo! Stunning glass elevator bldg w/ underground heated parking garage! Bright, spacious rooms and baths, gorgeous granite kitchen with separate dining area, fireplace, 9 ft ceilings, balcony, washer/dryer and more! Must see! Vacant, easy to show. As-is.
-
2006-11-24soldstatus $285,000
ⓘ Source: listings_history table (triggers on properties + properties_extension) + one-shot
backfill from property_details.listing_events for pre-trigger history.
Tax reassessment forecast IL · Partial reset (capped growth)
- Current annual tax
- $5,210 · $434/mo
- Projected year-2 tax
- $6,010 · $501/mo
- Expected delta
- +$800/yr (+$67/mo · 15.4%)
ⓘ Screening estimate from a state-policy table — verify with the county assessor before closing.
Climate risk First Street
- Flood 1/10 Low FEMA zone X (unshaded) · 0% chance over 30 yrs
- Wildfire 1/10 Low
- Heat 3/10 Moderate 7 d/yr ≥102°F today · 15 d/yr by 30 yrs out
- Wind 2/10 Low 0% chance of damaging wind over 30 yrs
- Air quality 2/10 Low 1 unhealthy d/yr today · 1 by 30 yrs out
Nearby sold comps map
Loading sold comps map…
Walkable amenities ~0.75 mi
Loading nearby amenities…
Taxation est. · year 1
- Rental income
- $34,320
- − Mortgage interest
- −$16,805
- − Property taxes
- −$5,210
- − Insurance
- −$1,500
- − Repairs & maintenance
- −$2,746
- − Management
- −$2,746
- − HOA
- −$3,660
- − Depreciation
- −$8,727
- Taxable loss
- −$7,072
- Est. tax savings @ 24.0%
- +$1,697
- After-tax cash flow
- $-438/yr
For passive investors: Depreciation is non-cash, so a rental often shows a tax loss while cash-flowing — sheltering income. Rental losses are passive: they offset passive income freely, and up to $25,000/yr can offset ordinary (W-2) income if you actively participate and your MAGI is under $100k (phasing out to $0 by $150k); unused losses carry forward. On sale, claimed depreciation is recaptured at up to 25%, and gains may owe capital-gains tax (a 1031 exchange can defer both). Figures are a year-1 estimate at your 24.0% rate — not tax advice; consult a CPA.
Schools (NCES district)
- District
- Cons Hsd 230
- NCES district ID
- 1708400
- Math proficiency
- 35% ▼ -8.00%
- Reading proficiency
- 39% ▼ -6.00%
- Median HH income
- $73,953
- Composite
- 34.29/100
- National rank
- #5244
- State rank
- #146 of 620 in IL
Livability — Orland Park
- Score
- 85/100
- State rank
- #29
- US rank
- #529
Category grades
Schools grade is shown separately in the Schools card above.
Census & demographics
- Census place
- Orland Park, IL
- City population
- 41,456
- Population (ZIP)
- 24,952
Population outlook (Cook County) Hauer SSP2
- Today (2025)
- 5,347,519 people
- By 2030
- 5,357,703 · +0.2%
- By 2040
- 5,324,924 · -0.4%
- By 2050
- 5,230,762 · -2.2%
- By 2075
- 4,785,735 · -10.5%
- By 2100
- 4,188,836 · -21.7%
Race, ethnicity, and origin ACS 2023
- Neighborhood character
- Predominantly White (83%)
- Race & ethnicity
- White 83% Hispanic / Latino 6% Asian 5% Two or more races 4% Black 4%
- Hispanic origin (detail)
- Mexican 5%
- Common ancestry
- Romanian 15% Armenian 2% Iranian 2%
- Foreign-born
- 14% · Canada, South Korea, China
- Languages at home
- 78% English-only · Arabic 9% Russian/Polish/Slavic 4% Other Indo-European 4%
Political lean MEDSL · Cook
- 2024 margin
- Solid D (+42.0) · D 70.4% · R 28.4% · Other 1.2%
- 2008→2024 swing
- -11.4pp toward R · 2008: 53.4pp · 2024: 42.0pp
- All cycles
- 2024: D+42.0 2020: D+50.3 2016: D+53.0 2012: D+49.4 2008: D+53.4
Not yet ingested
- Civics
- —
Market trends
- HPI YoY
- ▼ -82.13%
- Current HPI
- 188.3676
- Rent YoY
- —
- Metro
- —
- State GDP YoY
- ▲ 1.59%
- F500 in state
- 60
Industry mix (Fortune 500 HQ in IL)
| Industry | F500 HQs | Revenue |
|---|---|---|
| Insurance | 4 | $201B |
|
||
| Consumer Goods | 4 | $87B |
|
||
| Industrial Machinery | 3 | $64B |
|
||
| Healthcare | 2 | $55B |
|
||
| Retail / Pharmacy | 1 | $148B |
|
||
| Agriculture / Food | 1 | $86B |
|
||
Price history
+5.3% since first listed7 events — show timeline
- 2026-05-18 Pending — MRED as Distributed by MLS Grid
- 2026-05-11 Contingent — MRED as Distributed by MLS Grid
- 2026-05-09 Listed $299,999 MRED as Distributed by MLS Grid
- 2009-09-30 Sold (MLS) $198,000 MRED as Distributed by MLS Grid
- 2009-09-05 Contingent — MRED as Distributed by MLS Grid
- 2009-08-28 Listed $189,500 MRED as Distributed by MLS Grid
- 2006-11-24 Sold (Public Records) $285,000 Public Records
Property tax history
-0.3%/yrLatest (2023): $5,210 · -0.6% YoY. Source: county tax records.
Cash-flow waterfall
monthlySold comps — $/sqft
last 12 mo · ≤1 miLoading sold comps…