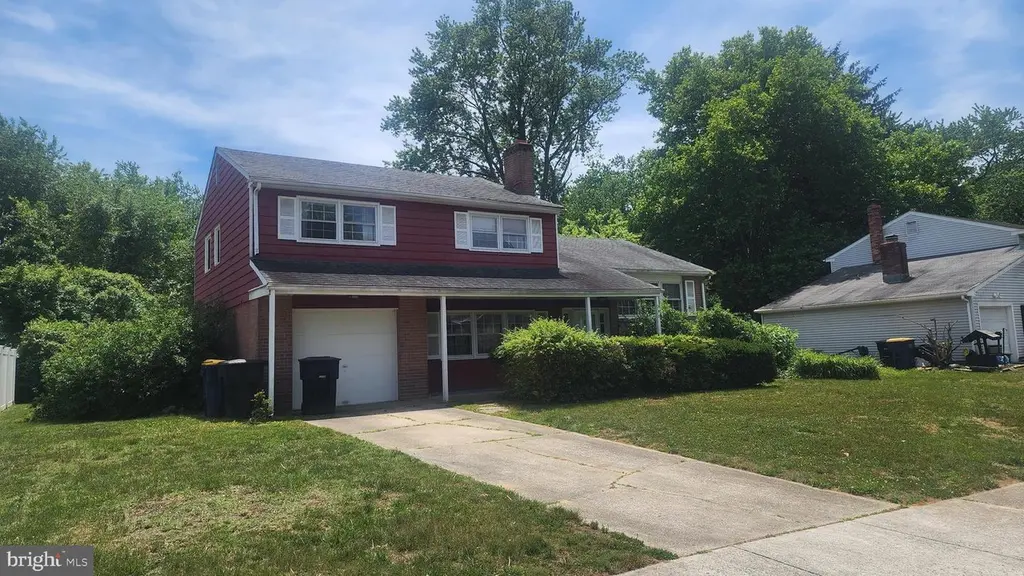
408 Dogwood Ave · Dover, DE
Flood risk 1/10 · Minimal
- FEMA flood zone
- X (unshaded)
- Chance of flooding over 30 yrs
- 0.0%
- Est. flood insurance / yr
- $473 – $860
Fire risk 1/10 · Minimal
- Est. fire insurance / yr
- $476 – $884
Heat risk 8/10 · Major
- Hot days now (above 102°F)
- 7 days/yr
- Hot days in 30 yrs
- 16 days/yr
Wind risk 7/10 · Major
- Chance of severe wind over 30 yrs
- 78.0%
Air-quality risk 2/10 · Minimal
- Unhealthy air days now
- 1 days/yr
- Unhealthy air days in 30 yrs
- 2 days/yr
Risk factors via First Street. Map © Google.
Why this score? — see what drove the C+ grade
The composite is a weighted blend of 9 inputs, each scored 0–100. Each bar is that input's sub-score; the figure is the points it added to the 100-point composite (weight × sub-score).
- Cash flow +22.9/30.0
- ARV discount +15.0/15.0
- DSCR +7.3/10.0
- 1% rule +4.6/10.0
- Livability +3.4/5.0
- Rent growth +3.3/5.0
- Schools +3.3/10.0
- Condition / age +2.5/5.0
- Appreciation +0.0/10.0
$285,000
🖨 Deal sheet 📄 Offer letter ✓ Due diligence
Listing remarks
First time on the market, one Family owners since new. This five bedroom tri level has two and a half baths, hardwood floors, single car garage and a massive rear porch rear porch.
Key facts
- Massive rear porch
- Hardwood floors
- 0.27 acre lot
Tags
Property features AI
Finance
- Other: Total below-grade area reported; Ownership interest: Fee Simple; Year built and square footage sources reported as Assessor
- HOA & community: Ground rent paid annually
Exterior
- Parking: Attached front-entry garage with one garage space
- Utilities: Public water; Public sewer; Electric cooling fuel; Oil heating fuel
- Home design: Detached property; Fee simple ownership
- Construction: Asbestos and brick construction; Block foundation; Finished above-grade area per assessor; Finished below-grade area per assessor
- Exterior features: Lot dimensions approximately 80 x 145; No tidal water; Above-grade and below-grade other structures
Interior
- Bedrooms: Four bedrooms on the upper level; One bedroom on the main level
- Bathrooms: Two full bathrooms (all upper levels); One half bathroom on the main level
- Heating & cooling: Forced air heating (oil); Wall unit cooling (electric); Oil hot water
- Interior features: One fireplace with wood-burning hearth; Unfinished basement
Neighborhood map
What this means for you Summary
Snapshot
- This is a 4-bed/2.5-bath single-family listed at $285k.
Deal economics
- At list price, monthly cash flow is $500 ($6k/yr) — positive.
- The deal already cash-flows at list — no discount required.
- To meet the 1% rule (rent ≥ 1% of price), the offer needs to be $275k (3.5% below list).
- Recommended offer: $275k (3.5% below list) — sets the bar for 1% rule.
- Cap rate 8.4% vs local median 5.2% in Dover — top-decile yield for the area; either an underpriced asset or a hidden risk that comps aren't pricing in. Stress-test before assuming the spread holds.
Location & tenants
- Location reads 67/100 on livability (#38 in DE) — a middle-class / working-renter tenant base. Strengths: amenities A+, cost of living A+, housing A+; Watch: schools C-, crime F, commute F.
- Caesar Rodney School District (suburban): math 26% / reading 49% proficiency, ranked #9 of 26 in DE (top 35%) — families likely to look elsewhere, expect single-tenant / working-renter base with shorter leases.
- Market conditions: Rents rising (+3.3%/yr); 225 active listings in the ZIP; 7 comparable units currently listed for rent nearby; rentals lingering (median 44d on market — plan ~5-8 weeks vacancy on turnover, expect pricing pressure); 100% of comp listings sitting > 30 days — soft ceiling on asking rent; 1,201 units permitted in Kent County in 2024 (116 in 5+ unit buildings).
- At $2,749/mo this rent would consume 49% of the median local household income ($67k/yr) (locally 1500% of renters already pay >50% of income on rent) — very limited rent-growth headroom before tenants either downsize or default.
Forward outlook
- Local home prices are declining (-3.0%/yr); year-one equity from $2k of loan paydown is wiped out by about $9k of value loss. Plan a longer hold.
- Kent County population projected at +22% by 2050 — long-run rental-demand tailwind backs the buy-and-hold thesis.
Negotiation context
- Only 6 days on market — expect competitive offers; lowballing is unlikely to land.
Risks & watch-outs
- Climate carrying-cost: major wind risk, 78% chance of damaging wind over 30y; extreme-heat days projected 7→16/yr by 2055 (HVAC capex compounding) — expect insurance premiums to compound above CPI over the hold.
Questions for the listing agent
- Built in 1965 — when were the roof, HVAC, electrical panel, plumbing, and water heater last replaced?
- Is there a deadline driving the sale (1031 exchange, divorce, estate, relocation)? That informs how much negotiation room exists.
- Crime grade is F in this area — have there been break-ins, vandalism, or insurance claims at this property in the last 3 years? What carrier currently insures it and at what premium?
- What's the average days-on-market for RENTAL listings here right now (not sales)? A rising rental-DOM trend means longer vacancies and softer asking-rent achievability than the comps imply.
- What's the recent tenant-quality profile in this submarket — average credit score on applications, eviction rate, late-payment / NSF rate, and stable-employment percentage? A property-management company in the area should have these aggregated.
- How much new for-sale + rental construction is in the pipeline within 1–3 miles? Heavy new supply typically softens prices + rents 12–24 months out; constrained supply supports both.
Investment metrics
- 1% rule
- 0.96% ✗
- Cap rate
- 8.40%
- Cash-on-cash
- 7.52%
- DSCR
- 1.33
- GRM
- 8.6
CMA / ARV
- ARV (on-the-fly)
- $376,270
- Comps found
- 12
Show comp detail 12 sales within ~0.75 mi
| Address | Dist | Beds/Ba | Sqft | Sold | Price | $/sf | Match |
|---|---|---|---|---|---|---|---|
| 302 Kesselring Ave | 0.12mi | 4/2.0 | 2,010 (+2%) | 9mo | $280,000 | $139 | 82 |
| 311 Mimosa Ave | 0.19mi | 4/1.5 | 1,688 (-14%) | 2mo | $335,000 | $198 | 61 |
| 1120 Woodsedge Rd | 0.42mi | 3/2.5 (-1) | 1,854 (-6%) | 6mo | $360,000 | $194 | 60 |
| 226 Wyoming Ave | 0.63mi | 4/1.5 | 1,929 (-2%) | 5mo | $335,000 | $174 | 59 |
| 118 Lakeview Ave | 0.74mi | 3/2.0 (-1) | 1,952 (-1%) | 0mo | $380,000 | $195 | 57 |
| 530 Woodsedge Rd | 0.46mi | 4/2.5 | 1,750 (-11%) | 5mo | $385,000 | $220 | 56 |
| 162 Turner Dr | 0.44mi | 3/3.0 (-1) | 2,109 (+7%) | 9mo | $352,107 | $167 | 53 |
| 219 Samuel Paynter Dr | 0.50mi | 3/1.5 (-1) | 2,100 (+7%) | 5mo | $200,000 | $95 | 52 |
| 1199 Charles Dr | 0.31mi | 3/1.5 (-1) | 1,719 (-13%) | 4mo | $322,000 | $187 | 52 |
| 507 Wyoming Ave | 0.56mi | 3/2.5 (-1) | 2,114 (+7%) | 8mo | $360,000 | $170 | 50 |
| 949 Westview Ter | 0.62mi | 3/1.5 (-1) | 1,717 (-13%) | 2mo | $330,000 | $192 | 38 |
| 956 Janeka Ln | 0.58mi | 3/2.0 (-1) | 1,679 (-15%) | 7mo | $320,000 | $191 | 36 |
Match score weights: distance 35% · size 25% · config 20% · recency 20%. Top-matched comps best support the ARV.
Projected returns pro-forma
-3.0% appreciation · 3.3% rent growth · sell at horizon
- IRR
- -4.6%
- Equity multiple
- 0.83×
- Total profit
- $-13,623
- Equity at exit
- $42,494
- IRR
- 5.4%
- Equity multiple
- 1.40×
- Total profit
- $32,034
- Equity at exit
- $24,642
Cash invested: $79,800 (down + closing). Projections, not guarantees.
Landlord ↔ Tenant lean methodology
- Overall (STATE)
- 70 Landlord-Friendly
- State Delaware
- 70 Landlord-Friendly · D+7
- County
- — inherits STATE
- City
- — inherits STATE
ZIP-level market 19904
- Rents YoY
- 3.3%
- Active inventory
- 225
- Price-to-rent
- 8.6×
Monthly cashflow live
- Estimated rent
- $2,749 high interval (Pro) →
- Mortgage (P&I)
- −$1,495
- Tax from tax record
- −$58 /mo · $695/yr
- Insurance
- −$119
- HOA
- −$0
- Vacancy / Maint / Mgmt
- −$577
- Net cashflow
- $500
Break-even live
UW: 25.0% down · 7.5% · 30yr · 1.5% tax · 5.0% vac · 8.0% maint · 8.0% mgmt
Financing live
Cash to close
- Down payment
- $71,250
- Closing costs
- $8,550
- Reserves months
- —
- Total cash needed
- —
Loan-product check · same deal, 3 products live
Conventional
25% down · 7.5% · 30yr
- Down + closing
- —
- Monthly P&I
- —
- Monthly cashflow
- —
- DSCR
- —
- Eligible?
- —
Personal DTI + credit; lowest rate.
DSCR
20% down · 8.5% · 30yr
- Down + closing
- —
- Monthly P&I
- —
- Monthly cashflow
- —
- DSCR
- —
- Eligible?
- —
No personal income docs; deal must DSCR.
Hard money
10% down · 12.0% · 12mo
- Down + closing
- —
- Monthly P&I
- —
- Monthly cashflow
- —
- DSCR
- —
- Eligible?
- —
Short-term bridge; refi at stabilization.
Rent comps 7 comps
| Address | Beds | Baths | Sqft | Rent | $/sqft | DOM | Units | Dist |
|---|---|---|---|---|---|---|---|---|
| 541 Ruth Way Dover, DE | 4.0 | 2.5 | 1761 | $3,200 | $1.82 | 43d | 1 | 0.55mi |
| 511 Nickerjack Way Dover, DE | 3.0 | 2.0 | 1569 | $2,800 | $1.78 | 43d | 1 | 0.60mi |
| 502 Horsey Blvd Dover, DE | 3.0 | 2.0 | 1604 | $2,900 | $1.81 | 43d | 1 | 0.63mi |
| 629 Ruth Way Dover, DE | 3.0–4.0 | 2.0–2.5 | 1665 | $3,200 | $1.92 | 43d | 13 | 0.78mi |
| 424 Ridgely Blvd Dover, DE | 3.0 | 2.5 | 1432 | $2,000 | $1.40 | 43d | 1 | 0.85mi |
| 205 Ridgely Blvd Dover, DE | 3.0 | 2.5 | 1432 | $2,000 | $1.40 | 43d | 1 | 0.92mi |
| 100 Isabelle Isle Dover, DE | 2.0–3.0 | 2.0 | 1273 | $2,299 | $1.81 | 43d | 9 | 1.40mi |
Listing history 6 events
-
2026-06-13statusdays on market $285,000 Pending 6 DOM
-
2026-06-10days on market $285,000 Active 4 DOM
-
2026-06-09days on market $285,000 Active 3 DOM
-
2026-06-08days on market $285,000 Active 2 DOM
-
2026-06-07remarks 180-char remark
-
2026-06-07$285,000 Active 1 DOM
ⓘ Source: listings_history table (triggers on properties + properties_extension) + one-shot
backfill from property_details.listing_events for pre-trigger history.
Tax reassessment forecast DE · Partial reset (capped growth)
- Current annual tax
- $695 · $58/mo
- Projected year-2 tax
- $1,174 · $98/mo
- Expected delta
- +$479/yr (+$40/mo · 69.0%)
ⓘ Screening estimate from a state-policy table — verify with the county assessor before closing.
Climate risk First Street
- Flood 1/10 Low FEMA zone X (unshaded) · 0% chance over 30 yrs
- Wildfire 1/10 Low
- Heat 8/10 Severe 7 d/yr ≥102°F today · 16 d/yr by 30 yrs out
- Wind 7/10 Severe 78% chance of damaging wind over 30 yrs
- Air quality 2/10 Low 1 unhealthy d/yr today · 2 by 30 yrs out
Nearby sold comps map
Loading sold comps map…
Walkable amenities ~0.75 mi
Loading nearby amenities…
Taxation est. · year 1
- Rental income
- $32,986
- − Mortgage interest
- −$15,964
- − Property taxes
- −$695
- − Insurance
- −$1,425
- − Repairs & maintenance
- −$2,639
- − Management
- −$2,639
- − Depreciation
- −$8,291
- Taxable income
- $1,333
- Est. tax owed @ 24.0%
- −$320
- After-tax cash flow
- $5,685/yr
For passive investors: Depreciation is non-cash, so a rental often shows a tax loss while cash-flowing — sheltering income. Rental losses are passive: they offset passive income freely, and up to $25,000/yr can offset ordinary (W-2) income if you actively participate and your MAGI is under $100k (phasing out to $0 by $150k); unused losses carry forward. On sale, claimed depreciation is recaptured at up to 25%, and gains may owe capital-gains tax (a 1031 exchange can defer both). Figures are a year-1 estimate at your 24.0% rate — not tax advice; consult a CPA.
Schools (NCES district)
- District
- Caesar Rodney School District
- NCES district ID
- 1000180
- Math proficiency
- 26% ▼ -21.00%
- Reading proficiency
- 49% ▼ -14.00%
- Median HH income
- $61,187
- Composite
- 33.4/100
- National rank
- #5475
- State rank
- #9 of 26 in DE
Livability — Dover
- Score
- 67/100
- State rank
- #38
- US rank
- #10574
Category grades
Schools grade is shown separately in the Schools card above.
Census & demographics
- Census place
- Dover, DE
- County
- Kent County · 82,184 people
- City population
- 76,581
- Metro
- Dover, DE
- Population (ZIP)
- 38,818
- Household income
- $66,908
- Rent vs Own
- Severe rent burden
- 1500.0
Population outlook (Kent County) Hauer SSP2
- Today (2025)
- 194,477 people
- By 2030
- 204,351 · +5.1%
- By 2040
- 222,135 · +14.2%
- By 2050
- 236,483 · +21.6%
- By 2075
- 266,327 · +36.9%
- By 2100
- 275,335 · +41.6%
Race, ethnicity, and origin ACS 2023
- Neighborhood character
- Diverse neighborhood (Simpson 0.64)
- Race & ethnicity
- White 48% Black 35% Two or more races 9% Hispanic / Latino 8% Asian 3%
- Hispanic origin (detail)
- Mexican 1% Puerto Rican 4%
- Common ancestry
- Hispanic 3% Romanian 2% Slovak 2%
- Foreign-born
- 10% · Canada, South Korea
- Languages at home
- 87% English-only · Spanish 5% French/Haitian/Cajun 3% German/W. Germanic 1%
Political lean MEDSL · Kent
- 2024 margin
- Toss-up / Even · D 50.2% · R 48.2% · Other 1.7%
- 2008→2024 swing
- -7.8pp toward R · 2008: 9.8pp · 2024: 2.0pp
- All cycles
- 2024: D+2.0 2020: D+4.1 2016: R+4.9 2012: D+4.9 2008: D+9.8
Not yet ingested
- Civics
- —
Market trends
- HPI YoY
- ▼ -112.03%
- Current HPI
- 187.6879
- Rent YoY
- ▲ 3.30%
- Metro
- Dover, DE
- State GDP YoY
- —
- F500 in state
- 0
Price history
1 event — show timeline
- 2026-06-06 Listed $285,000 BRIGHT MLS
Property tax history
-2.1%/yrLatest (2025): $695 · +0.7% YoY. Source: county tax records.
Cash-flow waterfall
monthlySold comps — $/sqft
last 12 mo · ≤1 miLoading sold comps…