510 Carthage St · Caddo Mills, TX
Flood risk No data
- FEMA flood zone
- —
- Chance of flooding over 30 yrs
- —
- Est. flood insurance / yr
- —
Fire risk No data
- Est. fire insurance / yr
- —
Heat risk No data
- Hot days now (above threshold)
- —
- Hot days in 30 yrs
- —
Wind risk No data
- Chance of severe wind over 30 yrs
- —
Air-quality risk No data
- Unhealthy air days now
- —
- Unhealthy air days in 30 yrs
- —
Risk factors via First Street. Map © Google.
Why this score? — see what drove the D grade
The composite is a weighted blend of 9 inputs, each scored 0–100. Each bar is that input's sub-score; the figure is the points it added to the 100-point composite (weight × sub-score).
- Cash flow +11.7/30.0
- ARV discount +8.5/15.0
- Schools +5.2/10.0
- Condition / age +4.0/5.0
- Livability +3.7/5.0
- 1% rule +3.6/10.0
- DSCR +3.4/10.0
- Rent growth +2.5/5.0
- Appreciation +0.0/10.0
$281,490
🖨 Deal sheet (PDF) 📄 Offer letter ✓ Due diligence
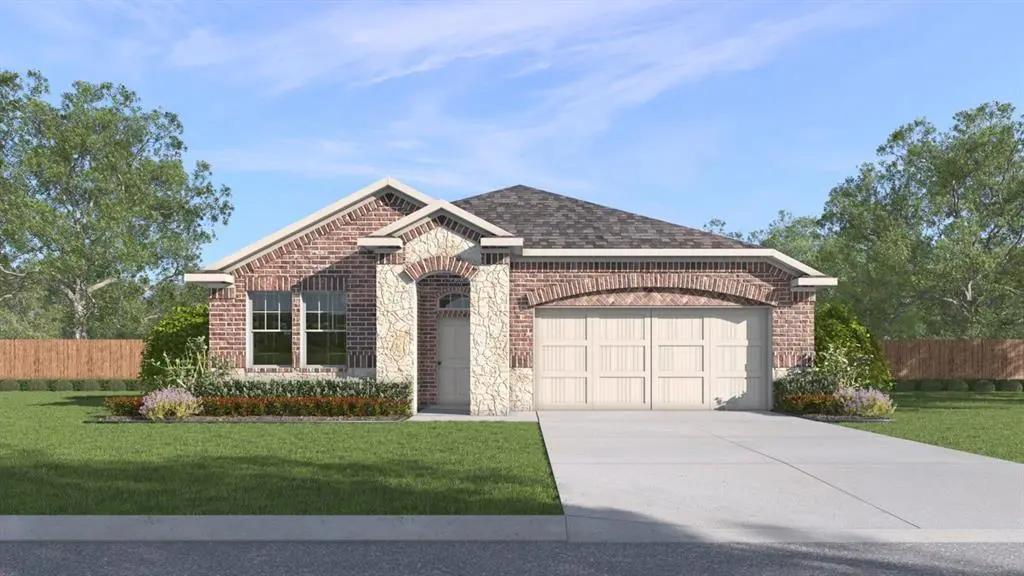
Listing remarks
New! Great open concept floor plan! Three bedrooms, two full baths, with covered patio. Home includes, island kitchen, Quartz counters throughout, LED lighting, full sprinkler system, professionally engineered post tension foundation, and much more! Come see this stunning new community in Caddo Mills nestled between Hwy 66 and I-30. Enjoy small town country living with access to downtown Dallas only 42 miles away. With a playground, community pool, and 3 large lakes under an hour away, there’s no shortage of outdoor fun available with this neighborhood. This community has something for everyone! Schedule a tour today!
Key facts
- Quartz counters
- Led lighting
- Community pool
Tags
Property features AI
Finance
- Other: Builder listing; Posession at closing/funding or upon completion; Financing options include Cash, Conventional, FHA, USDA Loan, VA Loan
- HOA & community: Mandatory association with full use of facilities; Annual HOA fee of $480; HOA management company: NMI
Exterior
- Parking: Attached 2-car garage (18' wide x 20' long, 10' height); 2 covered parking spaces (2-car single door)
- Security: Smoke detectors; Carbon monoxide detectors
- Utilities: City water; City sewer; Electric service; Energy-efficient features including upgraded attic insulation, HVAC, insulation, lighting, thermostat, water heater, and windows
- Home design: Single family residence; One story; Residential property
- Construction: Composition roof; Slab foundation; Year built 2026
- Exterior features: Wood fencing; Lot less than 0.5 acre; Municipal utility district
Interior
- Kitchen: Granite counters; Kitchen island; Breakfast bar; Built-in cabinets; Pantry; Water line to refrigerator; Dishwasher; Disposal; Gas range; Microwave
- Bedrooms: 3 bedrooms (all on the main level); Primary bedroom with ensuite bath and walk-in closet; Secondary bedrooms feature a split-bedroom layout
- Flooring: Carpet; Ceramic tile; Laminate
- Bathrooms: 2 full bathrooms
- Heating & cooling: Central heating (natural gas); Central air (electric)
- Interior features: Open floorplan with decorative lighting; Eat-in kitchen with kitchen island and pantry; Granite counters; Cable TV available; High speed internet available
Neighborhood map
What this means for you Summary
Snapshot
- This is a 3-bed/2.0-bath single-family listed at $281k. Condition is rated good.
Deal economics
- At list price, monthly cash flow is $-82 ($-982/yr) — negative.
- To cash-flow at today's rent, offer at most $270k (4.2% below list).
- To meet the 1% rule (rent ≥ 1% of price), the offer needs to be $241k (14.4% below list).
- Recommended offer: $241k (14.4% below list) — sets the bar for 1% rule.
- Cap rate 5.9% vs local median 3.9% in Caddo Mills — top-decile yield for the area; either an underpriced asset or a hidden risk that comps aren't pricing in. Stress-test before assuming the spread holds.
Location & tenants
- Location reads 73/100 on livability (#216 in TX) — a middle-class / working-renter tenant base. Strengths: crime A+, cost of living A+, housing A+; Watch: amenities F, commute F.
- Caddo Mills ISD (rural): math 59% / reading 59% proficiency, ranked #60 of 826 in TX (top 7%) — acceptable for families but not a draw, mixed tenant base, ~2y average lease.
- Zoned schools: Frances And Jeannette Lee El (math 63% / reading 55%, grade B-, #455 of 4,322 statewide, top 11%, 571 students, 29% FRL); Caddo Mills Middle (math 51% / reading 53%, grade C+, #301 of 1,662 statewide, top 19%, 416 students, 28% FRL); Caddo Mills H S (math 72% / reading 77%, grade B+, #82 of 1,632 statewide, top 6%, 681 students, 28% FRL) — zoned schools at 28% FRL track the district average.
- Market conditions: 317 active listings in the ZIP; 5 comparable units currently listed for rent nearby; rentals at typical pace (median 14d on market — plan ~3-4 weeks tenant-placement turnaround); 1,289 units permitted in Hunt County in 2024 (527 in 5+ unit buildings).
Forward outlook
- Local home prices are declining (-3.0%/yr); year-one equity from $2k of loan paydown is wiped out by about $8k of value loss. Plan a longer hold.
- Hunt County population projected at +15% by 2050 — modest demand growth; plan on rents tracking national, not racing it.
Negotiation context
- It's been on market 19 days — a 2% lower offer ($277k) is reasonable based on typical stale-listing flexibility.
Questions for the listing agent
- What do current leases actually rent for vs. the listed asking? Can we see a recent rent roll and the last 12 months of T-12 income?
- What does the HOA fee cover, when was the last increase, and are there any pending special assessments or reserve-fund shortfalls?
- Is there a deadline driving the sale (1031 exchange, divorce, estate, relocation)? That informs how much negotiation room exists.
- Schools are B-rated — typically a magnet for longer-tenancy family renters. What's the average tenant stay here, and is there a school-zone premium baked into asking?
- The area grade is low — what's the realistic commute time and amenity access for the typical tenant pool here? Any planned neighborhood developments (good or bad) we should know about?
- What's the average days-on-market for RENTAL listings here right now (not sales)? A rising rental-DOM trend means longer vacancies and softer asking-rent achievability than the comps imply.
- What's the recent tenant-quality profile in this submarket — average credit score on applications, eviction rate, late-payment / NSF rate, and stable-employment percentage? A property-management company in the area should have these aggregated.
- How much new for-sale + rental construction is in the pipeline within 1–3 miles? Heavy new supply typically softens prices + rents 12–24 months out; constrained supply supports both.
Investment metrics
- 1% rule
- 0.86% ✗
- Cap rate
- 5.94%
- Cash-on-cash
- -1.25%
- DSCR
- 0.94
- GRM
- 9.7
CMA / ARV
- ARV (on-the-fly)
- $288,010
- Comps found
- 12
Show comp detail 12 sales within ~0.75 mi
| Address | Dist | Beds/Ba | Sqft | Sold | Price | $/sf | Match |
|---|---|---|---|---|---|---|---|
| 404 Flintlock Rd | 0.15mi | 3/2.0 | 1,735 (0%) | 3mo | $287,490 | $166 | 91 |
| 412 Tia Ave | 0.18mi | 3/2.0 | 1,735 (0%) | 8mo | $299,430 | $173 | 85 |
| 211 Bobcat Ln | 0.30mi | 3/2.0 | 1,735 (0%) | 3mo | $294,030 | $169 | 84 |
| 413 Range Rd | 0.07mi | 4/2.0 (+1) | 1,829 (+5%) | 3mo | $331,490 | $181 | 80 |
| 215 Bobcat Ln | 0.27mi | 4/2.0 (+1) | 1,829 (+5%) | 3mo | $298,990 | $163 | 71 |
| 506 Range Rd | 0.06mi | 4/2.0 (+1) | 1,935 (+12%) | 3mo | $299,490 | $155 | 70 |
| 211 Buckboard Ln | 0.29mi | 4/2.0 (+1) | 1,829 (+5%) | 3mo | $299,650 | $164 | 70 |
| 412 Bailey Way | 0.28mi | 4/2.0 (+1) | 1,816 (+5%) | 7mo | $300,000 | $165 | 68 |
| 300 Tia Ave | 0.26mi | 4/2.0 (+1) | 1,829 (+5%) | 8mo | $283,000 | $155 | 68 |
| 402 Range Rd | 0.13mi | 4/2.0 (+1) | 1,935 (+12%) | 7mo | $334,990 | $173 | 64 |
| 108 Condor Pass | 0.46mi | 4/2.0 (+1) | 1,830 (+6%) | 2mo | $267,999 | $146 | 62 |
| 3159 Ridgeview Rd | 0.29mi | 3/2.5 | 1,979 (+14%) | 7mo | $509,900 | $258 | 55 |
Match score weights: distance 35% · size 25% · config 20% · recency 20%. Top-matched comps best support the ARV.
Projected returns pro-forma
-3.0% appreciation · 3.0% rent growth · sell at horizon
- IRR
- -18.3%
- Equity multiple
- 0.36×
- Total profit
- $-50,764
- Equity at exit
- $41,971
- IRR
- -10.6%
- Equity multiple
- 0.36×
- Total profit
- $-50,666
- Equity at exit
- $24,338
Cash invested: $78,817 (down + closing). Projections, not guarantees.
Landlord ↔ Tenant lean methodology
- Overall (STATE)
- 87 Strongly Landlord-Friendly
- State Texas
- 87 Strongly Landlord-Friendly · R+5
- County
- — inherits STATE
- City
- — inherits STATE
ZIP-level market 75135
- Home prices YoY
- -13.5%
- Active inventory
- 317
- Price-to-rent
- 9.7×
Monthly cashflow live
- Estimated rent
- $2,409 high interval (Pro) →
- Mortgage (P&I)
- −$1,476
- Tax est. 1.5%
- −$352 /mo · $4,222/yr
- Insurance
- −$117
- HOA
- −$40
- Vacancy / Maint / Mgmt
- −$506
- Net cashflow
- $-82
Break-even live
Sensitivity live
| Price | -10% $113 | -5% $15 | +0% $-82 | +5% $-179 | +10% $-276 |
|---|---|---|---|---|---|
| Rent | -10% $-272 | -5% $-177 | +0% $-82 | +5% $13 | +10% $109 |
| Rate | -1.0pp $60 | -0.5pp $-10 | base $-82 | +0.5pp $-155 | +1.0pp $-229 |
UW: 25.0% down · 7.5% · 30yr · 1.5% tax · 5.0% vac · 8.0% maint · 8.0% mgmt
Financing live
Cash to close
- Down payment
- $70,372
- Closing costs
- $8,445
- Reserves months
- —
- Total cash needed
- —
Loan-product check · same deal, 3 products live
Conventional
25% down · 7.5% · 30yr
- Down + closing
- —
- Monthly P&I
- —
- Monthly cashflow
- —
- DSCR
- —
- Eligible?
- —
Personal DTI + credit; lowest rate.
DSCR
20% down · 8.5% · 30yr
- Down + closing
- —
- Monthly P&I
- —
- Monthly cashflow
- —
- DSCR
- —
- Eligible?
- —
No personal income docs; deal must DSCR.
Hard money
10% down · 12.0% · 12mo
- Down + closing
- —
- Monthly P&I
- —
- Monthly cashflow
- —
- DSCR
- —
- Eligible?
- —
Short-term bridge; refi at stabilization.
Rent comps 5 comps
| Address | Beds | Baths | Sqft | Rent | $/sqft | DOM | Units | Dist |
|---|---|---|---|---|---|---|---|---|
| 509 Range Rd Caddo Mills, TX | 4.0 | 3.0 | 2060 | $2,500 | $1.21 | 3d | 1 | 0.01mi |
| 210 Calico Ln Caddo Mills, TX | 4.0 | 2.0 | 2012 | $2,400 | $1.19 | 26d | 1 | 0.29mi |
| 132 Whitetail Way Caddo Mills, TX | 3.0 | 2.0 | 1780 | $2,400 | $1.35 | 14d | 1 | 0.50mi |
| 218 Whitetail Way Caddo Mills, TX | 3.0 | 2.0 | 1735 | $2,195 | $1.27 | 45d | 1 | 0.56mi |
| 187 Longhorn Pass Caddo Mills, TX | 4.0 | 2.0 | 2003 | $2,195 | $1.10 | 7d | 1 | 0.56mi |
HOA detail
- Monthly dues
- $40 · $480/yr
- Likely covers
- pool
Listing history 13 events
-
2026-06-21days on market $281,490 Active 19 DOM
-
2026-06-18days on market $281,490 Active 16 DOM
-
2026-06-17days on market $281,490 Active 15 DOM
-
2026-06-16days on market $281,490 Active 14 DOM
-
2026-06-15days on market $281,490 Active 13 DOM
-
2026-06-13days on market $281,490 Active 11 DOM
-
2026-06-13days on market $281,490 Active 10 DOM
-
2026-06-09days on market $281,490 Active 7 DOM
-
2026-06-08days on market $281,490 Active 6 DOM
-
2026-06-07days on market $281,490 Active 5 DOM
-
2026-06-04pricedays on market $281,490 Active 2 DOM
-
2026-06-02remarks 626-char remark
-
2026-06-02$331,490 Active 1 DOM
ⓘ Source: listings_history table (triggers on properties + properties_extension) + one-shot
backfill from property_details.listing_events for pre-trigger history.
Nearby sold comps map
Loading sold comps map…
Walkable amenities ~0.75 mi
Loading nearby amenities…
Taxation est. · year 1
- Rental income
- $28,914
- − Mortgage interest
- −$15,768
- − Property taxes
- −$4,222
- − Insurance
- −$1,407
- − Repairs & maintenance
- −$2,313
- − Management
- −$2,313
- − HOA
- −$480
- − Depreciation
- −$8,189
- Taxable loss
- −$5,779
- Est. tax savings @ 24.0%
- +$1,387
- After-tax cash flow
- $405/yr
For passive investors: Depreciation is non-cash, so a rental often shows a tax loss while cash-flowing — sheltering income. Rental losses are passive: they offset passive income freely, and up to $25,000/yr can offset ordinary (W-2) income if you actively participate and your MAGI is under $100k (phasing out to $0 by $150k); unused losses carry forward. On sale, claimed depreciation is recaptured at up to 25%, and gains may owe capital-gains tax (a 1031 exchange can defer both). Figures are a year-1 estimate at your 24.0% rate — not tax advice; consult a CPA.
Condition & rehab AI · 13 photos
This home is in good condition with a fresh exterior and interior. It has a good layout and modern finishes, making it a solid investment.
Value-add opportunities
- Both Paint exterior — Enhances curb appeal and value
- Both Replace carpet with hardwood — Improves aesthetics and is easier to maintain
- Both Install smart home devices — Enhances convenience and marketability
Renovation cost estimate screening
Value-add ROI direction
- Both Paint exterior — Enhances curb appeal and value ↑
- Both Replace carpet with hardwood — Improves aesthetics and is easier to maintain ↑
- Both Install smart home devices — Enhances convenience and marketability ↑
ⓘ Cost ranges are severity-bucket heuristics (US national rule-of-thumb). Get contractor quotes + a written scope before underwriting a rehab budget.
Schools (NCES district)
- District
- Caddo Mills ISD
- NCES district ID
- 4812390
- Math proficiency
- 59% ▼ -6.00%
- Reading proficiency
- 59% ▬ 0.00%
- Median HH income
- $65,383
- Composite
- 51.73/100
- National rank
- #1684
- State rank
- #60 of 826 in TX
Livability — Caddo Mills
- Score
- 73/100
- State rank
- #216
- US rank
- #5332
Category grades
Schools grade is shown separately in the Schools card above.
Census & demographics
- City population
- 10,265
- Population (ZIP)
- 10,265
Population outlook (Hunt County) Hauer SSP2
- Today (2025)
- 97,090 people
- By 2030
- 100,452 · +3.5%
- By 2040
- 106,544 · +9.7%
- By 2050
- 111,218 · +14.6%
- By 2075
- 121,695 · +25.3%
- By 2100
- 123,683 · +27.4%
Race, ethnicity, and origin ACS 2023
- Neighborhood character
- Predominantly White (67%)
- Race & ethnicity
- White 67% Hispanic / Latino 24% Two or more races 14% Black 3%
- Hispanic origin (detail)
- Mexican 21% Cuban 2%
- Common ancestry
- Lithuanian 4% Slovak 1% Italian 1%
- Foreign-born
- 7% · Canada, South Korea
- Languages at home
- 84% English-only · Spanish 13% Korean 1% German/W. Germanic 1%
Political lean MEDSL · Hunt
- 2024 margin
- Solid R (+55.5) · D 21.9% · R 77.4%
- 2008→2024 swing
- -14.9pp toward R · 2008: -40.6pp · 2024: -55.5pp
- All cycles
- 2024: R+55.5 2020: R+52.5 2016: R+56.3 2012: R+51.2 2008: R+40.6
Not yet ingested
- Civics
- —
Market trends
- HPI YoY
- ▼ -43.07%
- Current HPI
- 275.2189
- Rent YoY
- —
- Metro
- —
- State GDP YoY
- ▲ 3.95%
- F500 in state
- 110
Industry mix (Fortune 500 HQ in TX)
| Industry | F500 HQs | Revenue |
|---|---|---|
| Energy | 16 | $1,198B |
|
||
| Technology | 5 | $198B |
|
||
| Engineering / Construction | 4 | $72B |
|
||
| Energy Services | 3 | $60B |
|
||
| Utilities | 3 | $41B |
|
||
| Healthcare | 2 | $330B |
|
||
Price history
1 event — show timeline
- 2026-06-02 Listed $331,490 NTREIS
Cash-flow waterfall
monthlySold comps — $/sqft
last 12 mo · ≤1 miLoading sold comps…