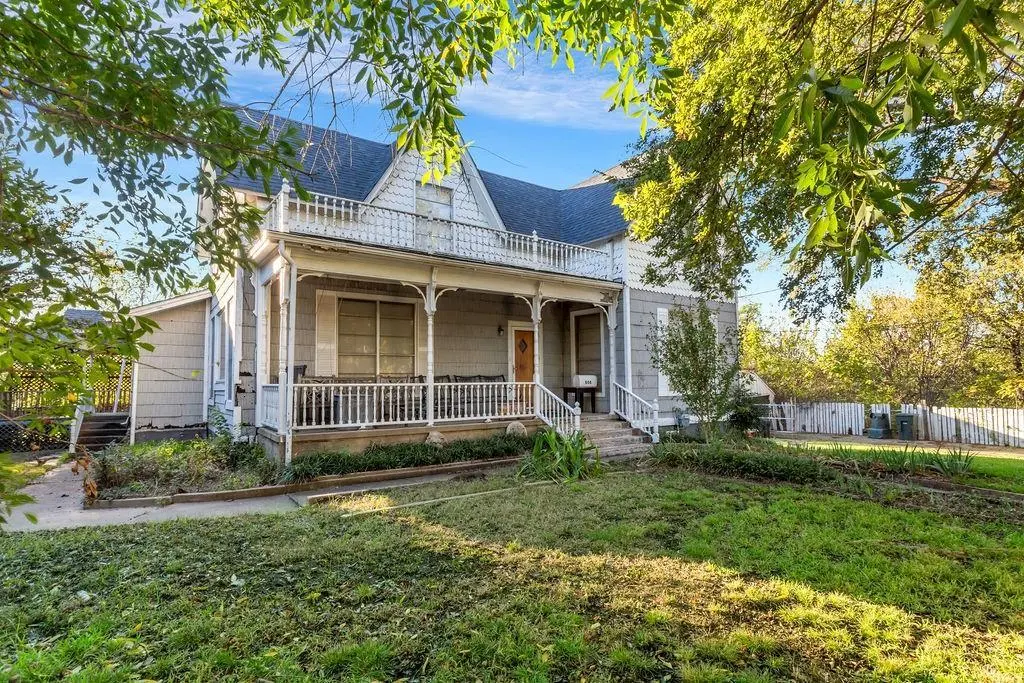
808 S Austin St · Sherman, TX
Flood risk 1/10 · Minimal
- FEMA flood zone
- X (unshaded)
- Chance of flooding over 30 yrs
- 0.0%
- Est. flood insurance / yr
- $507 – $1,088
Fire risk 6/10 · Moderate
- Est. fire insurance / yr
- $1,222 – $2,270
Heat risk 6/10 · Moderate
- Hot days now (above 108°F)
- 7 days/yr
- Hot days in 30 yrs
- 22 days/yr
Wind risk 4/10 · Minor
- Chance of severe wind over 30 yrs
- 20.0%
Air-quality risk 3/10 · Minor
- Unhealthy air days now
- 2 days/yr
- Unhealthy air days in 30 yrs
- 3 days/yr
Risk factors via First Street. Map © Google.
Why this score? — see what drove the D grade
The composite is a weighted blend of 9 inputs, each scored 0–100. Each bar is that input's sub-score; the figure is the points it added to the 100-point composite (weight × sub-score).
- Cash flow +12.5/30.0
- ARV discount +12.5/15.0
- 1% rule +3.9/10.0
- DSCR +3.7/10.0
- Livability +3.1/5.0
- Schools +2.9/10.0
- Condition / age +2.5/5.0
- Rent growth +1.8/5.0
- Appreciation +0.0/10.0
$239,810
🖨 Deal sheet (PDF) 📄 Offer letter ✓ Due diligence
Listing remarks MLS
REDUCED PRICE - Almost 1 ACRE - Exceptional opportunity in a prime Sherman location near major Planned Developments. Situated on nearly one acre and within walking distance to historic downtown Sherman, this property offers a rare blend of location, land, and income potential. This home features three separate living areas, two bedrooms upstairs, and a spacious primary bedroom on the main level, creating flexible income producing opportunities for future reconfiguration. Income producing interior and take advantage of income producing with the large lot. The expansive lot provides ample room for creative use such as building TINY HOMES on this lot which is also able to be zoned Commercial if you would like to generate additional income. Imagine expanding the detached garage into a parking lot for your customers. Generate a PadSplit with 3 living areas and 3 bedrooms and I can show you how. Setup corporate housing for medical, student residence, or manufacturing with GlobiTech, Texas Instruments, Emerson, or other manufacturing companies. Additional highlights include solar panels, new HVAC system, multiple storm or tornado shelters. Advertise on the Billboard just at your backyard. Choctaw Casino is just 27 miles north on Hwy 75. The land itself is worth so much much more. Opportunities like this close to downtown with nearly an acre are increasingly rare. Schedule a showing to fully appreciate the possibilities. Request 24hr advance notice for showings.
Key facts
- Large lot
- Solar panels
- Zoned commercial
Tags
Neighborhood map
What this means for you Summary
Snapshot
- This is a 4-bed/3.0-bath single-family listed at $240k.
Deal economics
- At list price, monthly cash flow is $-36 ($-435/yr) — negative.
- To cash-flow at today's rent, offer at most $233k (2.7% below list).
- To meet the 1% rule (rent ≥ 1% of price), the offer needs to be $214k (11.0% below list).
- Recommended offer: $211k (12.0% below list) — sets the bar for market timing.
- Cap rate 6.1% vs local median 3.7% in Sherman — top-decile yield for the area; either an underpriced asset or a hidden risk that comps aren't pricing in. Stress-test before assuming the spread holds.
Location & tenants
- Location reads 61/100 on livability (#1,027 in TX) — a middle-class / working-renter tenant base. Strengths: cost of living A+, housing A+; Watch: crime C-, employment C-, amenities F.
- Sherman ISD (urban): math 31% / reading 37% proficiency, ranked #546 of 826 in TX (top 66%) — families likely to look elsewhere, expect single-tenant / working-renter base with shorter leases.
- Zoned schools: Washington El (math 37% / reading 32%, grade F, #1,995 of 4,322 statewide, top 50%, 496 students, 97% FRL); Piner Middle (math 31% / reading 41%, grade F, #805 of 1,662 statewide, top 50%, 818 students, 75% FRL); Sherman H S (math 28% / reading 44%, grade F, #930 of 1,632 statewide, top 57%, 2,155 students, 70% FRL) — zoned schools average 80% FRL vs 60% district-wide (21 pts higher); higher-poverty schools than district average — tighter screening recommended.
- Market conditions: Rents soft (-2.7%/yr); 479 active listings in the ZIP; 10 comparable units currently listed for rent nearby; rentals lingering (median 46d on market — plan ~5-8 weeks vacancy on turnover, expect pricing pressure); 80% of comp listings sitting > 30 days — soft ceiling on asking rent; 2,272 units permitted in Grayson County in 2024 (750 in 5+ unit buildings).
- At $2,135/mo this rent would consume 46% of the median local household income ($56k/yr) (locally 840% of renters already pay >50% of income on rent) — very limited rent-growth headroom before tenants either downsize or default.
Forward outlook
- Local home prices are declining (-3.0%/yr); year-one equity from $2k of loan paydown is wiped out by about $7k of value loss. Plan a longer hold.
- Grayson County population projected at +12% by 2050 — modest demand growth; plan on rents tracking national, not racing it.
Negotiation context
- It's been on market 135 days — a 12% lower offer ($211k) is reasonable based on typical stale-listing flexibility.
- 6 sale attempts since 11y ago with the ask held roughly flat each time — persistent listings suggest the price (not the market) is what's stuck; bring a comps-based counter.
Risks & watch-outs
- Watch-outs: built in 1920 — expect roof / HVAC / electrical / plumbing capex.
- Climate carrying-cost: major wildfire risk; extreme-heat days projected 7→22/yr by 2055 (HVAC capex compounding) — expect insurance premiums to compound above CPI over the hold.
Questions for the listing agent
- What do current leases actually rent for vs. the listed asking? Can we see a recent rent roll and the last 12 months of T-12 income?
- It's been on market 135 days. Have you received any prior offers? Is the seller open to a 12% concession, seller financing, or rate buy-down credit?
- Built in 1920 — when were the roof, HVAC, electrical panel, plumbing, and water heater last replaced?
- Why hasn't it sold? Are there any deal-killer items the seller is aware of (foundation, flood, title, zoning, code violations)?
- Is there a deadline driving the sale (1031 exchange, divorce, estate, relocation)? That informs how much negotiation room exists.
- Schools are D-rated, which usually means shorter tenancies and higher turnover. Who's the typical renter profile here, and what's been the actual vacancy rate?
- The area grade is low — what's the realistic commute time and amenity access for the typical tenant pool here? Any planned neighborhood developments (good or bad) we should know about?
- What's the average days-on-market for RENTAL listings here right now (not sales)? A rising rental-DOM trend means longer vacancies and softer asking-rent achievability than the comps imply.
- What's the recent tenant-quality profile in this submarket — average credit score on applications, eviction rate, late-payment / NSF rate, and stable-employment percentage? A property-management company in the area should have these aggregated.
- How much new for-sale + rental construction is in the pipeline within 1–3 miles? Heavy new supply typically softens prices + rents 12–24 months out; constrained supply supports both.
Investment metrics
- 1% rule
- 0.89% ✗
- Cap rate
- 6.11%
- Cash-on-cash
- -0.65%
- DSCR
- 0.97
- GRM
- 9.4
CMA / ARV
- ARV (median comp)
- $270,054
- List price
- $239,810
- Delta
- -11.20%
- Verdict
- UNDERPRICED
- Comps
- 20 within 1.0 mi
Show comp detail 1 sale within ~0.75 mi
| Address | Dist | Beds/Ba | Sqft | Sold | Price | $/sf | Match |
|---|---|---|---|---|---|---|---|
| 703 S Montgomery St | 0.48mi | 5/3.5 (+1) | 2,844 (+9%) | 8mo | $299,900 | $105 | 49 |
Match score weights: distance 35% · size 25% · config 20% · recency 20%. Top-matched comps best support the ARV.
Projected returns pro-forma
-3.0% appreciation · 0.0% rent growth · sell at horizon
- IRR
- -20.9%
- Equity multiple
- 0.29×
- Total profit
- $-47,353
- Equity at exit
- $35,756
- IRR
- -23.6%
- Equity multiple
- -0.01×
- Total profit
- $-68,094
- Equity at exit
- $20,734
Cash invested: $67,147 (down + closing). Projections, not guarantees.
Landlord ↔ Tenant lean methodology
- Overall (STATE)
- 87 Strongly Landlord-Friendly
- State Texas
- 87 Strongly Landlord-Friendly · R+5
- County
- — inherits STATE
- City
- — inherits STATE
ZIP-level market 75090
- Home prices YoY
- -20.0%
- Rents YoY
- -2.7%
- Active inventory
- 479
- Price-to-rent
- 9.4×
Monthly cashflow live
- Estimated rent
- $2,135 high interval (Pro) →
- Mortgage (P&I)
- −$1,258
- Tax from tax record
- −$366 /mo · $4,387/yr
- Insurance
- −$100
- HOA
- −$0
- Vacancy / Maint / Mgmt
- −$448
- Net cashflow
- $-36
Break-even live
Sensitivity live
| Price | -10% $100 | -5% $32 | +0% $-36 | +5% $-104 | +10% $-172 |
|---|---|---|---|---|---|
| Rent | -10% $-205 | -5% $-121 | +0% $-36 | +5% $48 | +10% $132 |
| Rate | -1.0pp $85 | -0.5pp $25 | base $-36 | +0.5pp $-98 | +1.0pp $-162 |
UW: 25.0% down · 7.5% · 30yr · 1.5% tax · 5.0% vac · 8.0% maint · 8.0% mgmt
Financing live
Cash to close
- Down payment
- $59,952
- Closing costs
- $7,194
- Reserves months
- —
- Total cash needed
- —
Loan-product check · same deal, 3 products live
Conventional
25% down · 7.5% · 30yr
- Down + closing
- —
- Monthly P&I
- —
- Monthly cashflow
- —
- DSCR
- —
- Eligible?
- —
Personal DTI + credit; lowest rate.
DSCR
20% down · 8.5% · 30yr
- Down + closing
- —
- Monthly P&I
- —
- Monthly cashflow
- —
- DSCR
- —
- Eligible?
- —
No personal income docs; deal must DSCR.
Hard money
10% down · 12.0% · 12mo
- Down + closing
- —
- Monthly P&I
- —
- Monthly cashflow
- —
- DSCR
- —
- Eligible?
- —
Short-term bridge; refi at stabilization.
Rent comps 10 comps
| Address | Beds | Baths | Sqft | Rent | $/sqft | DOM | Units | Dist |
|---|---|---|---|---|---|---|---|---|
| 120 S Crockett St Sherman, TX | 3.0 | 2.0 | 3000 | $2,000 | $0.67 | 45d | 1 | 0.52mi |
| 120 S Crockett St Unit 201 Sherman, TX | 3.0 | 1.5 | 3000 | $2,000 | $0.67 | 45d | 1 | 0.52mi |
| 103 S Highland Ave Sherman, TX | 3.0 | 3.0 | 1766 | $1,950 | $1.10 | 45d | 1 | 0.70mi |
| 514 E Brockett St Unit 514 Sherman, TX | 4.0 | 4.5 | 1800 | $1,800 | $1.00 | 45d | 1 | 1.11mi |
| 2203 Rannoch St Sherman, TX | 4.0 | 3.0 | 2059 | $2,275 | $1.10 | 45d | 1 | 1.36mi |
| 2215 Gustavus Dr Sherman, TX | 4.0 | 3.0 | 2059 | $2,250 | $1.09 | 23d | 1 | 1.36mi |
| 1714 Crescent Dr Sherman, TX | 4.0 | 2.5 | 2190 | $2,000 | $0.91 | 46d | 1 | 1.41mi |
| 530 Castle Rd Sherman, TX | 4.0 | 3.0 | 2059 | $2,600 | $1.26 | 45d | 1 | 1.41mi |
| 2231 Rannoch St Sherman, TX | 4.0 | 3.0 | 2059 | $2,300 | $1.12 | 23d | 1 | 1.42mi |
| 404 Castle Rd Sherman, TX | 4.0 | 3.0 | 2059 | $2,300 | $1.12 | 45d | 1 | 1.43mi |
Listing history 36 events
-
2026-06-21days on market $239,810 Active 135 DOM
-
2026-06-19days on market $239,810 Active 133 DOM
-
2026-06-18days on market $239,810 Active 132 DOM
-
2026-06-17days on market $239,810 Active 131 DOM
-
2026-06-16days on market $239,810 Active 130 DOM
-
2026-06-15days on market $239,810 Active 129 DOM
-
2026-06-14days on market $239,810 Active 127 DOM
-
2026-06-13days on market $239,810 Active 126 DOM
-
2026-06-10days on market $239,810 Active 124 DOM
-
2026-06-09days on market $239,810 Active 123 DOM
-
2026-06-08days on market $239,810 Active 122 DOM
-
2026-06-07days on market $239,810 Active 121 DOM
-
2026-06-03days on market $239,810 Active 117 DOM
-
2026-06-02days on market $239,810 Active 116 DOM
-
2026-06-01days on market $239,810 Active 115 DOM
-
2026-05-31days on market $239,810 Active 114 DOM
-
2026-05-30days on market $239,810 Active 113 DOM
-
2026-04-07price $239,810 1480-char remark
Show marketing remark (1480 chars)
REDUCED PRICE - Almost 1 ACRE - Exceptional opportunity in a prime Sherman location near major Planned Developments. Situated on nearly one acre and within walking distance to historic downtown Sherman, this property offers a rare blend of location, land, and income potential. This home features three separate living areas, two bedrooms upstairs, and a spacious primary bedroom on the main level, creating flexible income producing opportunities for future reconfiguration. Income producing interior and take advantage of income producing with the large lot. The expansive lot provides ample room for creative use such as building TINY HOMES on this lot which is also able to be zoned Commercial if you would like to generate additional income. Imagine expanding the detached garage into a parking lot for your customers. Generate a PadSplit with 3 living areas and 3 bedrooms and I can show you how. Setup corporate housing for medical, student residence, or manufacturing with GlobiTech, Texas Instruments, Emerson, or other manufacturing companies. Additional highlights include solar panels, new HVAC system, multiple storm or tornado shelters. Advertise on the Billboard just at your backyard. Choctaw Casino is just 27 miles north on Hwy 75. The land itself is worth so much much more. Opportunities like this close to downtown with nearly an acre are increasingly rare. Schedule a showing to fully appreciate the possibilities. Request 24hr advance notice for showings.
-
2026-02-06$245,810 Active 1480-char remark
Show marketing remark (1480 chars)
REDUCED PRICE - Almost 1 ACRE - Exceptional opportunity in a prime Sherman location near major Planned Developments. Situated on nearly one acre and within walking distance to historic downtown Sherman, this property offers a rare blend of location, land, and income potential. This home features three separate living areas, two bedrooms upstairs, and a spacious primary bedroom on the main level, creating flexible income producing opportunities for future reconfiguration. Income producing interior and take advantage of income producing with the large lot. The expansive lot provides ample room for creative use such as building TINY HOMES on this lot which is also able to be zoned Commercial if you would like to generate additional income. Imagine expanding the detached garage into a parking lot for your customers. Generate a PadSplit with 3 living areas and 3 bedrooms and I can show you how. Setup corporate housing for medical, student residence, or manufacturing with GlobiTech, Texas Instruments, Emerson, or other manufacturing companies. Additional highlights include solar panels, new HVAC system, multiple storm or tornado shelters. Advertise on the Billboard just at your backyard. Choctaw Casino is just 27 miles north on Hwy 75. The land itself is worth so much much more. Opportunities like this close to downtown with nearly an acre are increasingly rare. Schedule a showing to fully appreciate the possibilities. Request 24hr advance notice for showings.
-
2025-06-12historical
-
2024-11-24$800,000 Active
-
2016-09-06soldstatus
-
2016-07-08soldstatus Sold
-
2016-06-23status Pending
-
2016-06-13price $129,900
-
2016-05-31$139,900 Active
-
2016-05-11soldstatus Sold
-
2016-04-27soldstatus
-
2016-03-23status Pending
-
2016-03-15$88,000 Active
-
2016-02-10historical
-
2016-01-18$210,000 Active
-
2016-01-09historical
-
2015-09-03price $210,000
-
2015-07-31price $250,000
-
2015-07-08$270,000 Active
ⓘ Source: listings_history table (triggers on properties + properties_extension) + one-shot
backfill from property_details.listing_events for pre-trigger history.
Tax reassessment forecast TX · Resets to sale price
- Current annual tax
- $4,387 · $366/mo
- Projected year-2 tax
- $4,389 · $366/mo
- Expected delta
- +$1/yr ($0/mo · 0.0%)
ⓘ Screening estimate from a state-policy table — verify with the county assessor before closing.
Climate risk First Street
- Flood 1/10 Low FEMA zone X (unshaded) · 0% chance over 30 yrs
- Wildfire 6/10 Major
- Heat 6/10 Major 7 d/yr ≥108°F today · 22 d/yr by 30 yrs out
- Wind 4/10 Moderate 20% chance of damaging wind over 30 yrs
- Air quality 3/10 Moderate 2 unhealthy d/yr today · 3 by 30 yrs out
Nearby sold comps map
Loading sold comps map…
Walkable amenities ~0.75 mi
Loading nearby amenities…
Taxation est. · year 1
- Rental income
- $25,623
- − Mortgage interest
- −$13,433
- − Property taxes
- −$4,387
- − Insurance
- −$1,199
- − Repairs & maintenance
- −$2,050
- − Management
- −$2,050
- − Depreciation
- −$6,976
- Taxable loss
- −$4,472
- Est. tax savings @ 24.0%
- +$1,073
- After-tax cash flow
- $638/yr
For passive investors: Depreciation is non-cash, so a rental often shows a tax loss while cash-flowing — sheltering income. Rental losses are passive: they offset passive income freely, and up to $25,000/yr can offset ordinary (W-2) income if you actively participate and your MAGI is under $100k (phasing out to $0 by $150k); unused losses carry forward. On sale, claimed depreciation is recaptured at up to 25%, and gains may owe capital-gains tax (a 1031 exchange can defer both). Figures are a year-1 estimate at your 24.0% rate — not tax advice; consult a CPA.
Schools (NCES district)
- District
- Sherman ISD
- NCES district ID
- 4840080
- Math proficiency
- 31% ▼ -9.00%
- Reading proficiency
- 37% ▼ -2.00%
- Median HH income
- $42,587
- Composite
- 28.79/100
- National rank
- #6665
- State rank
- #546 of 826 in TX
Livability — Sherman
- Score
- 61/100
- State rank
- #1027
- US rank
- #18243
Category grades
Schools grade is shown separately in the Schools card above.
Census & demographics
- Census place
- Sherman, TX
- County
- Grayson County · 108,053 people
- City population
- 54,936
- Metro
- Sherman-Denison, TX
- Population (ZIP)
- 26,594
- Household income
- $55,543
- Rent vs Own
- Severe rent burden
- 840.0
Population outlook (Grayson County) Hauer SSP2
- Today (2025)
- 134,540 people
- By 2030
- 138,653 · +3.1%
- By 2040
- 145,958 · +8.5%
- By 2050
- 151,218 · +12.4%
- By 2075
- 161,802 · +20.3%
- By 2100
- 159,036 · +18.2%
Race, ethnicity, and origin ACS 2023
- Neighborhood character
- Diverse neighborhood (Simpson 0.64)
- Race & ethnicity
- White 49% Hispanic / Latino 32% Two or more races 17% Black 11%
- Hispanic origin (detail)
- Mexican 26%
- Common ancestry
- Slovak 2% Romanian 2% Lithuanian 1%
- Foreign-born
- 15% · Canada
- Languages at home
- 73% English-only · Spanish 24% German/W. Germanic 1% Other Indo-European 1%
Political lean MEDSL · Grayson
- 2024 margin
- Solid R (+54.3) · D 22.5% · R 76.7%
- 2008→2024 swing
- -16.4pp toward R · 2008: -37.9pp · 2024: -54.3pp
- All cycles
- 2024: R+54.3 2020: R+49.9 2016: R+53.1 2012: R+48.0 2008: R+37.9
Not yet ingested
- Civics
- —
Market trends
- HPI YoY
- ▼ -69.00%
- Current HPI
- 276.5739
- Rent YoY
- ▼ -2.70%
- Metro
- Sherman-Denison, TX
- State GDP YoY
- ▲ 3.95%
- F500 in state
- 110
Industry mix (Fortune 500 HQ in TX)
| Industry | F500 HQs | Revenue |
|---|---|---|
| Energy | 16 | $1,198B |
|
||
| Technology | 5 | $198B |
|
||
| Engineering / Construction | 4 | $72B |
|
||
| Energy Services | 3 | $60B |
|
||
| Utilities | 3 | $41B |
|
||
| Healthcare | 2 | $330B |
|
||
Price history
-11.2% since first listed19 events — show timeline
- 2026-04-07 Price Changed $239,810 NTREIS
- 2026-02-06 Listed $245,810 NTREIS
- 2025-06-12 Listing Removed — NTREIS
- 2024-11-24 Listed $800,000 NTREIS
- 2016-09-06 Sold (Public Records) — Public Records
- 2016-07-08 Sold (MLS) — NTREIS
- 2016-06-23 Pending — NTREIS
- 2016-06-13 Price Changed $129,900 NTREIS
- 2016-05-31 Listed $139,900 NTREIS
- 2016-05-11 Sold (MLS) — NTREIS
- 2016-04-27 Sold (Public Records) — Public Records
- 2016-03-23 Pending — NTREIS
- 2016-03-15 Listed $88,000 NTREIS
- 2016-02-10 Listing Removed — NTREIS
- 2016-01-18 Listed $210,000 NTREIS
- 2016-01-09 Listing Removed — NTREIS
- 2015-09-03 Price Changed $210,000 NTREIS
- 2015-07-31 Price Changed $250,000 NTREIS
- 2015-07-08 Listed $270,000 NTREIS
Property tax history
+6.0%/yrLatest (2025): $4,387 · +10.0% YoY. Source: county tax records.
Cash-flow waterfall
monthlySold comps — $/sqft
last 12 mo · ≤1 miLoading sold comps…