 Fourplex
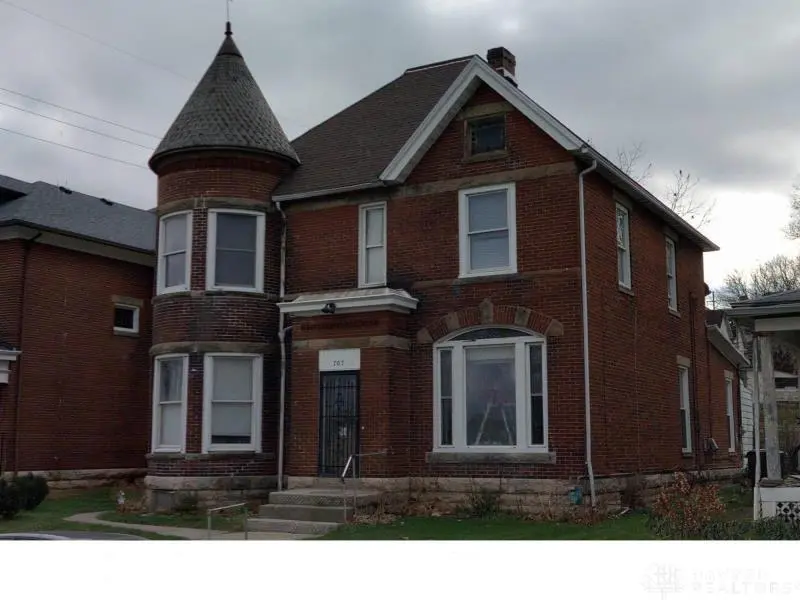
707 W High St · Springfield, OH
Flood risk 1/10 · Minimal
- FEMA flood zone
- X (unshaded)
- Chance of flooding over 30 yrs
- 0.0%
- Est. flood insurance / yr
- $473 – $860
Fire risk 1/10 · Minimal
- Est. fire insurance / yr
- $713 – $1,323
Heat risk 3/10 · Minor
- Hot days now (above 100°F)
- 7 days/yr
- Hot days in 30 yrs
- 18 days/yr
Wind risk 2/10 · Minimal
- Chance of severe wind over 30 yrs
- —
Air-quality risk 3/10 · Minor
- Unhealthy air days now
- 2 days/yr
- Unhealthy air days in 30 yrs
- 3 days/yr
Risk factors via First Street. Map © Google.
Why this score? — see what drove the B- grade
The composite is a weighted blend of 9 inputs, each scored 0–100. Each bar is that input's sub-score; the figure is the points it added to the 100-point composite (weight × sub-score).
- Cash flow +30.0/30.0
- 1% rule +10.0/10.0
- DSCR +10.0/10.0
- ARV discount +7.5/15.0
- Livability +2.8/5.0
- Rent growth +2.5/5.0
- Condition / age +2.5/5.0
- Schools +1.9/10.0
- Appreciation +0.0/10.0
$144,900
🖨 Deal sheet (PDF) 📄 Offer letter ✓ Due diligence
Multi-family units
County records classify this as Multi-Family (2-4 Unit). Listing-text estimate: 4 units. confirmed
Listing remarks MLS
Great Investment opportunity with this well maintained 4 unit conveniently located close to downtown Springfield. Seller pays all utilities. 3 of 4 units are currently rented.
Key facts
- Currently rented
- Well maintained
- Conveniently located
Tags
Neighborhood map
What this means for you Summary
Snapshot
- This is a 4 × 4-bed/4.0-bath units multifamily listed at $145k.
Deal economics
- At list price, monthly cash flow is $4k ($46k/yr) — positive. Per door: $954/mo.
- The deal already cash-flows at list — no discount required.
- Meets the 1% rule at list price ($6k rent vs $145k).
- Recommended offer: $141k (3.0% below list) — sets the bar for market timing.
- Cap rate 37.9% vs local median 4.7% in Springfield — top-decile yield for the area; either an underpriced asset or a hidden risk that comps aren't pricing in. Stress-test before assuming the spread holds.
Location & tenants
- Location reads 56/100 on livability (#1,108 in OH) — a working-class tenant base; expect higher turnover. Strengths: cost of living A+, housing A+; Watch: crime F, amenities F, commute F.
- Springfield City School District (urban): math 20% / reading 27% proficiency, ranked #616 of 656 in OH (top 94%) — low school quality limits family demand, transient renter base, plan for 1-2y turnover; 75% free/reduced lunch — lower-income household profile, screen leases tightly.
- Market conditions: 45 active listings in the ZIP; 1 comparable units currently listed for rent nearby; lower-income renter base — watch delinquency; 232 units permitted in Clark County in 2024 (116 in 5+ unit buildings).
- At $6,029/mo this rent would consume 172% of the median local household income ($42k/yr) (locally 684% of renters already pay >50% of income on rent) — very limited rent-growth headroom before tenants either downsize or default.
Forward outlook
- Local home prices are declining (-3.0%/yr); year-one equity from $1k of loan paydown is wiped out by about $4k of value loss. Plan a longer hold.
- Clark County population projected at -16% by 2050 — secular population decline; favor cash flow + early exit over multi-decade hold.
- At projected returns (-3.0% appreciation + 3.0% rent growth), your $41k cash investment doubles in ~1 year — after that, you're playing with house money.
Negotiation context
- It's been on market 59 days — a 3% lower offer ($141k) is reasonable based on typical stale-listing flexibility.
- 7 sale attempts since 7y ago with the ask held roughly flat each time — persistent listings suggest the price (not the market) is what's stuck; bring a comps-based counter.
- Current owner paid $55k; list at $145k implies a 163% gain — meaningful room to come down on a strong offer.
Risks & watch-outs
- Watch-outs: built in 1896 — expect roof / HVAC / electrical / plumbing capex.
Questions for the listing agent
- It's been on market 59 days. Have you received any prior offers? Is the seller open to a 3% concession, seller financing, or rate buy-down credit?
- Can we see the unit-by-unit rent roll, current vacancy, and any below-market leases? What's the average tenancy length?
- What capital expenditures (roof, boiler, parking lot, exteriors) have been made in the last 5 years, and what's planned in the next 2?
- Built in 1896 — when were the roof, HVAC, electrical panel, plumbing, and water heater last replaced?
- Is there a deadline driving the sale (1031 exchange, divorce, estate, relocation)? That informs how much negotiation room exists.
- Crime grade is F in this area — have there been break-ins, vandalism, or insurance claims at this property in the last 3 years? What carrier currently insures it and at what premium?
- What's the average days-on-market for RENTAL listings here right now (not sales)? A rising rental-DOM trend means longer vacancies and softer asking-rent achievability than the comps imply.
- What's the recent tenant-quality profile in this submarket — average credit score on applications, eviction rate, late-payment / NSF rate, and stable-employment percentage? A property-management company in the area should have these aggregated.
- How much new apartment / multifamily construction is in the pipeline within 1–3 miles? Heavy new supply (>2% of stock underway) typically softens rents 12–24 months out; light construction supports rent growth.
Investment metrics
- 1% rule
- 4.16% ✓
- Cap rate
- 37.89%
- Cash-on-cash
- 112.84%
- DSCR
- 6.02
- GRM
- 2.0
CMA / ARV
- ARV (median comp)
- $85,493
- List price
- $144,900
- Delta
- 69.49%
- Verdict
- OVERPRICED
- Comps
- 20 within 1.0 mi
Show comp detail 8 sales within ~0.75 mi
| Address | Dist | Beds/Ba | Sqft | Sold | Price | $/sf | Match |
|---|---|---|---|---|---|---|---|
| 217-219 N Race St | 0.33mi | 4/2.0 | 2,655 (+4%) | 0mo | $425,000 | $160 | 73 |
| 124-126 N Light St | 0.24mi | 4/2.0 | 2,512 (-1%) | 18mo | $85,000 | $34 | 67 |
| 714 W Jefferson St | 0.14mi | 4/2.0 | 2,288 (-10%) | 12mo | $127,000 | $56 | 63 |
| 712 W Jefferson St | 0.15mi | 4/2.0 | 2,288 (-10%) | 12mo | $127,000 | $56 | 63 |
| 935 W North St | 0.34mi | 5/2.0 (+1) | 2,716 (+7%) | 7mo | $200,000 | $74 | 58 |
| 1103-1105 Broadway St | 0.50mi | 4/2.5 | 2,465 (-3%) | 18mo | $100,000 | $41 | 54 |
| 453-455 N Yellow Springs St | 0.52mi | 4/— | 2,471 (-3%) | 23mo | $190,000 | $77 | 52 |
| 336-338 W Euclid Ave | 0.74mi | 4/2.0 | 2,550 (+0%) | 19mo | $100,000 | $39 | 45 |
Match score weights: distance 35% · size 25% · config 20% · recency 20%. Top-matched comps best support the ARV.
Projected returns pro-forma
-3.0% appreciation · 3.0% rent growth · sell at horizon
- IRR
- —
- Equity multiple
- 6.41×
- Total profit
- $219,563
- Equity at exit
- $21,605
- IRR
- —
- Equity multiple
- 13.43×
- Total profit
- $504,309
- Equity at exit
- $12,528
Cash invested: $40,572 (down + closing). Projections, not guarantees.
Landlord ↔ Tenant lean methodology
- Overall (STATE)
- 73 Landlord-Friendly
- State Ohio
- 73 Landlord-Friendly · R+6
- County
- — inherits STATE
- City
- — inherits STATE
ZIP-level market 45506
- Home prices YoY
- -14.1%
- Active inventory
- 45
- Price-to-rent
- 8.0×
Monthly cashflow live
- Estimated rent
- $6,029 medium interval (Pro) →
- Mortgage (P&I)
- −$760
- Tax from tax record
- −$128 /mo · $1,531/yr
- Insurance
- −$60
- HOA
- −$0
- Vacancy / Maint / Mgmt
- −$1,266
- Net cashflow
- $3,815
Break-even live
Sensitivity live
| Price | -10% $3,897 | -5% $3,856 | +0% $3,815 | +5% $3,774 | +10% $3,733 |
|---|---|---|---|---|---|
| Rent | -10% $3,339 | -5% $3,577 | +0% $3,815 | +5% $4,053 | +10% $4,291 |
| Rate | -1.0pp $3,888 | -0.5pp $3,852 | base $3,815 | +0.5pp $3,778 | +1.0pp $3,739 |
4-unit breakdown (identical units grouped — click to expand)
| Units | Beds | Baths | Est. rent |
|---|---|---|---|
| 4× units | 4 | 4 | $6,028 |
| #1 | 4 | 4 | $1,507 |
| #2 | 4 | 4 | $1,507 |
| #3 | 4 | 4 | $1,507 |
| #4 | 4 | 4 | $1,507 |
| Total (4 units) | $6,029 | ||
UW: 25.0% down · 7.5% · 30yr · 1.5% tax · 5.0% vac · 8.0% maint · 8.0% mgmt
Financing live
Cash to close
- Down payment
- $36,225
- Closing costs
- $4,347
- Reserves months
- —
- Total cash needed
- —
Loan-product check · same deal, 3 products live
Conventional
25% down · 7.5% · 30yr
- Down + closing
- —
- Monthly P&I
- —
- Monthly cashflow
- —
- DSCR
- —
- Eligible?
- —
Personal DTI + credit; lowest rate.
DSCR
20% down · 8.5% · 30yr
- Down + closing
- —
- Monthly P&I
- —
- Monthly cashflow
- —
- DSCR
- —
- Eligible?
- —
No personal income docs; deal must DSCR.
Hard money
10% down · 12.0% · 12mo
- Down + closing
- —
- Monthly P&I
- —
- Monthly cashflow
- —
- DSCR
- —
- Eligible?
- —
Short-term bridge; refi at stabilization.
Rent comps 1 comps
| Address | Beds | Baths | Sqft | Rent | $/sqft | DOM | Units | Dist |
|---|---|---|---|---|---|---|---|---|
| 534 Homeview Ave Springfield, OH | 3.0 | 1.0 | 2660 | $1,200 | $0.45 | 44d | 1 | 1.22mi |
Listing history 35 events
-
2026-06-19days on market $144,900 Active 59 DOM
-
2026-06-18days on market $144,900 Active 58 DOM
-
2026-06-17days on market $144,900 Active 57 DOM
-
2026-06-16days on market $144,900 Active 56 DOM
-
2026-06-15days on market $144,900 Active 55 DOM
-
2026-06-14days on market $144,900 Active 53 DOM
-
2026-06-12days on market $144,900 Active 52 DOM
-
2026-06-09days on market $144,900 Active 49 DOM
-
2026-06-08days on market $144,900 Active 48 DOM
-
2026-06-07days on market $144,900 Active 47 DOM
-
2026-06-05days on market $144,900 Active 44 DOM
-
2026-06-02days on market $144,900 Active 42 DOM
-
2026-06-01days on market $144,900 Active 41 DOM
-
2026-05-31days on market $144,900 Active 40 DOM
-
2026-05-30days on market $144,900 Active 39 DOM
-
2026-04-21$144,900 Active 175-char remark
Show marketing remark (175 chars)
Great Investment opportunity with this well maintained 4 unit conveniently located close to downtown Springfield. Seller pays all utilities. 3 of 4 units are currently rented.
-
2026-04-20$144,900 Active 175-char remark
Show marketing remark (175 chars)
Great Investment opportunity with this well maintained 4 unit conveniently located close to downtown Springfield. Seller pays all utilities. 3 of 4 units are currently rented.
-
2024-11-28historical
-
2024-11-02price $149,900
-
2024-09-13$174,900 Active
-
2022-10-27historical
-
2022-09-06price $149,900
-
2022-06-17price $152,900
-
2022-06-08status Active
-
2022-05-04historical Contingency - Finance and Inspections
-
2022-04-23$154,900 Active
-
2019-10-11soldstatus $55,000
-
2019-10-07soldstatus $55,000
-
2019-10-07soldstatus $55,000 Closed
-
2019-09-11historical
-
2019-03-15$54,900
-
2019-03-13$54,900
-
2002-03-27soldstatus $72,500
-
1993-10-28soldstatus $55,000
-
1988-09-14soldstatus $17,720
ⓘ Source: listings_history table (triggers on properties + properties_extension) + one-shot
backfill from property_details.listing_events for pre-trigger history.
Tax reassessment forecast OH · Partial reset (capped growth)
- Current annual tax
- $1,531 · $128/mo
- Projected year-2 tax
- $1,896 · $158/mo
- Expected delta
- +$365/yr (+$30/mo · 23.8%)
ⓘ Screening estimate from a state-policy table — verify with the county assessor before closing.
Climate risk First Street
- Flood 1/10 Low FEMA zone X (unshaded) · 0% chance over 30 yrs
- Wildfire 1/10 Low
- Heat 3/10 Moderate 7 d/yr ≥100°F today · 18 d/yr by 30 yrs out
- Wind 2/10 Low
- Air quality 3/10 Moderate 2 unhealthy d/yr today · 3 by 30 yrs out
Nearby sold comps map
Loading sold comps map…
Walkable amenities ~0.75 mi
Loading nearby amenities…
Taxation est. · year 1
- Rental income
- $72,348
- − Mortgage interest
- −$8,117
- − Property taxes
- −$1,531
- − Insurance
- −$724
- − Repairs & maintenance
- −$5,788
- − Management
- −$5,788
- − Depreciation
- −$4,215
- Taxable income
- $46,185
- Est. tax owed @ 24.0%
- −$11,084
- After-tax cash flow
- $34,697/yr
For passive investors: Depreciation is non-cash, so a rental often shows a tax loss while cash-flowing — sheltering income. Rental losses are passive: they offset passive income freely, and up to $25,000/yr can offset ordinary (W-2) income if you actively participate and your MAGI is under $100k (phasing out to $0 by $150k); unused losses carry forward. On sale, claimed depreciation is recaptured at up to 25%, and gains may owe capital-gains tax (a 1031 exchange can defer both). Figures are a year-1 estimate at your 24.0% rate — not tax advice; consult a CPA.
Schools (NCES district)
- District
- Springfield City School District
- NCES district ID
- 3904481
- Math proficiency
- 20% ▼ -16.00%
- Reading proficiency
- 27% ▼ -12.00%
- Median HH income
- $32,541
- Composite
- 19.12/100
- National rank
- #8834
- State rank
- #616 of 656 in OH
Livability — Springfield
- Score
- 56/100
- State rank
- #1108
- US rank
- #22551
Category grades
Schools grade is shown separately in the Schools card above.
Census & demographics
- Census place
- Springfield, OH
- County
- Clark County · 33,261 people
- City population
- 33,261
- Metro
- Springfield, OH
- Population (ZIP)
- 13,435
- Household income
- $42,104
- Rent vs Own
- Severe rent burden
- 684.0
Population outlook (Clark County) Hauer SSP2
- Today (2025)
- 130,703 people
- By 2030
- 126,952 · -2.9%
- By 2040
- 118,344 · -9.5%
- By 2050
- 109,590 · -16.2%
- By 2075
- 89,464 · -31.6%
- By 2100
- 68,810 · -47.4%
Race, ethnicity, and origin ACS 2023
- Neighborhood character
- Diverse neighborhood (Simpson 0.62)
- Race & ethnicity
- White 53% Black 30% Two or more races 10% Hispanic / Latino 8%
- Hispanic origin (detail)
- Mexican 4% Puerto Rican 1%
- Common ancestry
- Serbian 2% Romanian 1% Iranian 1%
- Foreign-born
- 4% · Canada
- Languages at home
- 95% English-only · Spanish 4% Other Asian/Pacific 1%
Political lean MEDSL · Clark
- 2024 margin
- Strong R (+29.5) · D 34.8% · R 64.3%
- 2008→2024 swing
- -27.0pp toward R · 2008: -2.5pp · 2024: -29.5pp
- All cycles
- 2024: R+29.5 2020: R+23.3 2016: R+19.5 2012: R+1.8 2008: R+2.5
Not yet ingested
- Civics
- —
Market trends
- HPI YoY
- ▼ -46.97%
- Current HPI
- 286.2883
- Rent YoY
- —
- Metro
- Springfield, OH
- State GDP YoY
- ▲ 1.98%
- F500 in state
- 48
Industry mix (Fortune 500 HQ in OH)
| Industry | F500 HQs | Revenue |
|---|---|---|
| Insurance | 3 | $145B |
|
||
| Industrial Machinery | 3 | $49B |
|
||
| Financial Services | 3 | $24B |
|
||
| Consumer Goods | 2 | $93B |
|
||
| Aerospace / Defense | 2 | $47B |
|
||
| Utilities | 2 | $33B |
|
||
Price history
+717.7% since first listed20 events — show timeline
- 2026-04-21 Listed $144,900 Dayton MLS
- 2026-04-20 Listed $144,900 WRIST
- 2024-11-28 Listing Removed — WRIST
- 2024-11-02 Price Changed $149,900 WRIST
- 2024-09-13 Listed $174,900 WRIST
- 2022-10-27 Listing Removed — WRIST
- 2022-09-06 Price Changed $149,900 WRIST
- 2022-06-17 Price Changed $152,900 WRIST
- 2022-06-08 Relisted — WRIST
- 2022-05-04 Contingent — WRIST
- 2022-04-23 Listed $154,900 WRIST
- 2019-10-11 Sold (Public Records) $55,000 Public Records
- 2019-10-07 Sold (MLS) $55,000 Dayton MLS
- 2019-10-07 Sold (MLS) $55,000 Dayton MLS
- 2019-09-11 Listing Removed — WRIST
- 2019-03-15 Listed $54,900 Dayton MLS
- 2019-03-13 Listed $54,900 WRIST
- 2002-03-27 Sold (Public Records) $72,500 Public Records
- 1993-10-28 Sold (Public Records) $55,000 Public Records
- 1988-09-14 Sold (Public Records) $17,720 Public Records
Property tax history
+7.7%/yrLatest (2025): $1,531 · +28.0% YoY. Source: county tax records.
Cash-flow waterfall
monthlySold comps — $/sqft
last 12 mo · ≤1 miLoading sold comps…