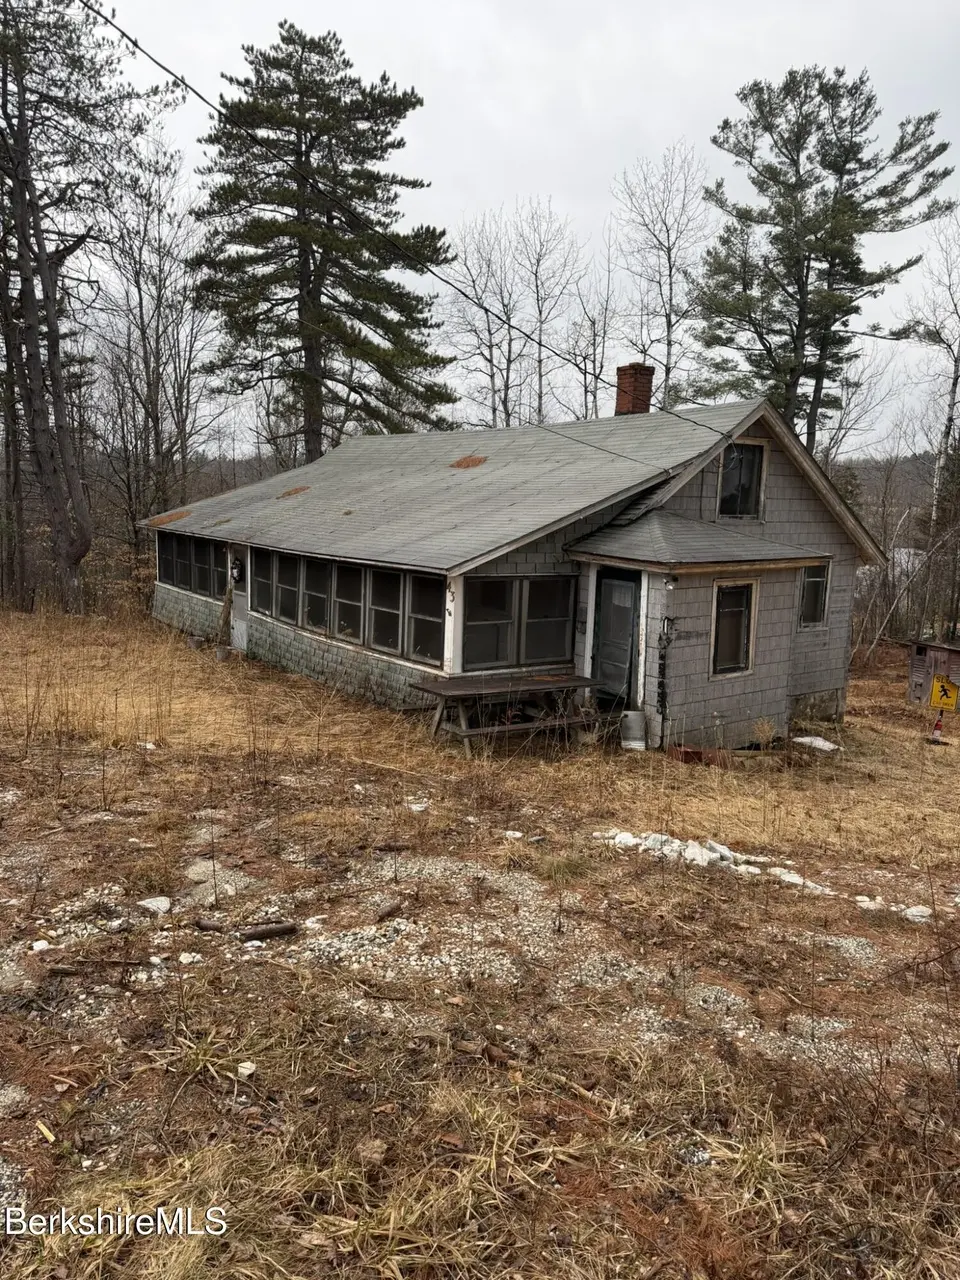
43 Access Road 4 Rd · North Adams, MA
Flood risk No data
- FEMA flood zone
- —
- Chance of flooding over 30 yrs
- —
- Est. flood insurance / yr
- —
Fire risk No data
- Est. fire insurance / yr
- —
Heat risk No data
- Hot days now (above threshold)
- —
- Hot days in 30 yrs
- —
Wind risk No data
- Chance of severe wind over 30 yrs
- —
Air-quality risk No data
- Unhealthy air days now
- —
- Unhealthy air days in 30 yrs
- —
Risk factors via First Street. Map © Google.
Why this score? — see what drove the C grade
The composite is a weighted blend of 9 inputs, each scored 0–100. Each bar is that input's sub-score; the figure is the points it added to the 100-point composite (weight × sub-score).
- Cash flow +20.4/30.0
- ARV discount +7.5/15.0
- DSCR +6.5/10.0
- Appreciation +6.2/10.0
- 1% rule +5.4/10.0
- Schools +3.5/10.0
- Livability +2.8/5.0
- Rent growth +2.5/5.0
- Condition / age +1.0/5.0
$114,999
🖨 Deal sheet (PDF) 📄 Offer letter ✓ Due diligence
Listing remarks MLS
3 Bedroom camp with deeded lake rights at Windsor Pond. Ready for the new owner to make it their dreams into reality, needs well & septic, priced to sell
Key facts
- 0.47 acre lot
- Built 1900
- Listed 80 days
Neighborhood map
What this means for you Summary
Snapshot
- This is a 3-bed/1.0-bath single-family listed at $115k. Condition is rated poor.
Deal economics
- At list price, monthly cash flow is $149 ($2k/yr) — positive.
- The deal already cash-flows at list — no discount required.
- Meets the 1% rule at list price ($1k rent vs $115k).
- Recommended offer: $108k (6.0% below list) — sets the bar for market timing.
- Cap rate 7.8% vs local median 6.0% in North Adams — top-decile yield for the area; either an underpriced asset or a hidden risk that comps aren't pricing in. Stress-test before assuming the spread holds.
Location & tenants
- Location reads 55/100 on livability (#242 in MA) — a working-class tenant base; expect higher turnover. Strengths: housing A+, cost of living A-; Watch: employment C-, health & safety D, crime F.
- Central Berkshire (rural): math 32% / reading 47% proficiency, ranked #206 of 302 in MA (top 68%) — families likely to look elsewhere, expect single-tenant / working-renter base with shorter leases.
- Zoned schools: Nessacus Regional Middle School (math 27% / reading 44%, grade F, #175 of 305 statewide, top 58%, 345 students, 0% FRL); Wahconah Regional High (math 47% / reading 62%, grade C-, #157 of 343 statewide, top 47%, 485 students, 0% FRL) — zoned schools average 0% FRL vs 26% district-wide (26 pts lower); this property's tenant base skews higher-income than the district average.
- Market conditions: 6 active listings in the ZIP; 130 units permitted in Berkshire County in 2024 (10 in 5+ unit buildings).
Forward outlook
- In year one you build about $4k of equity ($795 loan paydown + $3k appreciation (2.4% local appreciation)).
- Berkshire County population projected at -24% by 2050 — secular population decline; favor cash flow + early exit over multi-decade hold.
- At projected returns (2.4% appreciation + 3.0% rent growth), your $32k cash investment doubles in ~6 years — after that, you're playing with house money.
- By year 9, paydown + projected appreciation supports a ~$30k cash-out refi (75% LTV) — recoverable capital for the next deal without selling this one.
Negotiation context
- It's been on market 81 days — a 6% lower offer ($108k) is reasonable based on typical stale-listing flexibility.
Risks & watch-outs
- Watch-outs: built in 1900 — expect roof / HVAC / electrical / plumbing capex.
Questions for the listing agent
- It's been on market 81 days. Have you received any prior offers? Is the seller open to a 6% concession, seller financing, or rate buy-down credit?
- Have any recent inspections been done? Can we get a copy of the seller's disclosures and any deferred-maintenance estimates?
- Built in 1900 — when were the roof, HVAC, electrical panel, plumbing, and water heater last replaced?
- Why hasn't it sold? Are there any deal-killer items the seller is aware of (foundation, flood, title, zoning, code violations)?
- Is there a deadline driving the sale (1031 exchange, divorce, estate, relocation)? That informs how much negotiation room exists.
- Schools are F-rated, which usually means shorter tenancies and higher turnover. Who's the typical renter profile here, and what's been the actual vacancy rate?
- Crime grade is F in this area — have there been break-ins, vandalism, or insurance claims at this property in the last 3 years? What carrier currently insures it and at what premium?
- What's the average days-on-market for RENTAL listings here right now (not sales)? A rising rental-DOM trend means longer vacancies and softer asking-rent achievability than the comps imply.
- What's the recent tenant-quality profile in this submarket — average credit score on applications, eviction rate, late-payment / NSF rate, and stable-employment percentage? A property-management company in the area should have these aggregated.
- How much new for-sale + rental construction is in the pipeline within 1–3 miles? Heavy new supply typically softens prices + rents 12–24 months out; constrained supply supports both.
Investment metrics
- 1% rule
- 1.04% ✓
- Cap rate
- 7.84%
- Cash-on-cash
- 5.54%
- DSCR
- 1.25
- GRM
- 8.0
CMA / ARV
No comps found within radius.
Projected returns pro-forma
2.36% appreciation · 3.0% rent growth · sell at horizon
- IRR
- 11.0%
- Equity multiple
- 1.61×
- Total profit
- $19,518
- Equity at exit
- $47,646
- IRR
- 13.6%
- Equity multiple
- 2.90×
- Total profit
- $61,134
- Equity at exit
- $70,413
Cash invested: $32,200 (down + closing). Projections, not guarantees.
Landlord ↔ Tenant lean methodology
- Overall (STATE)
- 20 Strongly Tenant-Friendly
- State Massachusetts
- 20 Strongly Tenant-Friendly · D+15
- County
- — inherits STATE
- City
- — inherits STATE
ZIP-level market 01270
- Home prices YoY
- 0.7%
- Active inventory
- 6
- Price-to-rent
- 8.0×
Monthly cashflow live
- Estimated rent
- $1,194 medium interval (Pro) →
- Mortgage (P&I)
- −$603
- Tax est. 1.5%
- −$144 /mo · $1,725/yr
- Insurance
- −$48
- HOA
- −$0
- Vacancy / Maint / Mgmt
- −$251
- Net cashflow
- $149
Break-even live
Sensitivity live
| Price | -10% $228 | -5% $188 | +0% $149 | +5% $109 | +10% $69 |
|---|---|---|---|---|---|
| Rent | -10% $54 | -5% $101 | +0% $149 | +5% $196 | +10% $243 |
| Rate | -1.0pp $207 | -0.5pp $178 | base $149 | +0.5pp $119 | +1.0pp $88 |
UW: 25.0% down · 7.5% · 30yr · 1.5% tax · 5.0% vac · 8.0% maint · 8.0% mgmt
Financing live
Cash to close
- Down payment
- $28,750
- Closing costs
- $3,450
- Reserves months
- —
- Total cash needed
- —
Loan-product check · same deal, 3 products live
Conventional
25% down · 7.5% · 30yr
- Down + closing
- —
- Monthly P&I
- —
- Monthly cashflow
- —
- DSCR
- —
- Eligible?
- —
Personal DTI + credit; lowest rate.
DSCR
20% down · 8.5% · 30yr
- Down + closing
- —
- Monthly P&I
- —
- Monthly cashflow
- —
- DSCR
- —
- Eligible?
- —
No personal income docs; deal must DSCR.
Hard money
10% down · 12.0% · 12mo
- Down + closing
- —
- Monthly P&I
- —
- Monthly cashflow
- —
- DSCR
- —
- Eligible?
- —
Short-term bridge; refi at stabilization.
Listing history 18 events
-
2026-06-22days on market $114,999 Active 81 DOM
-
2026-06-19days on market $114,999 Active 78 DOM
-
2026-06-18days on market $114,999 Active 77 DOM
-
2026-06-17days on market $114,999 Active 76 DOM
-
2026-06-16days on market $114,999 Active 75 DOM
-
2026-06-15days on market $114,999 Active 74 DOM
-
2026-06-14days on market $114,999 Active 72 DOM
-
2026-06-12days on market $114,999 Active 71 DOM
-
2026-06-09days on market $114,999 Active 68 DOM
-
2026-06-08days on market $114,999 Active 67 DOM
-
2026-06-07days on market $114,999 Active 66 DOM
-
2026-06-05days on market $114,999 Active 63 DOM
-
2026-06-03days on market $114,999 Active 62 DOM
-
2026-06-02days on market $114,999 Active 61 DOM
-
2026-06-01days on market $114,999 Active 60 DOM
-
2026-05-31days on market $114,999 Active 59 DOM
-
2026-05-30days on market $114,999 Active 58 DOM
-
2026-04-02$114,999 Active 157-char remark
Show marketing remark (157 chars)
3 Bedroom camp with deeded lake rights at Windsor Pond. Ready for the new owner to make it their dreams into reality, needs well & septic, priced to sell
ⓘ Source: listings_history table (triggers on properties + properties_extension) + one-shot
backfill from property_details.listing_events for pre-trigger history.
Nearby sold comps map
Loading sold comps map…
Walkable amenities ~0.75 mi
Loading nearby amenities…
Taxation est. · year 1
- Rental income
- $14,329
- − Mortgage interest
- −$6,442
- − Property taxes
- −$1,725
- − Insurance
- −$575
- − Repairs & maintenance
- −$1,146
- − Management
- −$1,146
- − Depreciation
- −$3,345
- Taxable loss
- −$51
- Est. tax savings @ 24.0%
- +$12
- After-tax cash flow
- $1,795/yr
For passive investors: Depreciation is non-cash, so a rental often shows a tax loss while cash-flowing — sheltering income. Rental losses are passive: they offset passive income freely, and up to $25,000/yr can offset ordinary (W-2) income if you actively participate and your MAGI is under $100k (phasing out to $0 by $150k); unused losses carry forward. On sale, claimed depreciation is recaptured at up to 25%, and gains may owe capital-gains tax (a 1031 exchange can defer both). Figures are a year-1 estimate at your 24.0% rate — not tax advice; consult a CPA.
Condition & rehab AI · 11 photos
This property requires extensive repairs and updates to bring it up to modern standards, significantly impacting its resale and rental value.
Repairs flagged
- Major roof — visible rust and wear
- Major exterior siding — dilapidated and in poor condition
- Major kitchen appliances — dated and worn
- Major bathroom fixtures — old and worn
- Major flooring — worn and uneven tiles
- Major paint — peeling and bare walls
Value-add opportunities
- Both new roof — improves safety and appearance
- Both exterior siding repair — enhances curb appeal and value
- Both kitchen appliances — modernizes and increases functionality
- Both bathroom fixtures — updates and improves functionality
- Both flooring replacement — creates a more modern and functional space
- Both paint job — updates the interior and enhances the home's appearance
Renovation cost estimate screening
| Repair item | Severity | Est. cost |
|---|---|---|
| roof · visible rust and wear | Major | $15,000–50,000 |
| exterior siding · dilapidated and in poor condition | Major | $15,000–50,000 |
| kitchen appliances · dated and worn | Major | $15,000–50,000 |
| bathroom fixtures · old and worn | Major | $15,000–50,000 |
| flooring · worn and uneven tiles | Major | $15,000–50,000 |
| paint · peeling and bare walls | Major | $15,000–50,000 |
| Total estimated repair cost · 6 items | $90,000–300,000 |
Value-add ROI direction
- Both new roof — improves safety and appearance ↑
- Both exterior siding repair — enhances curb appeal and value ↑
- Both kitchen appliances — modernizes and increases functionality ↑
- Both bathroom fixtures — updates and improves functionality ↑
- Both flooring replacement — creates a more modern and functional space ↑
- Both paint job — updates the interior and enhances the home's appearance ↑
ⓘ Cost ranges are severity-bucket heuristics (US national rule-of-thumb). Get contractor quotes + a written scope before underwriting a rehab budget.
Schools (NCES district)
- District
- Central Berkshire
- NCES district ID
- 2503390
- Math proficiency
- 32% ▼ -13.00%
- Reading proficiency
- 47% ▲ 1.00%
- Median HH income
- $58,145
- Composite
- 34.8/100
- National rank
- #5108
- State rank
- #206 of 302 in MA
Livability — North Adams
- Score
- 55/100
- State rank
- #242
- US rank
- #23506
Category grades
Schools grade is shown separately in the Schools card above.
Census & demographics
- City population
- 14,967
- Population (ZIP)
- 1,002
Population outlook (Berkshire County) Hauer SSP2
- Today (2025)
- 119,723 people
- By 2030
- 114,608 · -4.3%
- By 2040
- 102,806 · -14.1%
- By 2050
- 91,305 · -23.7%
- By 2075
- 71,517 · -40.3%
- By 2100
- 57,988 · -51.6%
Race, ethnicity, and origin ACS 2023
- Neighborhood character
- Predominantly White (83%)
- Race & ethnicity
- White 83% Two or more races 16% Hispanic / Latino 1%
- Common ancestry
- Romanian 11% Lithuanian 8% Slovak 7%
- Foreign-born
- 2% · Canada, China
- Languages at home
- 98% English-only · Chinese 1% Other Indo-European 1%
Political lean MEDSL · Berkshire
- 2024 margin
- Solid D (+39.9) · D 68.9% · R 29.0% · Other 2.1%
- 2008→2024 swing
- -12.5pp toward R · 2008: 52.4pp · 2024: 39.9pp
- All cycles
- 2024: D+39.9 2020: D+47.1 2016: D+41.5 2012: D+53.7 2008: D+52.4
Not yet ingested
- Civics
- —
Market trends
- HPI YoY
- ▲ 2.36%
- Current HPI
- 338.0122
- Rent YoY
- —
- Metro
- —
- State GDP YoY
- ▲ 2.28%
- F500 in state
- 38
Industry mix (Fortune 500 HQ in MA)
| Industry | F500 HQs | Revenue |
|---|---|---|
| Technology | 3 | $17B |
|
||
| Insurance | 2 | $84B |
|
||
| Retail | 2 | $76B |
|
||
| Life Sciences | 1 | $43B |
|
||
| Energy Technology | 1 | $31B |
|
||
| Aerospace / Defense | 1 | $18B |
|
||
Price history
1 event — show timeline
- 2026-04-02 Listed $114,999 BCMLS
Cash-flow waterfall
monthlySold comps — $/sqft
last 12 mo · ≤1 miLoading sold comps…