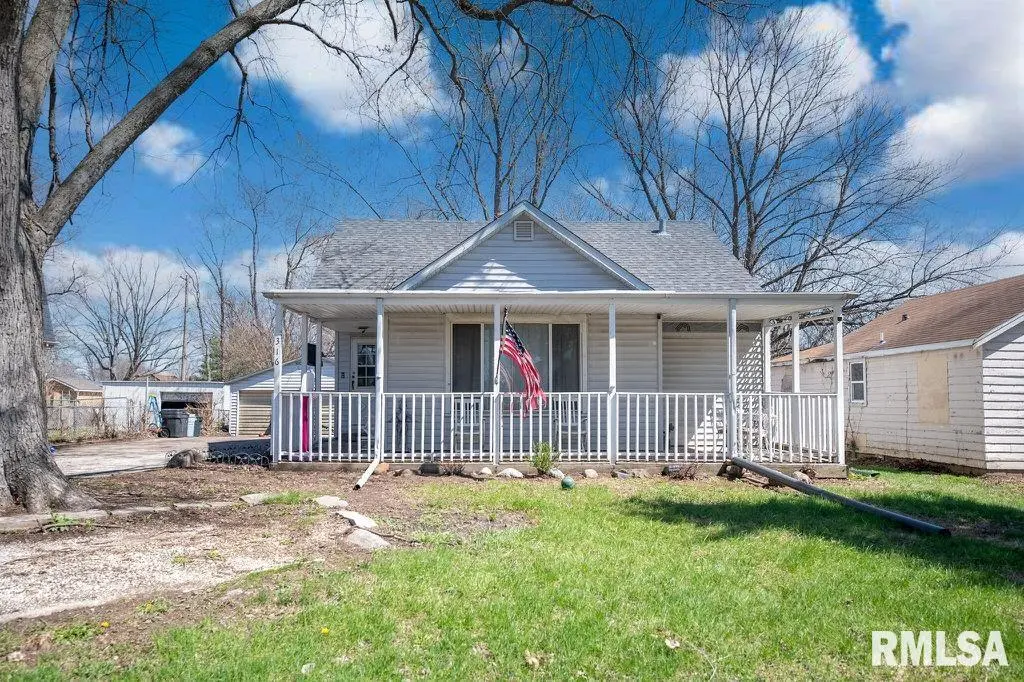
316 S Limestone Ave · Bellevue, IL
Flood risk 1/10 · Minimal
- FEMA flood zone
- —
- Chance of flooding over 30 yrs
- 0.0%
- Est. flood insurance / yr
- —
Fire risk 1/10 · Minimal
- Est. fire insurance / yr
- $804 – $1,492
Heat risk 3/10 · Minor
- Hot days now (above 105°F)
- 7 days/yr
- Hot days in 30 yrs
- 18 days/yr
Wind risk 2/10 · Minimal
- Chance of severe wind over 30 yrs
- 1.0%
Air-quality risk 3/10 · Minor
- Unhealthy air days now
- 1 days/yr
- Unhealthy air days in 30 yrs
- 3 days/yr
Risk factors via First Street. Map © Google.
Why this score? — see what drove the C grade
The composite is a weighted blend of 9 inputs, each scored 0–100. Each bar is that input's sub-score; the figure is the points it added to the 100-point composite (weight × sub-score).
- Cash flow +19.2/30.0
- ARV discount +14.8/15.0
- DSCR +6.1/10.0
- 1% rule +5.6/10.0
- Livability +3.2/5.0
- Rent growth +3.1/5.0
- Schools +2.9/10.0
- Condition / age +2.5/5.0
- Appreciation +0.0/10.0
$130,000
🖨 Deal sheet 📄 Offer letter ✓ Due diligence
Listing remarks MLS
HOME SOLD AS-IS* VERY NICE SIZED 3-4 BEDROOM HOME IN BELLEVUE* LARGE GARAGE, FINISHED BASEMENT, NEWER SIDING & KITCHEN* CALL 657-8182 FOR DETAILS*
Key facts
- Enclosed back porch
- Laundry area
- Rec room
Tags
Property features AI
Exterior
- Parking: Detached 2-car garage
- Utilities: Public water; Public sewer; Electric service (standard)
- Home design: Single family residence; Shingle roof; Built in 1938; Living area approximately 1326
- Construction: Year built 1938
- Exterior features: Level lot; Lot dimensions approximately 50 x 160
Interior
- Kitchen: Kitchen with refrigerator and microwave
- Bedrooms: 4 bedrooms total; Main-level bedroom (11' x 11') with egress window; Main-level bedroom (12' x 10') with egress window; Upper-level bedroom (14' x 11') with egress window; Upper-level bedroom (12' x 12') with egress window
- Flooring: Luxury vinyl plank flooring in main living areas and some bedrooms; Carpet in upper-level bedrooms
- Bathrooms: 1 full bathroom
- Heating & cooling: Forced air heating; Central air conditioning
- Interior features: Microwave; Refrigerator; Full, partially finished basement; No fireplaces
- Laundry & utility: Laundry room in basement; Gas water heater
Neighborhood map
What this means for you Summary
Snapshot
- This is a 3-bed/1.0-bath single-family listed at $130k.
Deal economics
- At list price, monthly cash flow is $140 ($2k/yr) — positive.
- The deal already cash-flows at list — no discount required.
- Meets the 1% rule at list price ($1k rent vs $130k).
- Recommended offer: $126k (3.0% below list) — sets the bar for market timing.
Location & tenants
- Location reads 65/100 on livability (#601 in IL) — a middle-class / working-renter tenant base. Strengths: crime A+, cost of living A+, housing A+; Watch: employment C-, amenities F, commute F.
- Limestone Chsd 310 (rural): math 25% / reading 35% proficiency, ranked #486 of 919 in IL (top 53%) — families likely to look elsewhere, expect single-tenant / working-renter base with shorter leases.
- Zoned schools: Limestone Community High School (math 17% / reading 22%, grade F, #397 of 693 statewide, top 61%, 924 students, 0% FRL).
- Market conditions: Rents rising (+2.3%/yr); 180 active listings in the ZIP; 73 units permitted in Peoria County in 2024 (0 in 5+ unit buildings).
- This rent runs 31% of the median local income ($52k/yr) — at the standard rent-burdened threshold; future hikes will face affordability resistance.
Forward outlook
- Local home prices are declining (-3.0%/yr); year-one equity from $899 of loan paydown is wiped out by about $4k of value loss. Plan a longer hold.
- Peoria County population projected at -11% by 2050 — secular population decline; favor cash flow + early exit over multi-decade hold.
Negotiation context
- It's been on market 48 days — a 3% lower offer ($126k) is reasonable based on typical stale-listing flexibility.
- 3 sale attempts since 27y ago with the ask held roughly flat each time — persistent listings suggest the price (not the market) is what's stuck; bring a comps-based counter.
- Current owner paid $65k; list at $130k implies a 100% gain — meaningful room to come down on a strong offer.
Risks & watch-outs
- Watch-outs: built in 1938 — expect roof / HVAC / electrical / plumbing capex.
Questions for the listing agent
- It's been on market 48 days. Have you received any prior offers? Is the seller open to a 3% concession, seller financing, or rate buy-down credit?
- Built in 1938 — when were the roof, HVAC, electrical panel, plumbing, and water heater last replaced?
- Is there a deadline driving the sale (1031 exchange, divorce, estate, relocation)? That informs how much negotiation room exists.
- Schools are D-rated, which usually means shorter tenancies and higher turnover. Who's the typical renter profile here, and what's been the actual vacancy rate?
- What's the average days-on-market for RENTAL listings here right now (not sales)? A rising rental-DOM trend means longer vacancies and softer asking-rent achievability than the comps imply.
- What's the recent tenant-quality profile in this submarket — average credit score on applications, eviction rate, late-payment / NSF rate, and stable-employment percentage? A property-management company in the area should have these aggregated.
- How much new for-sale + rental construction is in the pipeline within 1–3 miles? Heavy new supply typically softens prices + rents 12–24 months out; constrained supply supports both.
Investment metrics
- 1% rule
- 1.06% ✓
- Cap rate
- 7.58%
- Cash-on-cash
- 4.61%
- DSCR
- 1.21
- GRM
- 7.9
CMA / ARV
- ARV (on-the-fly)
- $155,142
- Comps found
- 12
Show comp detail 12 sales within ~0.75 mi
| Address | Dist | Beds/Ba | Sqft | Sold | Price | $/sf | Match |
|---|---|---|---|---|---|---|---|
| 316 S Limestone Ave | 0.00mi | 4/1.0 (+1) | 1,326 (0%) | 1mo | $130,000 | $98 | 94 |
| 406 S Limestone Ave | 0.04mi | 3/2.0 | 1,320 (-0%) | 16mo | $175,000 | $133 | 80 |
| 537 S Byron Ct | 0.29mi | 2/1.0 (-1) | 1,383 (+4%) | 6mo | $95,000 | $69 | 69 |
| 5610 W Overland Pass | 0.58mi | 3/1.0 | 1,308 (-1%) | 3mo | $189,900 | $145 | 68 |
| 324 S Main St | 0.07mi | 3/2.0 | 1,248 (-6%) | 18mo | $100,000 | $80 | 68 |
| 622 S Byron Ct | 0.38mi | 3/1.5 | 1,381 (+4%) | 13mo | $161,700 | $117 | 62 |
| 213 N Eisele Dr | 0.51mi | 3/1.0 | 1,248 (-6%) | 6mo | $130,000 | $104 | 62 |
| 1015 S Mesa Dr | 0.59mi | 3/1.5 | 1,287 (-3%) | 12mo | $208,500 | $162 | 56 |
| 4823 W Closen Ave | 0.46mi | 3/2.0 | 1,164 (-12%) | 9mo | $135,000 | $116 | 47 |
| 625 N Tower Rd | 0.70mi | 2/1.0 (-1) | 1,278 (-4%) | 16mo | $144,900 | $113 | 43 |
| 4815 W Plank Rd | 0.48mi | 3/2.0 | 1,489 (+12%) | 15mo | $430,000 | $289 | 40 |
| 5624 W Cherokee Path | 0.68mi | 2/2.0 (-1) | 1,188 (-10%) | 7mo | $190,000 | $160 | 36 |
Match score weights: distance 35% · size 25% · config 20% · recency 20%. Top-matched comps best support the ARV.
Projected returns pro-forma
-3.0% appreciation · 2.3% rent growth · sell at horizon
- IRR
- -9.9%
- Equity multiple
- 0.64×
- Total profit
- $-13,067
- Equity at exit
- $19,383
- IRR
- -1.5%
- Equity multiple
- 0.90×
- Total profit
- $-3,591
- Equity at exit
- $11,240
Cash invested: $36,400 (down + closing). Projections, not guarantees.
Landlord ↔ Tenant lean methodology
- Overall (STATE)
- 43 Moderately Tenant-Leaning
- State Illinois
- 43 Moderately Tenant-Leaning · D+7
- County
- — inherits STATE
- City
- — inherits STATE
ZIP-level market 61604
- Home prices YoY
- -24.6%
- Rents YoY
- 2.3%
- Active inventory
- 180
- Price-to-rent
- 7.9×
Monthly cashflow live
- Estimated rent
- $1,372 medium interval (Pro) →
- Mortgage (P&I)
- −$682
- Tax from tax record
- −$208 /mo · $2,501/yr
- Insurance
- −$54
- HOA
- −$0
- Vacancy / Maint / Mgmt
- −$288
- Net cashflow
- $140
Break-even live
UW: 25.0% down · 7.5% · 30yr · 1.5% tax · 5.0% vac · 8.0% maint · 8.0% mgmt
Financing live
Cash to close
- Down payment
- $32,500
- Closing costs
- $3,900
- Reserves months
- —
- Total cash needed
- —
Loan-product check · same deal, 3 products live
Conventional
25% down · 7.5% · 30yr
- Down + closing
- —
- Monthly P&I
- —
- Monthly cashflow
- —
- DSCR
- —
- Eligible?
- —
Personal DTI + credit; lowest rate.
DSCR
20% down · 8.5% · 30yr
- Down + closing
- —
- Monthly P&I
- —
- Monthly cashflow
- —
- DSCR
- —
- Eligible?
- —
No personal income docs; deal must DSCR.
Hard money
10% down · 12.0% · 12mo
- Down + closing
- —
- Monthly P&I
- —
- Monthly cashflow
- —
- DSCR
- —
- Eligible?
- —
Short-term bridge; refi at stabilization.
Listing history 8 events
-
2026-04-16historical Under Contract
-
2026-04-11$130,000 Active
-
2002-01-25soldstatus $65,000
-
2002-01-24soldstatus $69,000 150-char remark
Show marketing remark (150 chars)
HOME SOLD AS-IS* VERY NICE SIZED 3-4 BEDROOM HOME IN BELLEVUE* LARGE GARAGE, FINISHED BASEMENT, NEWER SIDING & KITCHEN* CALL 657-8182 FOR DETAILS*
-
2001-11-23$79,900 150-char remark
Show marketing remark (150 chars)
HOME SOLD AS-IS* VERY NICE SIZED 3-4 BEDROOM HOME IN BELLEVUE* LARGE GARAGE, FINISHED BASEMENT, NEWER SIDING & KITCHEN* CALL 657-8182 FOR DETAILS*
-
1999-12-16soldstatus $70,000
-
1999-12-14soldstatus $70,000
-
1999-10-23$74,900
ⓘ Source: listings_history table (triggers on properties + properties_extension) + one-shot
backfill from property_details.listing_events for pre-trigger history.
Tax reassessment forecast IL · Partial reset (capped growth)
- Current annual tax
- $2,501 · $208/mo
- Projected year-2 tax
- $2,726 · $227/mo
- Expected delta
- +$225/yr (+$19/mo · 9.0%)
ⓘ Screening estimate from a state-policy table — verify with the county assessor before closing.
Climate risk First Street
- Flood 1/10 Low 0% chance over 30 yrs
- Wildfire 1/10 Low
- Heat 3/10 Moderate 7 d/yr ≥105°F today · 18 d/yr by 30 yrs out
- Wind 2/10 Low 100% chance of damaging wind over 30 yrs
- Air quality 3/10 Moderate 1 unhealthy d/yr today · 3 by 30 yrs out
Nearby sold comps map
Loading sold comps map…
Walkable amenities ~0.75 mi
Loading nearby amenities…
Taxation est. · year 1
- Rental income
- $16,468
- − Mortgage interest
- −$7,282
- − Property taxes
- −$2,501
- − Insurance
- −$650
- − Repairs & maintenance
- −$1,317
- − Management
- −$1,317
- − Depreciation
- −$3,782
- Taxable loss
- −$381
- Est. tax savings @ 24.0%
- +$91
- After-tax cash flow
- $1,770/yr
For passive investors: Depreciation is non-cash, so a rental often shows a tax loss while cash-flowing — sheltering income. Rental losses are passive: they offset passive income freely, and up to $25,000/yr can offset ordinary (W-2) income if you actively participate and your MAGI is under $100k (phasing out to $0 by $150k); unused losses carry forward. On sale, claimed depreciation is recaptured at up to 25%, and gains may owe capital-gains tax (a 1031 exchange can defer both). Figures are a year-1 estimate at your 24.0% rate — not tax advice; consult a CPA.
Schools (NCES district)
- District
- Limestone Chsd 310
- NCES district ID
- 1722950
- Math proficiency
- 25% ▲ 5.00%
- Reading proficiency
- 35% ▲ 4.00%
- Median HH income
- $49,759
- Composite
- 28.99/100
- National rank
- #11932
- State rank
- #486 of 919 in IL
Livability — Bellevue
- Score
- 65/100
- State rank
- #601
- US rank
- #12423
Category grades
Schools grade is shown separately in the Schools card above.
Census & demographics
- Census place
- Bellevue, IL
- County
- Peoria County · 120,495 people
- Metro
- Peoria, IL
- Population (ZIP)
- 28,313
- Household income
- $52,414
- Rent vs Own
- Severe rent burden
- 815.0
Population outlook (Peoria County) Hauer SSP2
- Today (2025)
- 183,007 people
- By 2030
- 179,643 · -1.8%
- By 2040
- 171,782 · -6.1%
- By 2050
- 163,508 · -10.7%
- By 2075
- 140,178 · -23.4%
- By 2100
- 114,493 · -37.4%
Race, ethnicity, and origin ACS 2023
- Neighborhood character
- Diverse neighborhood (Simpson 0.61)
- Race & ethnicity
- White 55% Black 29% Two or more races 10% Hispanic / Latino 7% Asian 2%
- Hispanic origin (detail)
- Mexican 5%
- Common ancestry
- Italian 2% Slovak 1% Iranian 1%
- Foreign-born
- 6% · Canada, China
- Languages at home
- 92% English-only · Spanish 4% Chinese 1% French/Haitian/Cajun 1%
Political lean MEDSL · Peoria
- 2024 margin
- Toss-up / Even · D 51.5% · R 46.9% · Other 1.6%
- 2008→2024 swing
- -9.2pp toward R · 2008: 13.9pp · 2024: 4.7pp
- All cycles
- 2024: D+4.7 2020: D+6.3 2016: D+2.8 2012: D+4.4 2008: D+13.9
Not yet ingested
- Civics
- —
Market trends
- HPI YoY
- ▼ -54.15%
- Current HPI
- 165.8838
- Rent YoY
- ▲ 2.30%
- Metro
- Peoria, IL
- State GDP YoY
- ▲ 1.59%
- F500 in state
- 60
Industry mix (Fortune 500 HQ in IL)
| Industry | F500 HQs | Revenue |
|---|---|---|
| Insurance | 4 | $201B |
|
||
| Consumer Goods | 4 | $87B |
|
||
| Industrial Machinery | 3 | $64B |
|
||
| Healthcare | 2 | $55B |
|
||
| Retail / Pharmacy | 1 | $148B |
|
||
| Agriculture / Food | 1 | $86B |
|
||
Price history
+73.6% since first listed8 events — show timeline
- 2026-04-16 Contingent — RMLSA as Distributed by MLS Grid
- 2026-04-11 Listed $130,000 RMLSA as Distributed by MLS Grid
- 2002-01-25 Sold (Public Records) $65,000 Public Records
- 2002-01-24 Sold (MLS) $69,000 RMLSA as Distributed by MLS Grid
- 2001-11-23 Listed $79,900 RMLSA as Distributed by MLS Grid
- 1999-12-16 Sold (Public Records) $70,000 Public Records
- 1999-12-14 Sold (MLS) $70,000 RMLSA as Distributed by MLS Grid
- 1999-10-23 Listed $74,900 RMLSA as Distributed by MLS Grid
Property tax history
+0.7%/yrLatest (2024): $2,501 · +8.0% YoY. Source: county tax records.
Cash-flow waterfall
monthlySold comps — $/sqft
last 12 mo · ≤1 miLoading sold comps…