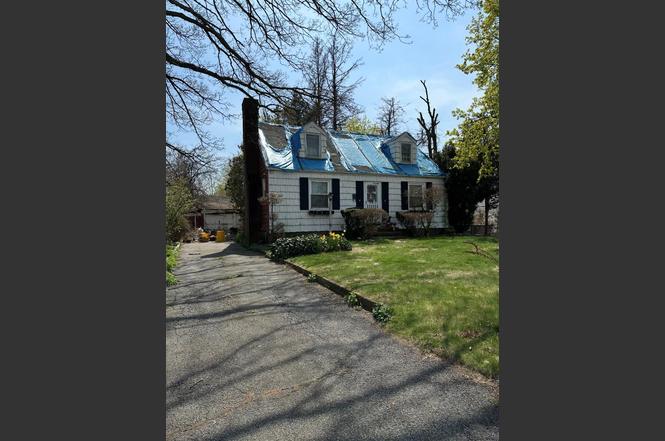
71 Sycamore Ave · Bethpage, NY
Flood risk 1/10 · Minimal
- FEMA flood zone
- X (unshaded)
- Chance of flooding over 30 yrs
- 0.0%
- Est. flood insurance / yr
- $473 – $860
Fire risk 1/10 · Minimal
- Est. fire insurance / yr
- $691 – $1,283
Heat risk 5/10 · Moderate
- Hot days now (above 95°F)
- 7 days/yr
- Hot days in 30 yrs
- 16 days/yr
Wind risk 6/10 · Moderate
- Chance of severe wind over 30 yrs
- 54.0%
Air-quality risk 4/10 · Minor
- Unhealthy air days now
- 5 days/yr
- Unhealthy air days in 30 yrs
- 7 days/yr
Risk factors via First Street. Map © Google.
Why this score? — see what drove the B- grade
The composite is a weighted blend of 9 inputs, each scored 0–100. Each bar is that input's sub-score; the figure is the points it added to the 100-point composite (weight × sub-score).
- Cash flow +23.5/30.0
- ARV discount +15.0/15.0
- DSCR +7.6/10.0
- Schools +7.2/10.0
- 1% rule +5.7/10.0
- Livability +4.0/5.0
- Rent growth +2.5/5.0
- Condition / age +2.5/5.0
- Appreciation +0.0/10.0
$425,000
🖨 Deal sheet (PDF) 📄 Offer letter ✓ Due diligence
Listing remarks
Two Seperate Lots Being Sold as One total 100 x 177
Key facts
- 0.39 acre lot
- 2 garage spots
- Built 1942
Neighborhood map
What this means for you Summary
Snapshot
- This is a 4-bed/1.0-bath single-family listed at $425k.
Deal economics
- At list price, monthly cash flow is $794 ($10k/yr) — positive.
- The deal already cash-flows at list — no discount required.
- Meets the 1% rule at list price ($5k rent vs $425k).
- Recommended offer: $400k (6.0% below list) — sets the bar for market timing.
- Cap rate 8.5% vs local median 3.2% in Bethpage — top-decile yield for the area; either an underpriced asset or a hidden risk that comps aren't pricing in. Stress-test before assuming the spread holds.
Location & tenants
- Location reads 79/100 on livability (#131 in NY, #2,116 nationally) — a middle-class / working-renter tenant base. Strengths: crime A+, commute A+, employment A+; Watch: amenities F, cost of living F.
- Bethpage Union Free School District (suburban): math 79% / reading 79% proficiency, ranked #45 of 590 in NY (top 8%) — strong family-tenant draw, lease renewals of 3-5y typical; only 9% free/reduced lunch — higher-income household profile.
- Zoned schools: Charles Campagne School (math 77% / reading 82%, grade A, #188 of 2,108 statewide, top 11%, 402 students, 20% FRL); John F Kennedy Middle School (math 72% / reading 81%, grade A, #47 of 729 statewide, top 7%, 717 students, 24% FRL); Bethpage Senior High School (math 98% / reading 98%, grade A+, #13 of 1,100 statewide, top 2%, 932 students, 27% FRL).
- Market conditions: 113 active listings in the ZIP; 5 comparable units currently listed for rent nearby; rentals leasing fast (median 0d on market — plan ~1-2 weeks tenant-placement turnaround); 40% of comp listings sitting > 30 days — soft ceiling on asking rent; 824 units permitted in Nassau County in 2024 (153 in 5+ unit buildings).
Forward outlook
- Local home prices are declining (-3.0%/yr); year-one equity from $3k of loan paydown is wiped out by about $13k of value loss. Plan a longer hold.
- Nassau County population projected at +7% by 2050 — modest demand growth; plan on rents tracking national, not racing it.
Negotiation context
- It's been on market 84 days — a 6% lower offer ($400k) is reasonable based on typical stale-listing flexibility.
Risks & watch-outs
- Watch-outs: built in 1942 — expect roof / HVAC / electrical / plumbing capex.
- Climate carrying-cost: major wind risk, 54% chance of damaging wind over 30y; extreme-heat days projected 7→16/yr by 2055 (HVAC capex compounding) — expect insurance premiums to compound above CPI over the hold.
Questions for the listing agent
- It's been on market 84 days. Have you received any prior offers? Is the seller open to a 6% concession, seller financing, or rate buy-down credit?
- Built in 1942 — when were the roof, HVAC, electrical panel, plumbing, and water heater last replaced?
- Why hasn't it sold? Are there any deal-killer items the seller is aware of (foundation, flood, title, zoning, code violations)?
- Is there a deadline driving the sale (1031 exchange, divorce, estate, relocation)? That informs how much negotiation room exists.
- Schools are A-rated — typically a magnet for longer-tenancy family renters. What's the average tenant stay here, and is there a school-zone premium baked into asking?
- What's the average days-on-market for RENTAL listings here right now (not sales)? A rising rental-DOM trend means longer vacancies and softer asking-rent achievability than the comps imply.
- What's the recent tenant-quality profile in this submarket — average credit score on applications, eviction rate, late-payment / NSF rate, and stable-employment percentage? A property-management company in the area should have these aggregated.
- How much new for-sale + rental construction is in the pipeline within 1–3 miles? Heavy new supply typically softens prices + rents 12–24 months out; constrained supply supports both.
Investment metrics
- 1% rule
- 1.07% ✓
- Cap rate
- 8.53%
- Cash-on-cash
- 8.01%
- DSCR
- 1.36
- GRM
- 7.8
CMA / ARV
- ARV (on-the-fly)
- $672,519
- Comps found
- 12
Show comp detail 12 sales within ~0.75 mi
| Address | Dist | Beds/Ba | Sqft | Sold | Price | $/sf | Match |
|---|---|---|---|---|---|---|---|
| 787 Stewart Ave | 0.12mi | 3/2.0 (-1) | 1,190 (+6%) | 3mo | $640,000 | $538 | 73 |
| 41 Meade Ave | 0.36mi | 3/2.0 (-1) | 1,120 (+0%) | 3mo | $730,000 | $652 | 72 |
| 207 N 3rd St | 0.21mi | 3/1.5 (-1) | 1,080 (-4%) | 9mo | $649,000 | $601 | 70 |
| 188 N 3rd St | 0.24mi | 4/2.0 | 1,190 (+6%) | 9mo | $660,000 | $555 | 67 |
| 104 Meade Ave | 0.55mi | 3/2.0 (-1) | 1,075 (-4%) | 2mo | $700,104 | $651 | 57 |
| 144 S 7th St | 0.45mi | 3/1.5 (-1) | 1,050 (-6%) | 7mo | $720,000 | $686 | 56 |
| 652 Stewart Ave | 0.42mi | 3/2.0 (-1) | 1,176 (+5%) | 11mo | $669,000 | $569 | 54 |
| 185 N 3rd St | 0.28mi | 4/2.0 | 1,275 (+14%) | 8mo | $725,000 | $569 | 53 |
| 91 S 3rd St | 0.46mi | 3/2.0 (-1) | 1,066 (-5%) | 11mo | $712,500 | $668 | 52 |
| 267 10th St | 0.48mi | 4/2.0 | 1,246 (+11%) | 11mo | $745,000 | $598 | 46 |
| 133 S 7th St | 0.55mi | 3/2.0 (-1) | 1,250 (+12%) | 7mo | $736,000 | $589 | 40 |
| 174 13th St | 0.62mi | 3/2.0 (-1) | 1,025 (-8%) | 10mo | $780,000 | $761 | 40 |
Match score weights: distance 35% · size 25% · config 20% · recency 20%. Top-matched comps best support the ARV.
Projected returns pro-forma
-3.0% appreciation · 3.0% rent growth · sell at horizon
- IRR
- -4.1%
- Equity multiple
- 0.85×
- Total profit
- $-18,320
- Equity at exit
- $63,369
- IRR
- 5.6%
- Equity multiple
- 1.41×
- Total profit
- $49,090
- Equity at exit
- $36,746
Cash invested: $119,000 (down + closing). Projections, not guarantees.
Landlord ↔ Tenant lean methodology
- Overall (STATE)
- 15 Strongly Tenant-Friendly
- State New York
- 15 Strongly Tenant-Friendly · D+10
- County
- — inherits STATE
- City
- — inherits STATE
ZIP-level market 11714
- Active inventory
- 113
- Price-to-rent
- 7.8×
Monthly cashflow live
- Estimated rent
- $4,547 high interval (Pro) →
- Mortgage (P&I)
- −$2,229
- Tax from tax record
- −$392 /mo · $4,706/yr
- Insurance
- −$177
- HOA
- −$0
- Vacancy / Maint / Mgmt
- −$955
- Net cashflow
- $794
Break-even live
Sensitivity live
| Price | -10% $1,035 | -5% $914 | +0% $794 | +5% $674 | +10% $553 |
|---|---|---|---|---|---|
| Rent | -10% $435 | -5% $614 | +0% $794 | +5% $974 | +10% $1,153 |
| Rate | -1.0pp $1,008 | -0.5pp $902 | base $794 | +0.5pp $684 | +1.0pp $572 |
UW: 25.0% down · 7.5% · 30yr · 1.5% tax · 5.0% vac · 8.0% maint · 8.0% mgmt
Financing live
Cash to close
- Down payment
- $106,250
- Closing costs
- $12,750
- Reserves months
- —
- Total cash needed
- —
Loan-product check · same deal, 3 products live
Conventional
25% down · 7.5% · 30yr
- Down + closing
- —
- Monthly P&I
- —
- Monthly cashflow
- —
- DSCR
- —
- Eligible?
- —
Personal DTI + credit; lowest rate.
DSCR
20% down · 8.5% · 30yr
- Down + closing
- —
- Monthly P&I
- —
- Monthly cashflow
- —
- DSCR
- —
- Eligible?
- —
No personal income docs; deal must DSCR.
Hard money
10% down · 12.0% · 12mo
- Down + closing
- —
- Monthly P&I
- —
- Monthly cashflow
- —
- DSCR
- —
- Eligible?
- —
Short-term bridge; refi at stabilization.
Rent comps 5 comps
| Address | Beds | Baths | Sqft | Rent | $/sqft | DOM | Units | Dist |
|---|---|---|---|---|---|---|---|---|
| 4 West Ct Bethpage, NY | 4.0 | 2.0 | 1075 | $4,500 | $4.19 | 0d | 1 | 0.25mi |
| 80 Ellen St Bethpage, NY | 4.0 | 2.0 | 1464 | $4,999 | $3.41 | 0d | 1 | 0.60mi |
| 152 Harrison Ave Unit A Bethpage, NY | 4.0 | 2.0 | 1200 | $4,200 | $3.50 | 44d | 1 | 0.96mi |
| 8 Farmedge Rd Bethpage, NY | 4.0 | 2.0 | 1269 | $4,500 | $3.55 | 0d | 1 | 1.33mi |
| 3685 Prairie Path Bethpage, NY | 3.0 | 2.0 | 1300 | $4,500 | $3.46 | 44d | 1 | 1.35mi |
Listing history 3 events
-
2025-08-04status Pending
-
2025-08-04price $425,000
-
2025-04-22$750,000 Active
ⓘ Source: listings_history table (triggers on properties + properties_extension) + one-shot
backfill from property_details.listing_events for pre-trigger history.
Tax reassessment forecast NY · Partial reset (capped growth)
- Current annual tax
- $4,706 · $392/mo
- Projected year-2 tax
- $5,944 · $495/mo
- Expected delta
- +$1,238/yr (+$103/mo · 26.3%)
ⓘ Screening estimate from a state-policy table — verify with the county assessor before closing.
Climate risk First Street
- Flood 1/10 Low FEMA zone X (unshaded) · 0% chance over 30 yrs
- Wildfire 1/10 Low
- Heat 5/10 Major 7 d/yr ≥95°F today · 16 d/yr by 30 yrs out
- Wind 6/10 Major 54% chance of damaging wind over 30 yrs
- Air quality 4/10 Moderate 5 unhealthy d/yr today · 7 by 30 yrs out
Nearby sold comps map
Loading sold comps map…
Walkable amenities ~0.75 mi
Loading nearby amenities…
Taxation est. · year 1
- Rental income
- $54,561
- − Mortgage interest
- −$23,807
- − Property taxes
- −$4,706
- − Insurance
- −$2,125
- − Repairs & maintenance
- −$4,365
- − Management
- −$4,365
- − Depreciation
- −$12,364
- Taxable income
- $2,830
- Est. tax owed @ 24.0%
- −$679
- After-tax cash flow
- $8,848/yr
For passive investors: Depreciation is non-cash, so a rental often shows a tax loss while cash-flowing — sheltering income. Rental losses are passive: they offset passive income freely, and up to $25,000/yr can offset ordinary (W-2) income if you actively participate and your MAGI is under $100k (phasing out to $0 by $150k); unused losses carry forward. On sale, claimed depreciation is recaptured at up to 25%, and gains may owe capital-gains tax (a 1031 exchange can defer both). Figures are a year-1 estimate at your 24.0% rate — not tax advice; consult a CPA.
Schools (NCES district)
- District
- Bethpage Union Free School District
- NCES district ID
- 3604740
- Math proficiency
- 79% ▼ -3.00%
- Reading proficiency
- 79% ▲ 3.00%
- Median HH income
- $98,909
- Composite
- 71.51/100
- National rank
- #224
- State rank
- #45 of 590 in NY
Livability — Bethpage
- Score
- 79/100
- State rank
- #131
- US rank
- #2116
Category grades
Schools grade is shown separately in the Schools card above.
Census & demographics
- Census place
- Bethpage, NY
- City population
- 22,475
- Population (ZIP)
- 22,475
Population outlook (Nassau County) Hauer SSP2
- Today (2025)
- 1,409,302 people
- By 2030
- 1,431,482 · +1.6%
- By 2040
- 1,471,607 · +4.4%
- By 2050
- 1,502,845 · +6.6%
- By 2075
- 1,575,403 · +11.8%
- By 2100
- 1,554,356 · +10.3%
Race, ethnicity, and origin ACS 2023
- Neighborhood character
- Predominantly White (69%)
- Race & ethnicity
- White 69% Asian 14% Hispanic / Latino 14% Two or more races 8%
- Hispanic origin (detail)
- Mexican 2% Puerto Rican 4%
- Common ancestry
- Romanian 3% Lithuanian 1% Scotch-Irish 1%
- Foreign-born
- 17% · Canada, China, Jamaica
- Languages at home
- 76% English-only · Other Indo-European 13% Spanish 6% Chinese 2%
Political lean MEDSL · Nassau
- 2024 margin
- Toss-up / Even · D 47.9% · R 52.1%
- 2008→2024 swing
- -12.6pp toward R · 2008: 8.4pp · 2024: -4.2pp
- All cycles
- 2024: R+4.2 2020: D+9.5 2016: D+5.3 2012: D+6.7 2008: D+8.4
Not yet ingested
- Civics
- —
Market trends
- HPI YoY
- ▼ -803.80%
- Current HPI
- 311.8915
- Rent YoY
- —
- Metro
- —
- State GDP YoY
- ▲ 2.60%
- F500 in state
- 92
Industry mix (Fortune 500 HQ in NY)
| Industry | F500 HQs | Revenue |
|---|---|---|
| Financial Services | 10 | $950B |
|
||
| Consumer Goods | 9 | $162B |
|
||
| Insurance | 4 | $225B |
|
||
| Telecommunications | 2 | $144B |
|
||
| Pharmaceuticals | 2 | $112B |
|
||
| Media / Entertainment | 2 | $69B |
|
||
Price history
-43.3% since first listed3 events — show timeline
- 2025-08-04 Pending — OneKey® MLS as Distributed by MLS Grid
- 2025-08-04 Price Changed $425,000 OneKey® MLS as Distributed by MLS Grid
- 2025-04-22 Listed $750,000 OneKey® MLS as Distributed by MLS Grid
Property tax history
-3.5%/yrLatest (2024): $4,706 · -10.3% YoY. Source: county tax records.
Cash-flow waterfall
monthlySold comps — $/sqft
last 12 mo · ≤1 miLoading sold comps…