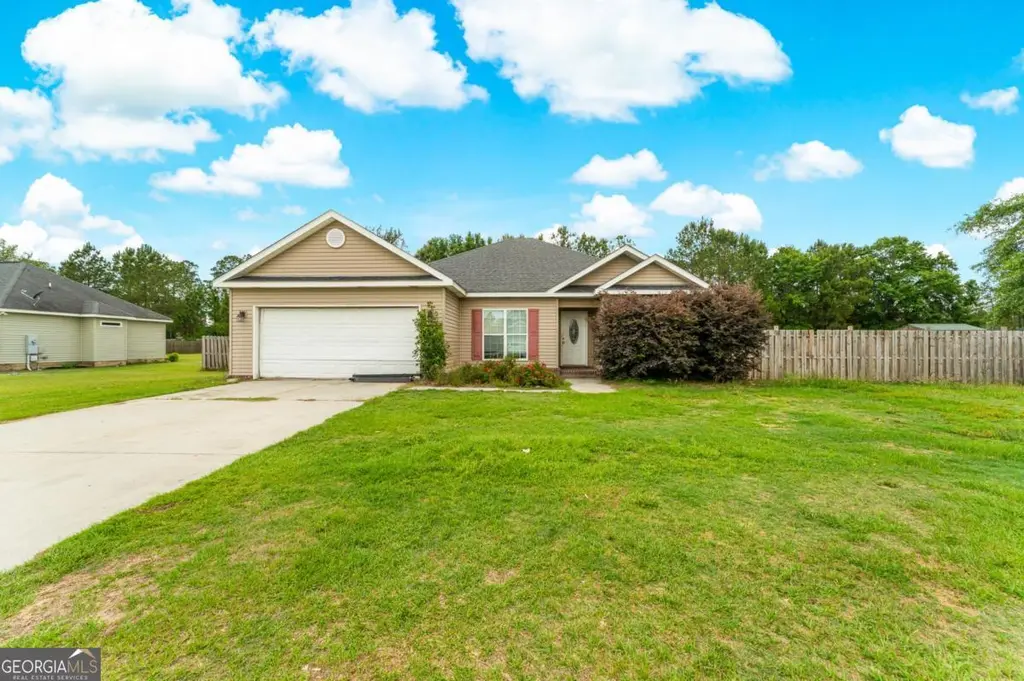
102 Keylime Ln · Guyton, GA
Flood risk 1/10 · Minimal
- FEMA flood zone
- X (unshaded)
- Chance of flooding over 30 yrs
- 0.0%
- Est. flood insurance / yr
- $507 – $1,088
Fire risk 5/10 · Moderate
- Est. fire insurance / yr
- $963 – $1,789
Heat risk 9/10 · Severe
- Hot days now (above 110°F)
- 7 days/yr
- Hot days in 30 yrs
- 19 days/yr
Wind risk 8/10 · Major
- Chance of severe wind over 30 yrs
- 97.0%
Air-quality risk 2/10 · Minimal
- Unhealthy air days now
- 2 days/yr
- Unhealthy air days in 30 yrs
- 2 days/yr
Risk factors via First Street. Map © Google.
Why this score? — see what drove the C- grade
The composite is a weighted blend of 9 inputs, each scored 0–100. Each bar is that input's sub-score; the figure is the points it added to the 100-point composite (weight × sub-score).
- Cash flow +15.3/30.0
- ARV discount +15.0/15.0
- DSCR +4.7/10.0
- 1% rule +4.5/10.0
- Schools +4.3/10.0
- Livability +3.5/5.0
- Rent growth +2.5/5.0
- Condition / age +2.5/5.0
- Appreciation +0.0/10.0
$239,000
🖨 Deal sheet 📄 Offer letter ✓ Due diligence
Listing remarks MLS
NEW HOME, CATHEDRAL IN GREAT ROOM, TRAY CEILING IN MASTER BEDROOM, LARGE UTILITY ROOM, COVERED FRONT PORCH.
Key facts
- 0.52 acre lot
- 2 garage spots
- Built 2015
Property features AI
Finance
- Other: Zoned PD
Exterior
- Parking: Attached garage with garage door opener; 2 garage spaces
- Utilities: Public water; Public sewer
- Home design: Single-family residence; One-story
- Construction: Vinyl siding; Composition roof
- Exterior features: Patio; Wood privacy fencing (fenced)
Interior
- Bathrooms: 2 full bathrooms
- Heating & cooling: Central electric heating; Central electric cooling
- Interior features: Electric water heater; No basement
- Laundry & utility: Laundry room
Neighborhood map
What this means for you Summary
Snapshot
- This is a 3-bed/2.0-bath single-family listed at $239k.
Deal economics
- At list price, monthly cash flow is $86 ($1k/yr) — positive.
- The deal already cash-flows at list — no discount required.
- To meet the 1% rule (rent ≥ 1% of price), the offer needs to be $228k (4.7% below list).
- Recommended offer: $228k (4.7% below list) — sets the bar for 1% rule.
- Cap rate 6.7% vs local median 4.5% in Guyton — top-decile yield for the area; either an underpriced asset or a hidden risk that comps aren't pricing in. Stress-test before assuming the spread holds.
Location & tenants
- Location reads 69/100 on livability (#128 in GA) — a middle-class / working-renter tenant base. Strengths: crime A+, cost of living A+, housing A+; Watch: schools C-, amenities F, commute F.
- Effingham County (rural): math 49% / reading 48% proficiency, ranked #16 of 174 in GA (top 9%) — families likely to look elsewhere, expect single-tenant / working-renter base with shorter leases.
- Market conditions: 399 active listings in the ZIP; solid renter incomes; 836 units permitted in Effingham County in 2024 (46 in 5+ unit buildings).
Forward outlook
- Local home prices are declining (-3.0%/yr); year-one equity from $2k of loan paydown is wiped out by about $7k of value loss. Plan a longer hold.
- Effingham County population projected at +33% by 2050 — long-run rental-demand tailwind backs the buy-and-hold thesis.
Negotiation context
- It's been on market 16 days — a 2% lower offer ($235k) is reasonable based on typical stale-listing flexibility.
- 5 sale attempts since 13y ago with the ask held roughly flat each time — persistent listings suggest the price (not the market) is what's stuck; bring a comps-based counter.
- Current owner paid $135k; list at $239k implies a 77% gain — meaningful room to come down on a strong offer.
Risks & watch-outs
- Climate carrying-cost: severe wind risk, 97% chance of damaging wind over 30y; moderate wildfire risk; extreme-heat days projected 7→19/yr by 2055 (HVAC capex compounding) — expect insurance premiums to compound above CPI over the hold.
Questions for the listing agent
- Is there a deadline driving the sale (1031 exchange, divorce, estate, relocation)? That informs how much negotiation room exists.
- What's the average days-on-market for RENTAL listings here right now (not sales)? A rising rental-DOM trend means longer vacancies and softer asking-rent achievability than the comps imply.
- What's the recent tenant-quality profile in this submarket — average credit score on applications, eviction rate, late-payment / NSF rate, and stable-employment percentage? A property-management company in the area should have these aggregated.
- How much new for-sale + rental construction is in the pipeline within 1–3 miles? Heavy new supply typically softens prices + rents 12–24 months out; constrained supply supports both.
Investment metrics
- 1% rule
- 0.95% ✗
- Cap rate
- 6.73%
- Cash-on-cash
- 1.55%
- DSCR
- 1.07
- GRM
- 8.7
CMA / ARV
- ARV (median comp)
- $326,735
- List price
- $239,000
- Delta
- -26.85%
- Verdict
- UNDERPRICED
- Comps
- 20 within 1.0 mi
Show comp detail 12 sales within ~0.75 mi
| Address | Dist | Beds/Ba | Sqft | Sold | Price | $/sf | Match |
|---|---|---|---|---|---|---|---|
| 219 Cyane Ln | 0.33mi | 3/2.0 | 1,417 (+1%) | 1mo | $308,000 | $217 | 82 |
| 108 Kingsley Dr S | 0.09mi | 3/2.0 | 1,438 (+3%) | 12mo | $310,000 | $216 | 82 |
| 105 Kingsley Dr S | 0.08mi | 3/2.0 | 1,420 (+1%) | 17mo | $320,000 | $225 | 80 |
| 105 Amelia Ct | 0.13mi | 3/2.0 | 1,465 (+4%) | 13mo | $328,000 | $224 | 75 |
| 106 Kingsley Dr S | 0.07mi | 3/2.0 | 1,436 (+2%) | 22mo | $320,000 | $223 | 75 |
| 240 Cyane Ln | 0.20mi | 3/2.0 | 1,492 (+6%) | 11mo | $324,800 | $218 | 70 |
| 226 Cyane Ln | 0.34mi | 3/2.0 | 1,463 (+4%) | 9mo | $310,000 | $212 | 69 |
| 100 N Kingsley Dr | 0.09mi | 3/2.0 | 1,609 (+15%) | 5mo | $350,000 | $218 | 67 |
| 301 Saranac Way | 0.53mi | 3/2.0 | 1,446 (+3%) | 9mo | $310,000 | $214 | 62 |
| 104 Benicia Ln | 0.60mi | 3/2.0 | 1,463 (+4%) | 11mo | $310,000 | $212 | 55 |
| 103 Benicia Ln | 0.63mi | 3/2.0 | 1,590 (+13%) | 2mo | $320,000 | $201 | 46 |
| 310 Saranac Way | 0.52mi | 3/2.0 | 1,274 (-9%) | 21mo | $285,000 | $224 | 43 |
Match score weights: distance 35% · size 25% · config 20% · recency 20%. Top-matched comps best support the ARV.
Projected returns pro-forma
-3.0% appreciation · 3.0% rent growth · sell at horizon
- IRR
- -13.8%
- Equity multiple
- 0.50×
- Total profit
- $-33,166
- Equity at exit
- $35,636
- IRR
- -4.9%
- Equity multiple
- 0.68×
- Total profit
- $-21,518
- Equity at exit
- $20,664
Cash invested: $66,920 (down + closing). Projections, not guarantees.
Landlord ↔ Tenant lean methodology
- Overall (STATE)
- 90 Strongly Landlord-Friendly
- State Georgia
- 90 Strongly Landlord-Friendly · R+3
- County
- — inherits STATE
- City
- — inherits STATE
ZIP-level market 31312
- Home prices YoY
- -26.6%
- Active inventory
- 399
- Price-to-rent
- 8.7×
Monthly cashflow live
- Estimated rent
- $2,278 medium interval (Pro) →
- Mortgage (P&I)
- −$1,253
- Tax from tax record
- −$360 /mo · $4,323/yr
- Insurance
- −$100
- HOA
- −$0
- Vacancy / Maint / Mgmt
- −$478
- Net cashflow
- $86
Break-even live
UW: 25.0% down · 7.5% · 30yr · 1.5% tax · 5.0% vac · 8.0% maint · 8.0% mgmt
Financing live
Cash to close
- Down payment
- $59,750
- Closing costs
- $7,170
- Reserves months
- —
- Total cash needed
- —
Loan-product check · same deal, 3 products live
Conventional
25% down · 7.5% · 30yr
- Down + closing
- —
- Monthly P&I
- —
- Monthly cashflow
- —
- DSCR
- —
- Eligible?
- —
Personal DTI + credit; lowest rate.
DSCR
20% down · 8.5% · 30yr
- Down + closing
- —
- Monthly P&I
- —
- Monthly cashflow
- —
- DSCR
- —
- Eligible?
- —
No personal income docs; deal must DSCR.
Hard money
10% down · 12.0% · 12mo
- Down + closing
- —
- Monthly P&I
- —
- Monthly cashflow
- —
- DSCR
- —
- Eligible?
- —
Short-term bridge; refi at stabilization.
Listing history 8 events
-
2026-05-13$239,000 Active 255-char remark
-
2026-05-13$239,000 New 258-char remark
-
2015-04-24soldstatus $134,900
Show marketing remark (108 chars)
NEW HOME, CATHEDRAL IN GREAT ROOM, TRAY CEILING IN MASTER BEDROOM, LARGE UTILITY ROOM, COVERED FRONT PORCH.
-
2014-12-22$133,650
Show marketing remark (108 chars)
NEW HOME, CATHEDRAL IN GREAT ROOM, TRAY CEILING IN MASTER BEDROOM, LARGE UTILITY ROOM, COVERED FRONT PORCH.
-
2014-07-16historical
-
2014-07-15historical
-
2013-07-29$35,000
-
2013-07-29$35,000
ⓘ Source: listings_history table (triggers on properties + properties_extension) + one-shot
backfill from property_details.listing_events for pre-trigger history.
Tax reassessment forecast GA · Resets to sale price
- Current annual tax
- $4,323 · $360/mo
- Projected year-2 tax
- $4,323 · $360/mo
- Expected delta
- $0/yr ($0/mo · 0.0%)
ⓘ Screening estimate from a state-policy table — verify with the county assessor before closing.
Climate risk First Street
- Flood 1/10 Low FEMA zone X (unshaded) · 0% chance over 30 yrs
- Wildfire 5/10 Major
- Heat 9/10 Extreme 7 d/yr ≥110°F today · 19 d/yr by 30 yrs out
- Wind 8/10 Severe 97% chance of damaging wind over 30 yrs
- Air quality 2/10 Low 2 unhealthy d/yr today · 2 by 30 yrs out
Nearby sold comps map
Loading sold comps map…
Walkable amenities ~0.75 mi
Loading nearby amenities…
Taxation est. · year 1
- Rental income
- $27,332
- − Mortgage interest
- −$13,388
- − Property taxes
- −$4,323
- − Insurance
- −$1,195
- − Repairs & maintenance
- −$2,187
- − Management
- −$2,187
- − Depreciation
- −$6,953
- Taxable loss
- −$2,899
- Est. tax savings @ 24.0%
- +$696
- After-tax cash flow
- $1,730/yr
For passive investors: Depreciation is non-cash, so a rental often shows a tax loss while cash-flowing — sheltering income. Rental losses are passive: they offset passive income freely, and up to $25,000/yr can offset ordinary (W-2) income if you actively participate and your MAGI is under $100k (phasing out to $0 by $150k); unused losses carry forward. On sale, claimed depreciation is recaptured at up to 25%, and gains may owe capital-gains tax (a 1031 exchange can defer both). Figures are a year-1 estimate at your 24.0% rate — not tax advice; consult a CPA.
Schools (NCES district)
- District
- Effingham County
- NCES district ID
- 1301980
- Math proficiency
- 49% ▼ -6.00%
- Reading proficiency
- 48% ▼ -5.00%
- Median HH income
- $60,503
- Composite
- 42.56/100
- National rank
- #3195
- State rank
- #16 of 174 in GA
Livability — Guyton
- Score
- 69/100
- State rank
- #128
- US rank
- #9058
Category grades
Schools grade is shown separately in the Schools card above.
Census & demographics
- County
- Effingham County · 68,439 people
- City population
- 25,991
- Metro
- Savannah, GA
- Population (ZIP)
- 25,991
- Household income
- $101,750
- Rent vs Own
- Severe rent burden
- 97.0
Population outlook (Effingham County) Hauer SSP2
- Today (2025)
- 67,399 people
- By 2030
- 72,297 · +7.3%
- By 2040
- 81,602 · +21.1%
- By 2050
- 89,494 · +32.8%
- By 2075
- 105,976 · +57.2%
- By 2100
- 111,943 · +66.1%
Race, ethnicity, and origin ACS 2023
- Neighborhood character
- Predominantly White (75%)
- Race & ethnicity
- White 75% Black 11% Two or more races 9% Hispanic / Latino 7%
- Hispanic origin (detail)
- Mexican 3% Puerto Rican 2% Cuban 1%
- Common ancestry
- Slovak 2% Italian 2% Lithuanian 1%
- Foreign-born
- 3% · Canada
- Languages at home
- 96% English-only · Spanish 2%
Political lean MEDSL · Effingham
- 2024 margin
- Solid R (+49.1) · D 25.2% · R 74.3%
- 2008→2024 swing
- +1.6pp toward D · 2008: -50.7pp · 2024: -49.1pp
- All cycles
- 2024: R+49.1 2020: R+49.5 2016: R+55.6 2012: R+51.2 2008: R+50.7
Not yet ingested
- Civics
- —
Market trends
- HPI YoY
- ▼ -74.77%
- Current HPI
- 205.9899
- Rent YoY
- —
- Metro
- Savannah, GA
- State GDP YoY
- ▲ 2.66%
- F500 in state
- 28
Industry mix (Fortune 500 HQ in GA)
| Industry | F500 HQs | Revenue |
|---|---|---|
| Paper / Packaging | 2 | $29B |
|
||
| Retail | 1 | $160B |
|
||
| Transportation / Logistics | 1 | $91B |
|
||
| Airlines | 1 | $62B |
|
||
| Consumer Goods | 1 | $47B |
|
||
| Utilities | 1 | $25B |
|
||
Price history
+582.9% since first listed10 events — show timeline
- 2026-05-30 Listing Removed — GAMLS
- 2026-05-29 Listing Removed — Hive MLS
- 2026-05-13 Listed $239,000 Hive MLS
- 2026-05-13 Listed $239,000 GAMLS
- 2015-04-24 Sold (MLS) $134,900 GAMLS
- 2014-12-22 Listed $133,650 GAMLS
- 2014-07-16 Listing Removed — GAMLS
- 2014-07-15 Listing Removed — Hive MLS
- 2013-07-29 Listed $35,000 Hive MLS
- 2013-07-29 Listed $35,000 GAMLS
Property tax history
+33.1%/yrLatest (2025): $4,323 · +23.1% YoY. Source: county tax records.
Cash-flow waterfall
monthlySold comps — $/sqft
last 12 mo · ≤1 miLoading sold comps…